Operational Dashboard
Operational Dashboard is a tool designed to give you a detailed view of cluster performance and resource utilization. It provides insights through key metrics, trends, and usage patterns, helping you make informed decisions, optimize resource allocation, and proactively manage your cluster operations.
It has the following features:
Comprehensive Visibility: Displays key metrics such as active users, job submissions, node counts, storage utilization, and table statistics, providing a detailed snapshot of cluster activity.
Efficient Resource Management: Tracks HDFS storage trends, CPU and memory allocation, and resource utilization by business units, enabling optimal resource allocation and identifying areas for improvement.
Informed Decision-Making: Provides actionable insights through trends in resource usage, job counts, and table sizes, helping you make data-driven decisions for scaling and optimizing resources.
Proactive Issue Detection: Monitors trends in table counts, HDFS files count, and active users, allowing you to identify and address anomalies before they impact performance.
Improved Efficiency: The dashboard helps enhance cluster performance and reduce operational costs.
Easy Sharing: Allows you to enter your email and submit a request to receive the report, making it easy to share insights and collaborate with your team.
Prerequisites
On the Unravel UI, from the upper-right corner, click
 and select API Tokens.
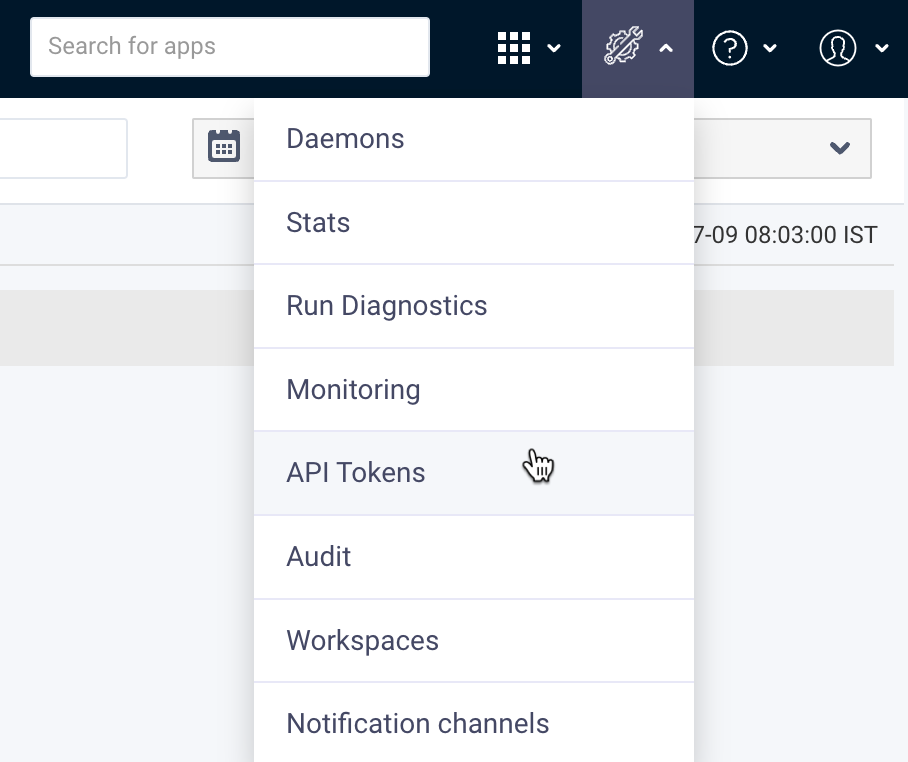
Click New. The New API dialog box is displayed.
Set the client ID to Operational.
Assign the role as User.
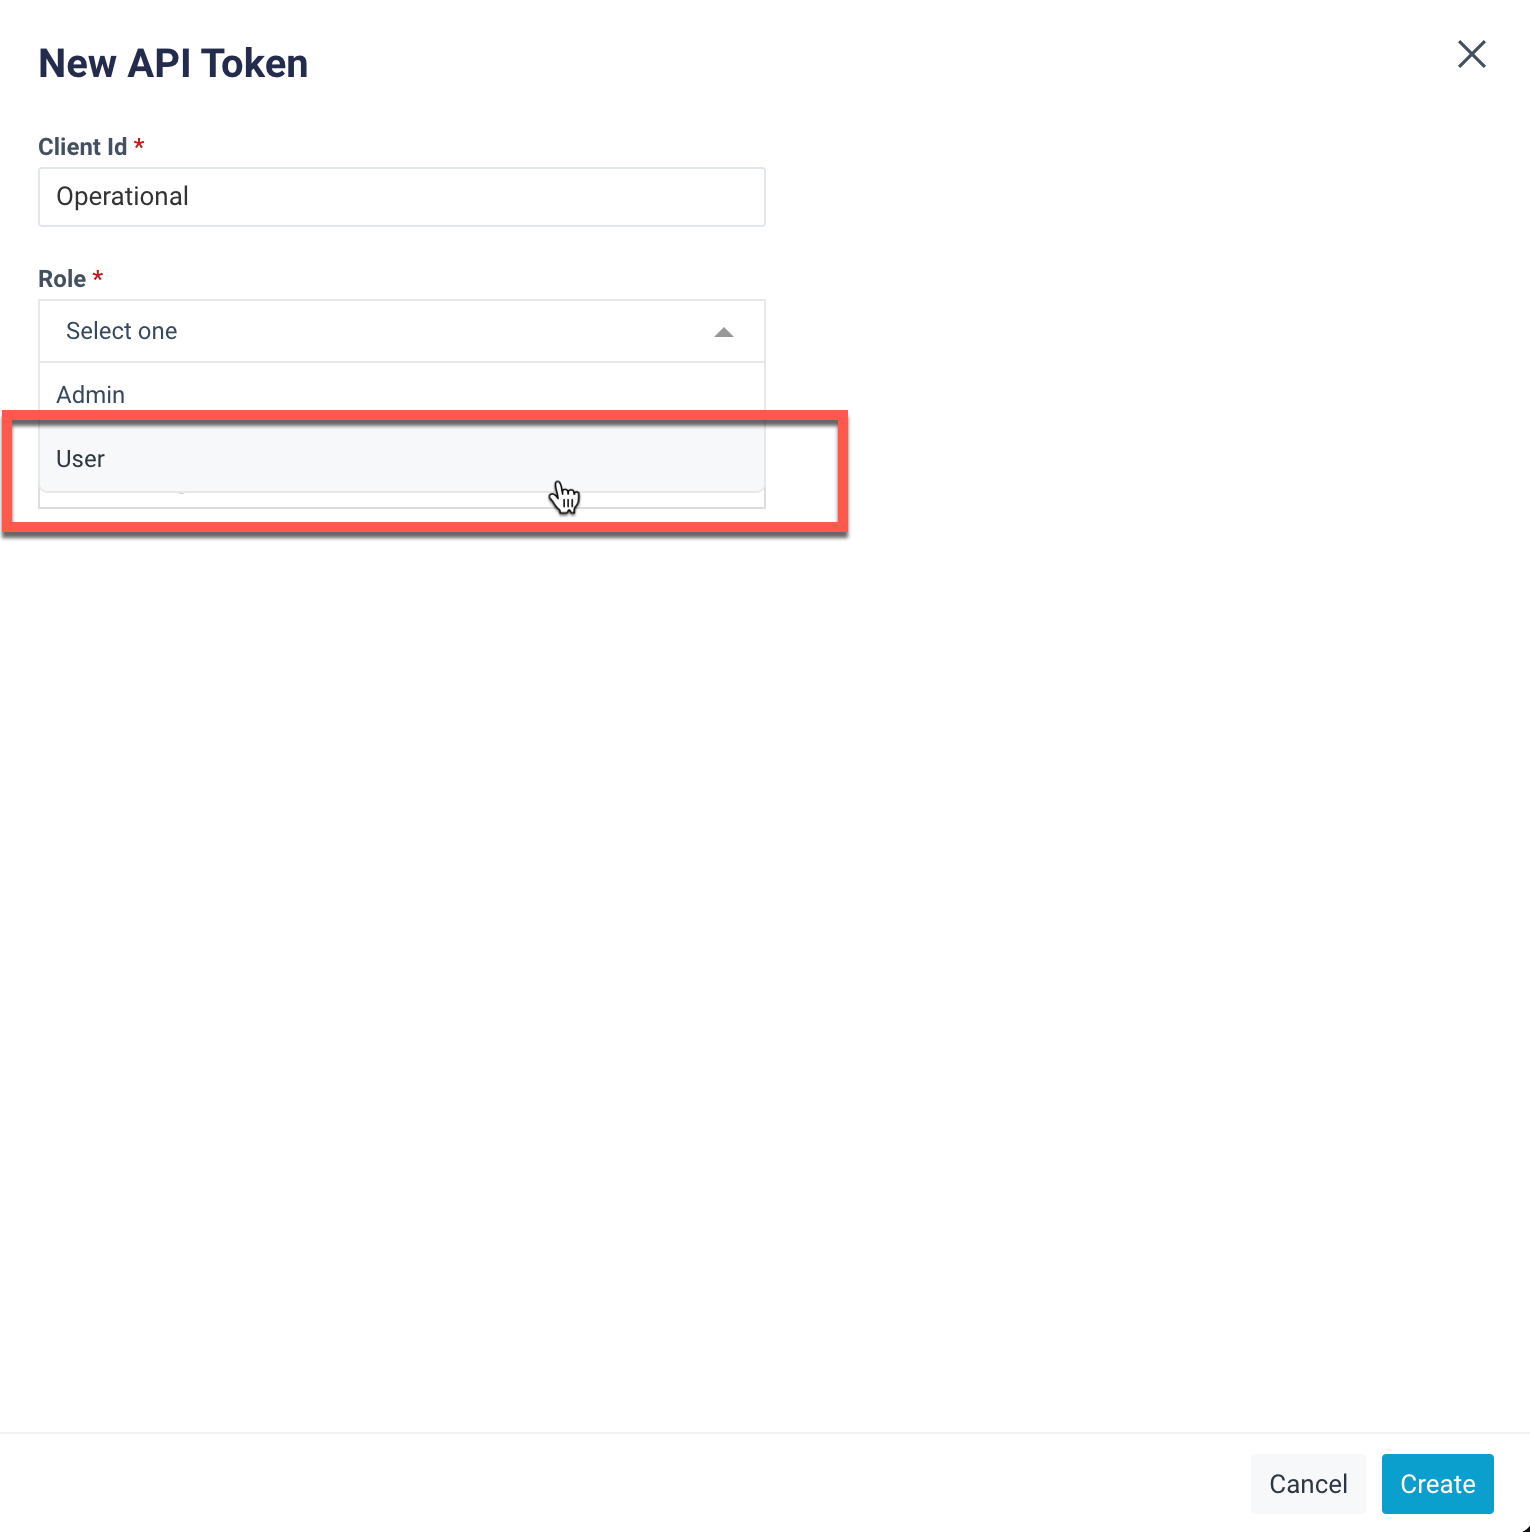
Click Create to generate the API token.
Schedule a Capacity Forecasting Report
To schedule a capacity forecasting report, follow these steps:
On the Unravel UI, navigate to the Reports page.
Beside the Capacity Forecasting Report, click Schedule.
Under History, select Last 90 Days.
In the Forecasting Days field, enter 1 This value is mandatory but will not be considered in the report.
Set the Schedule Name to Operational.
Set the Schedule to Run as Daily.
Click the Schedule button at the bottom of the page.
Installing and opening Operational Dashboard app
Refer to Installing apps. to install and launch the app.
Refer to Launching Operational Dashboard app.
Using the Operational Dashboard app
On the Unravel UI, from the upper-right corner, click
 . The App Store page is displayed.
Click the Operational Dashboard image to open the app.
Select the desired time range and cluster and click Submit. The following Dashboards are displayed:
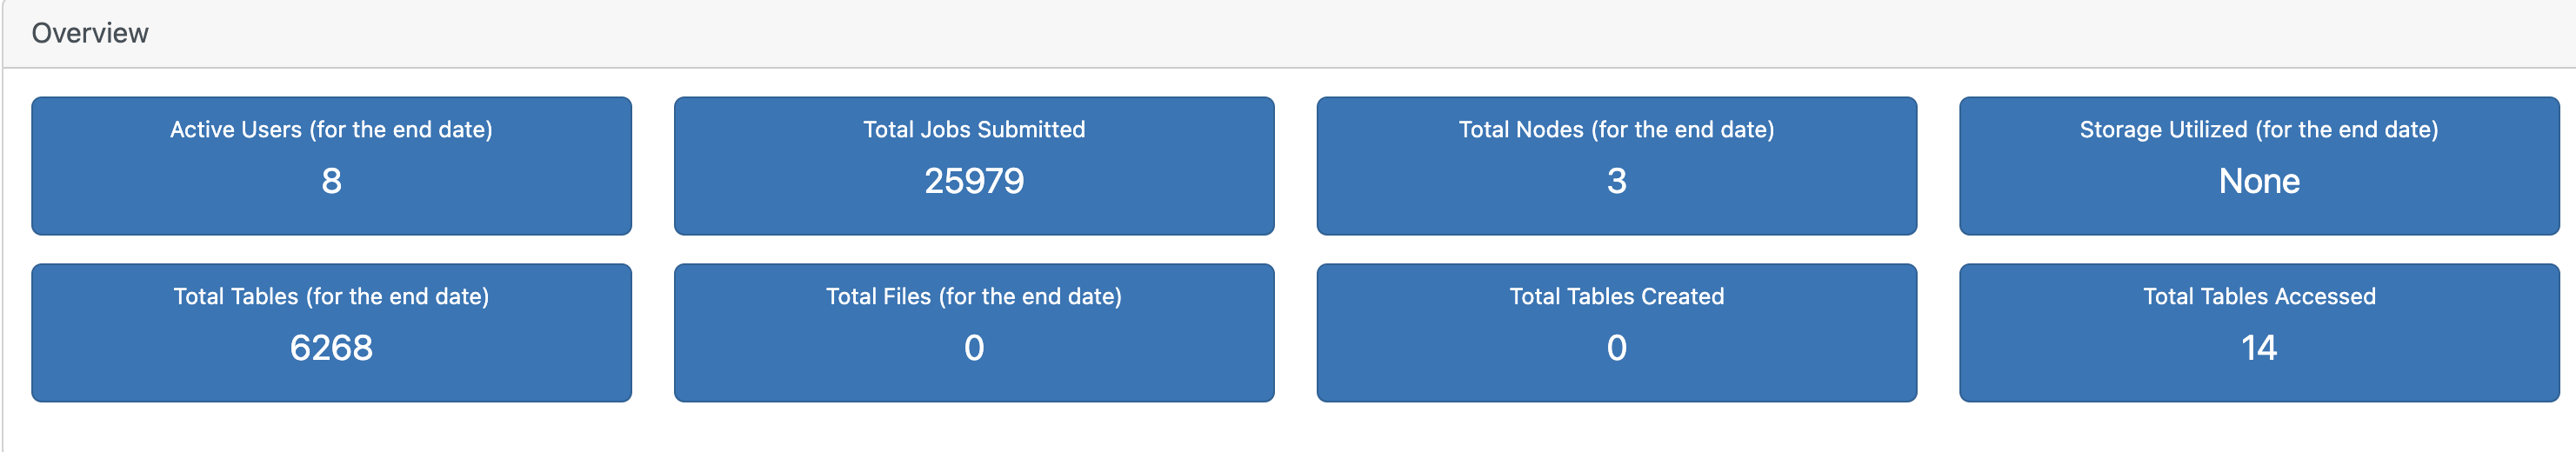
Overview
This section provides key metrics for the selected cluster:
Active Users (End Date): Number of active users at the end date.
Total Jobs Submitted: Number of jobs submitted.
Total Nodes (End Date): Number of nodes at the end date.
Storage Utilized (End Date): Amount of storage utilized at the end date.
Total Tables (End Date): Number of tables at the end date.
Total Files (End Date): Number of files at the end date.
Total Tables Created: Number of tables created.
Total Tables Accessed: Number of tables accessed.
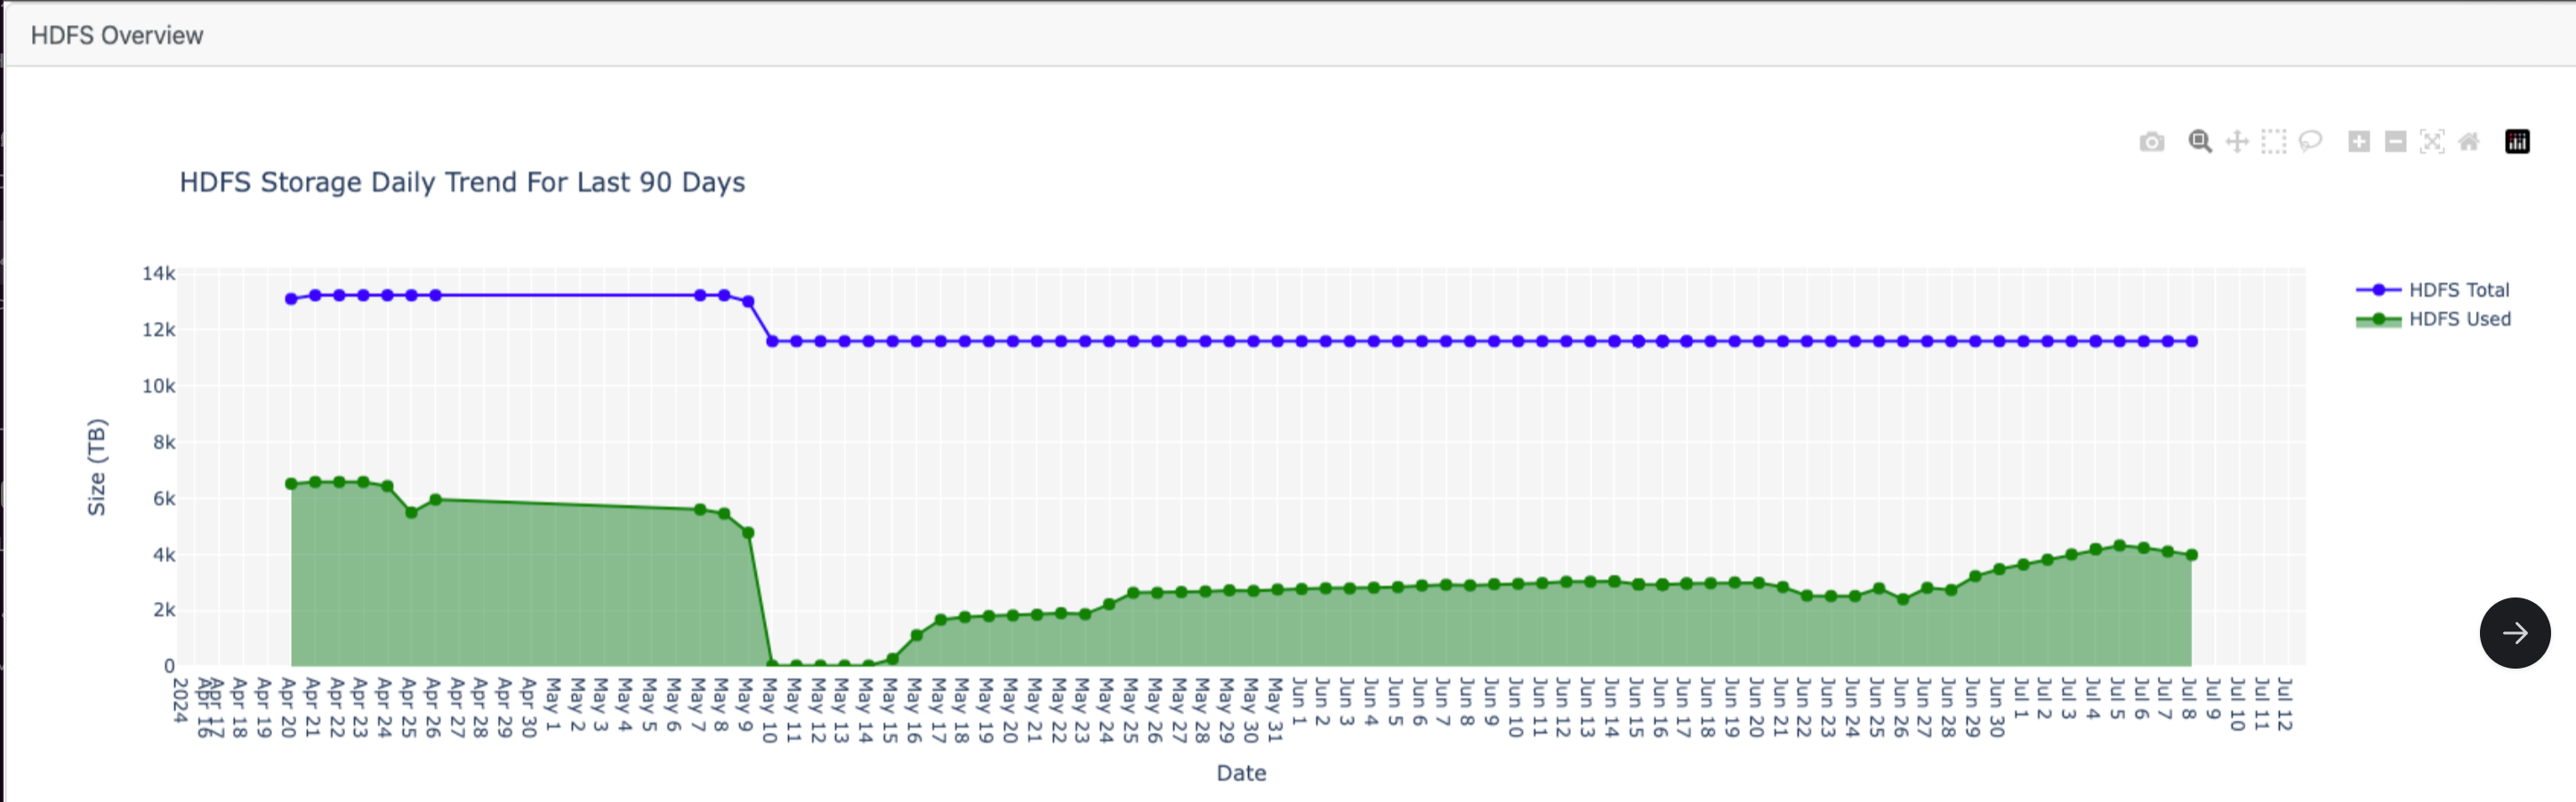
HDFS Overview
This section provides insights into HDFS storage:
HDFS Storage Daily Trends (Last 90 Days): Shows HDFS total and HDFS used.
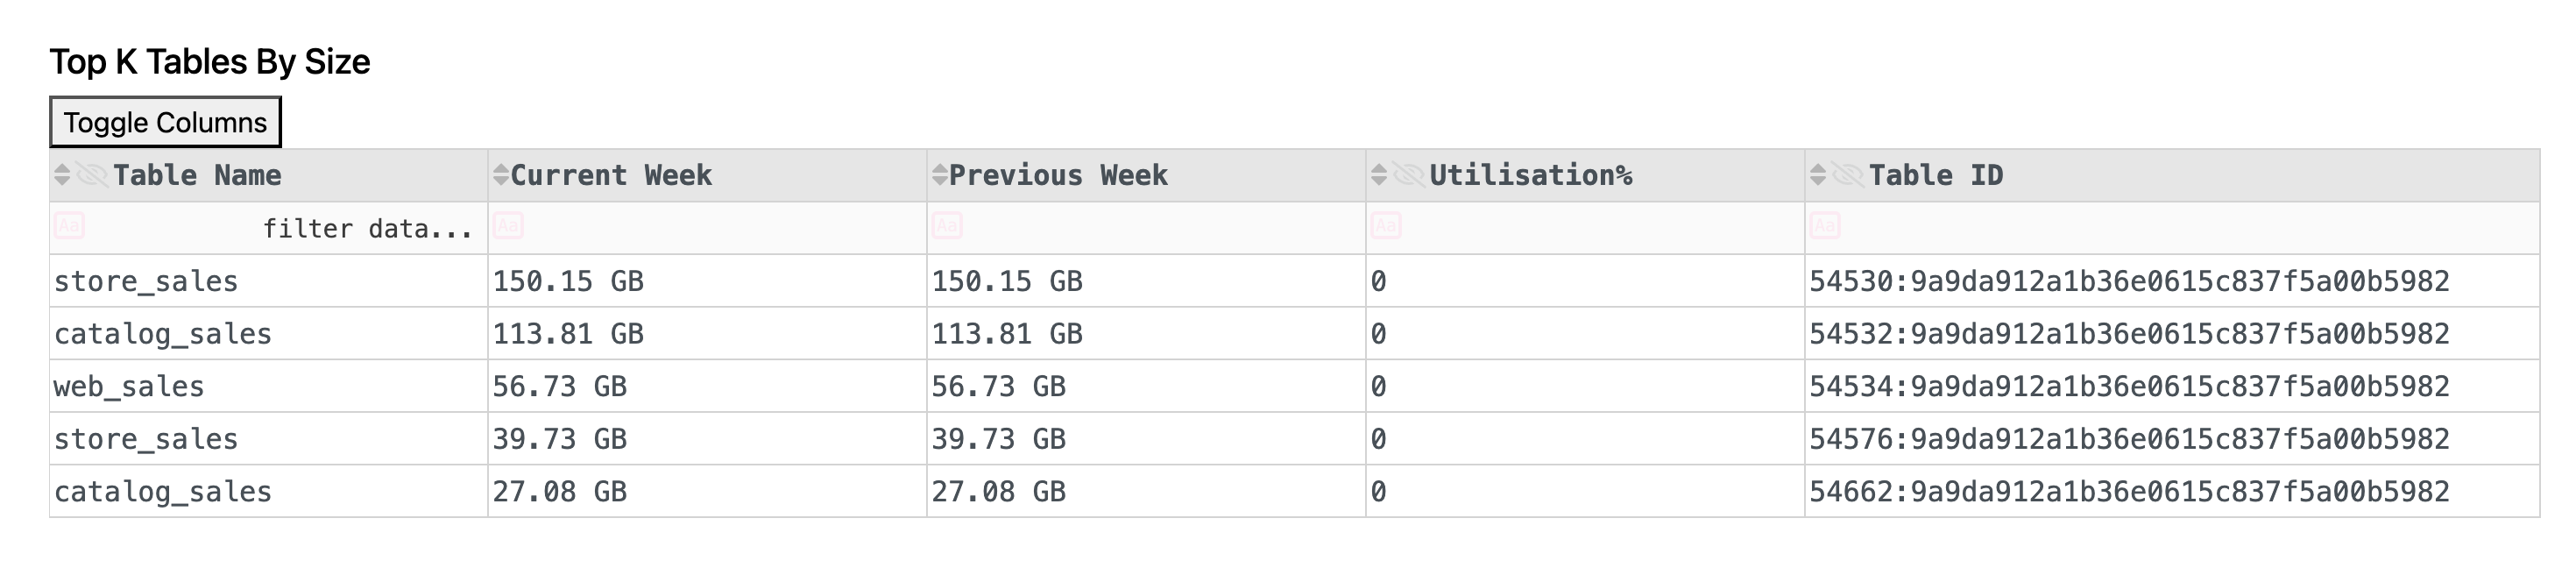
Top K Tables by Size
This section displays the top K tables by size:
Table Name: Name of the table.
Table ID: ID of the table.
Current Week (Size): Size of the table in the current week.
Previous Week (Size): Size of the table in the previous week.
Utilization (Percentage): Percentage of utilization change.
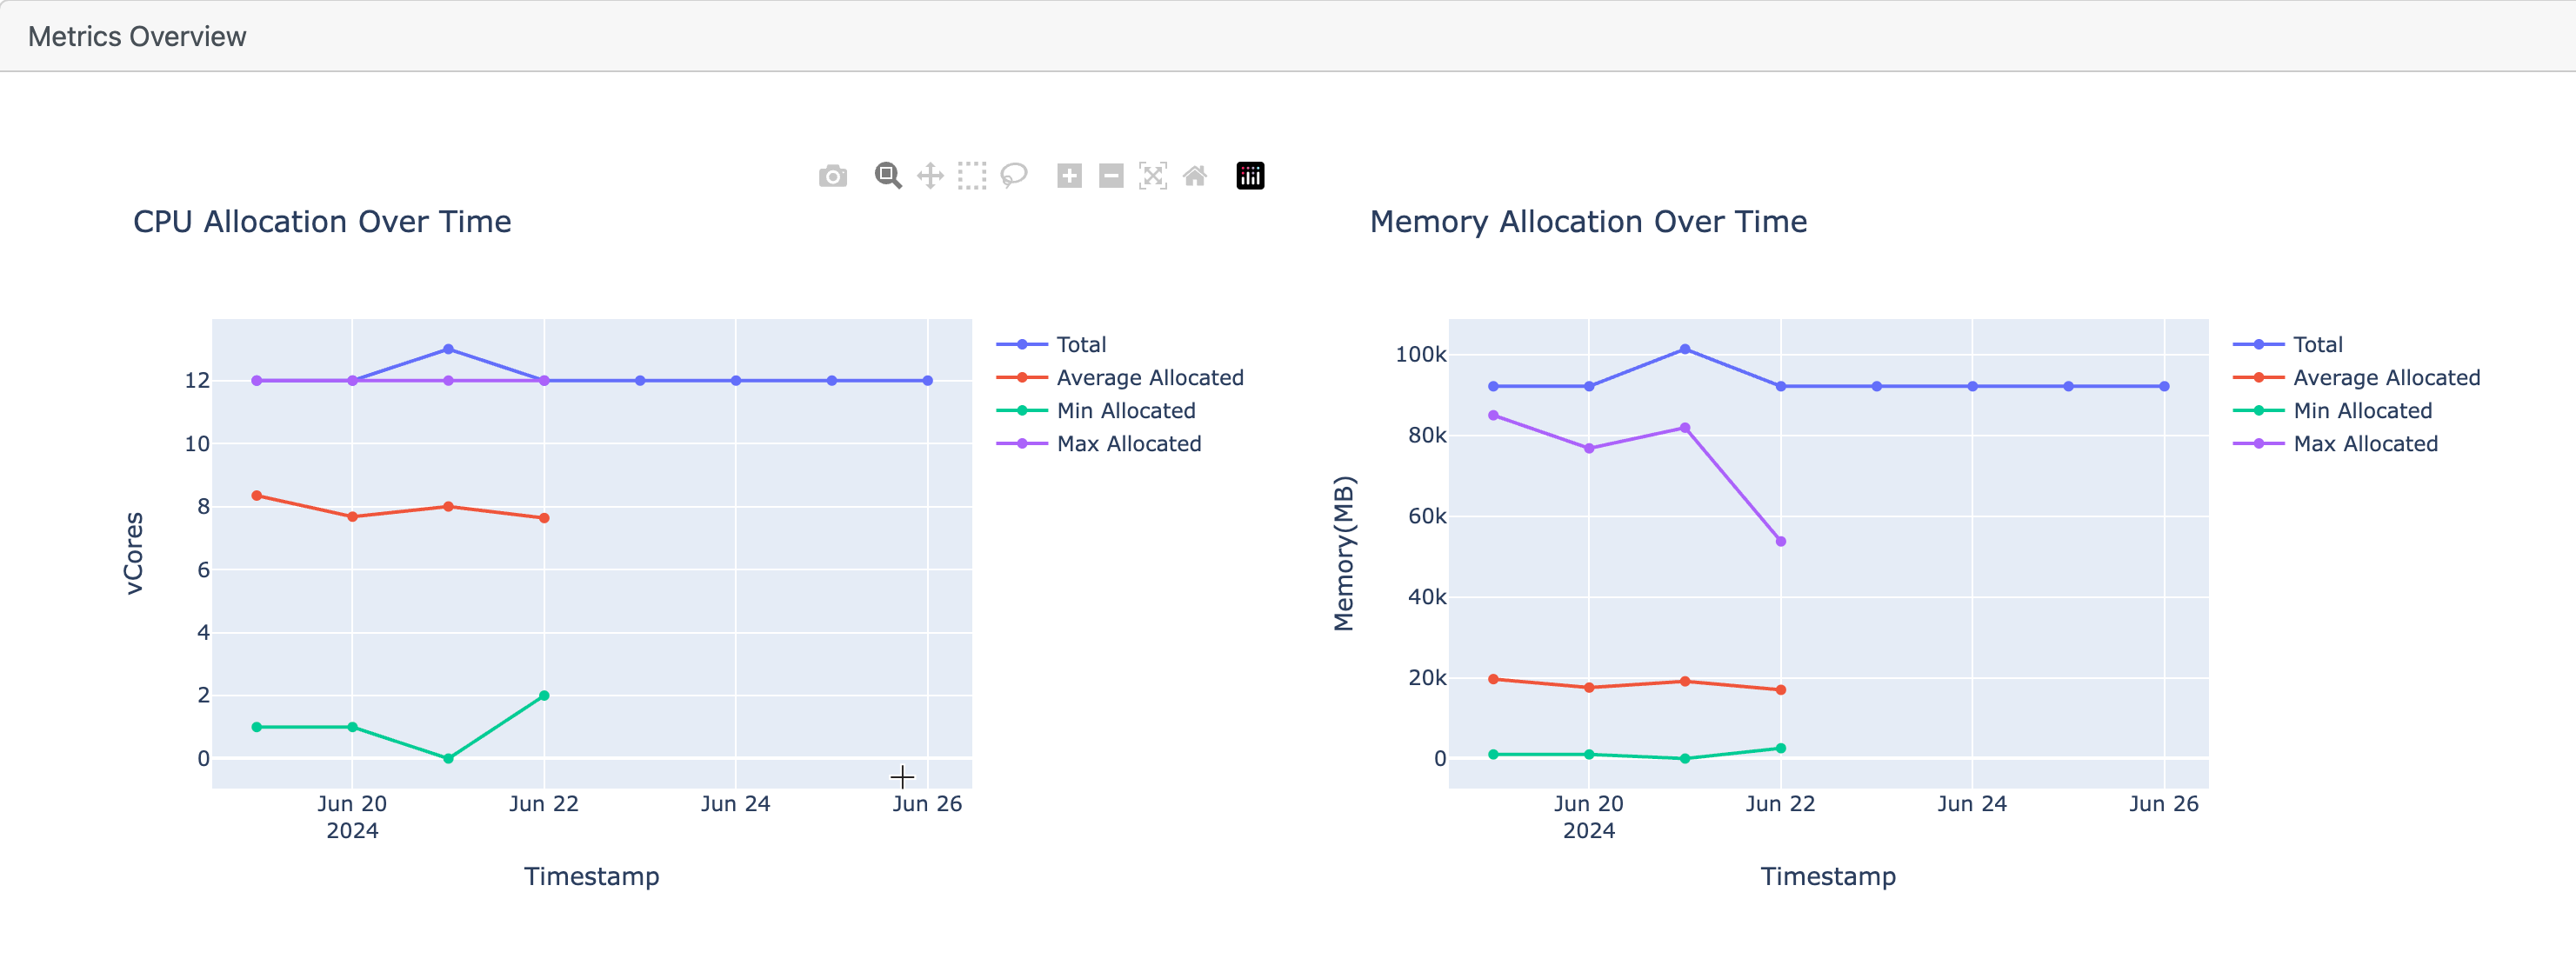
Metrics Overview
This section shows resource allocation trends:
CPU Allocation Over Time: Trend of CPU allocation.
Memory Allocation Over Time: Trend of memory allocation.
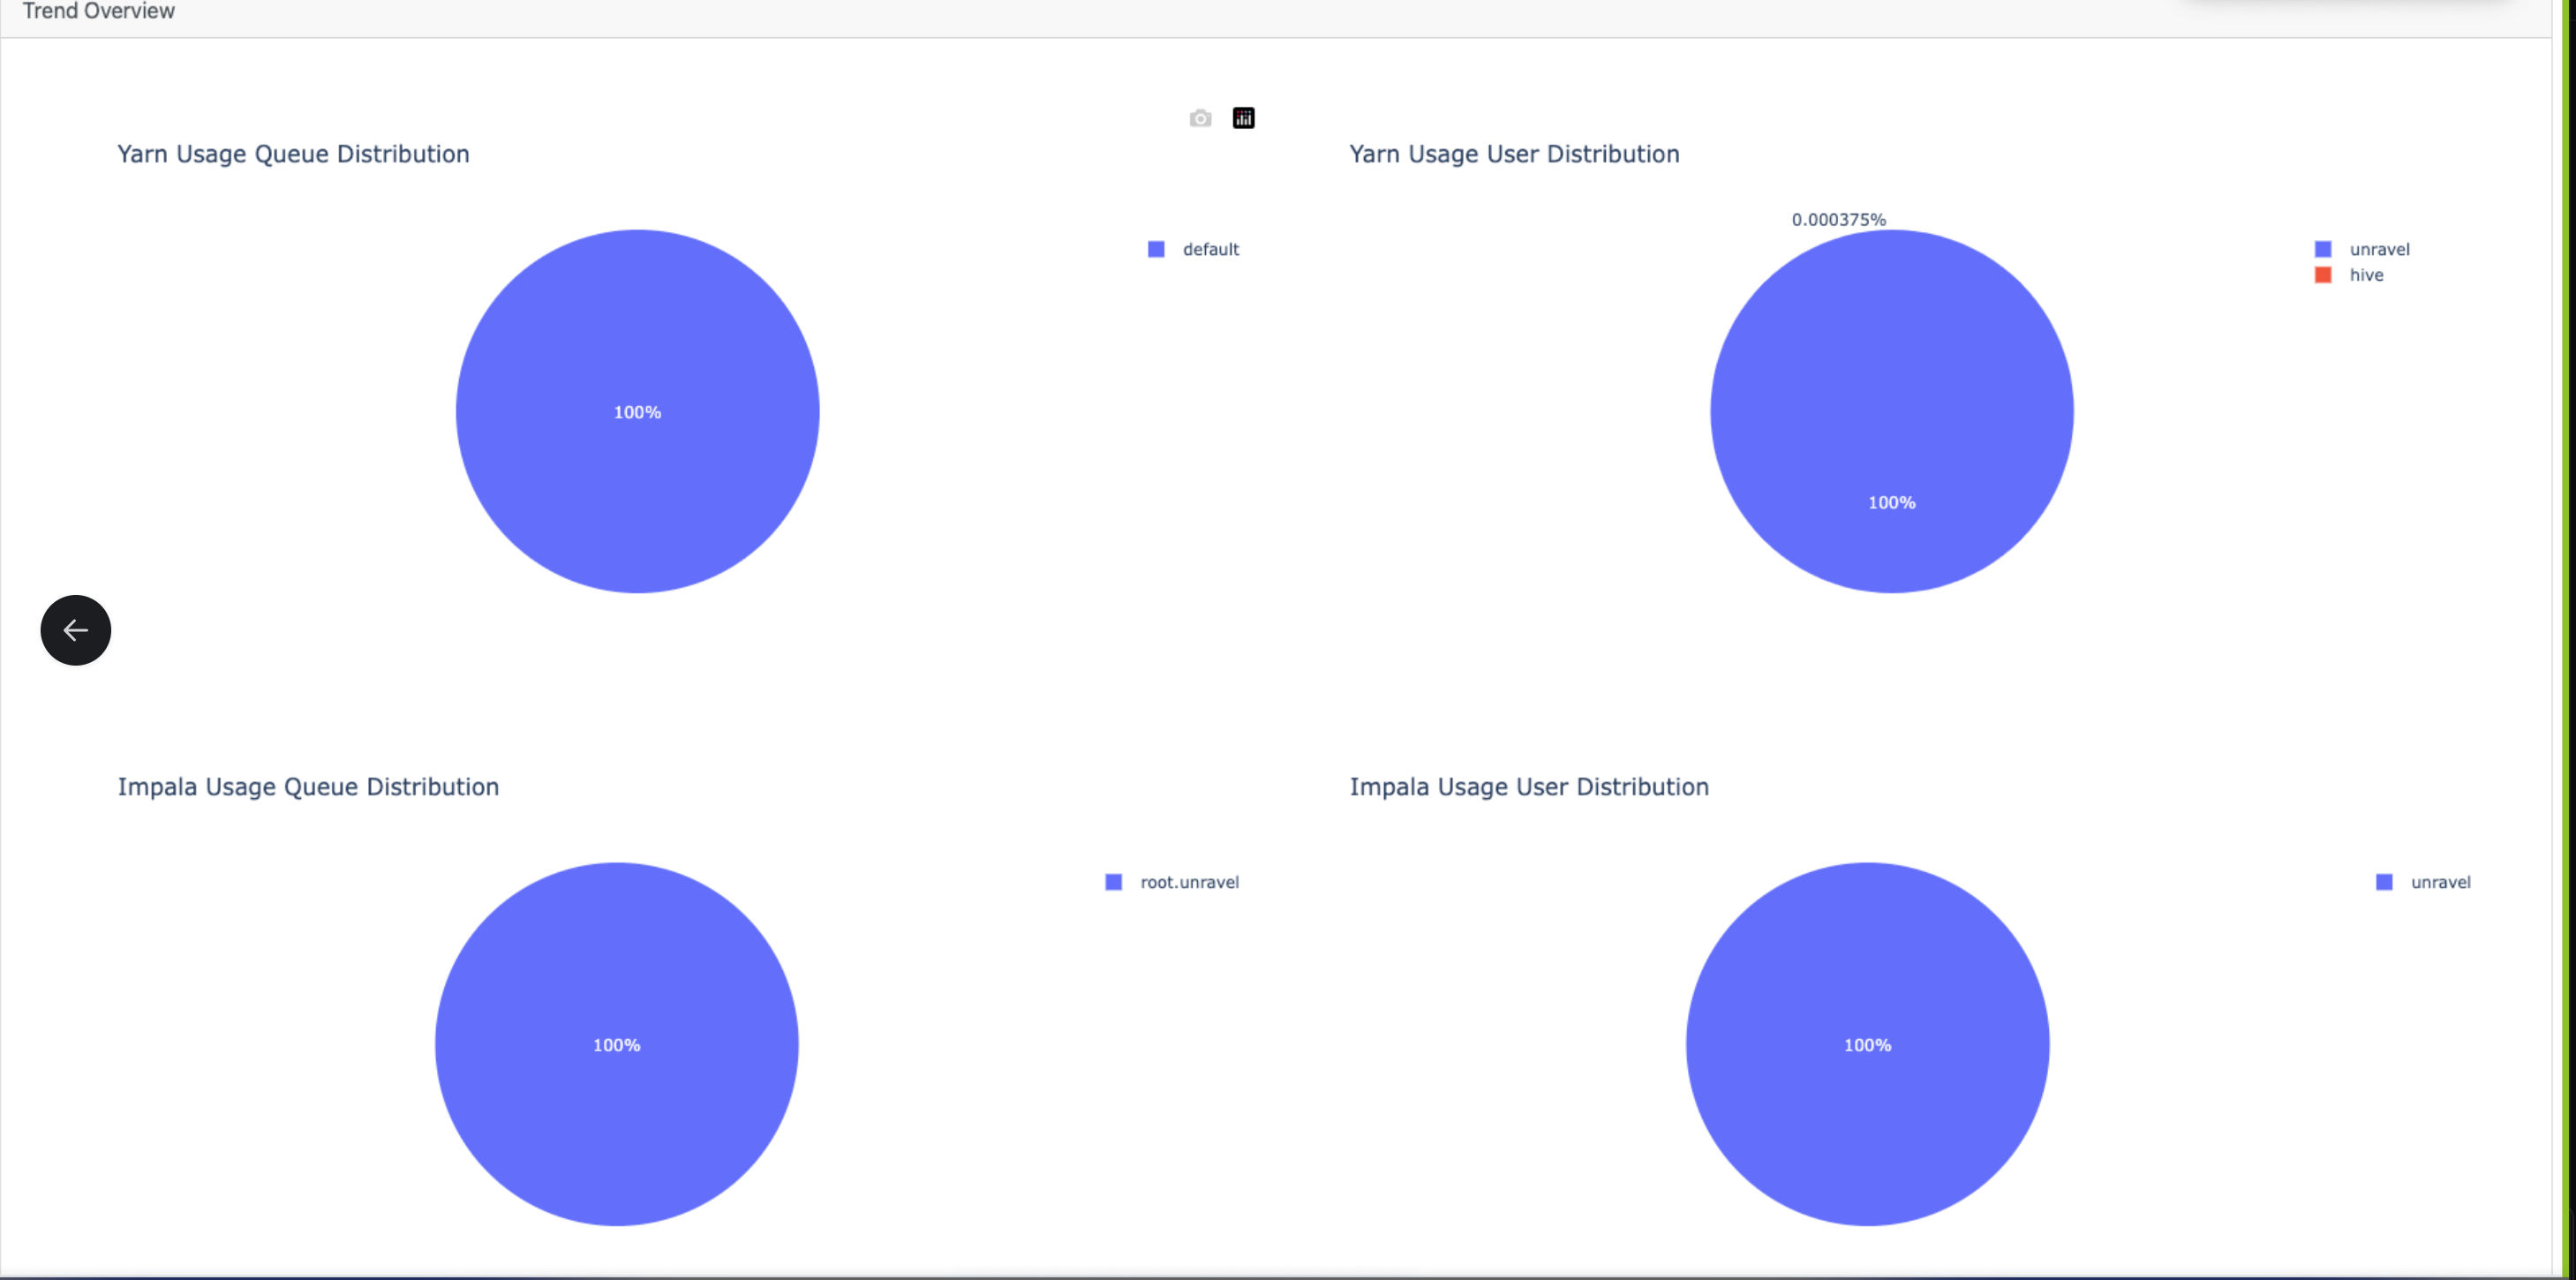
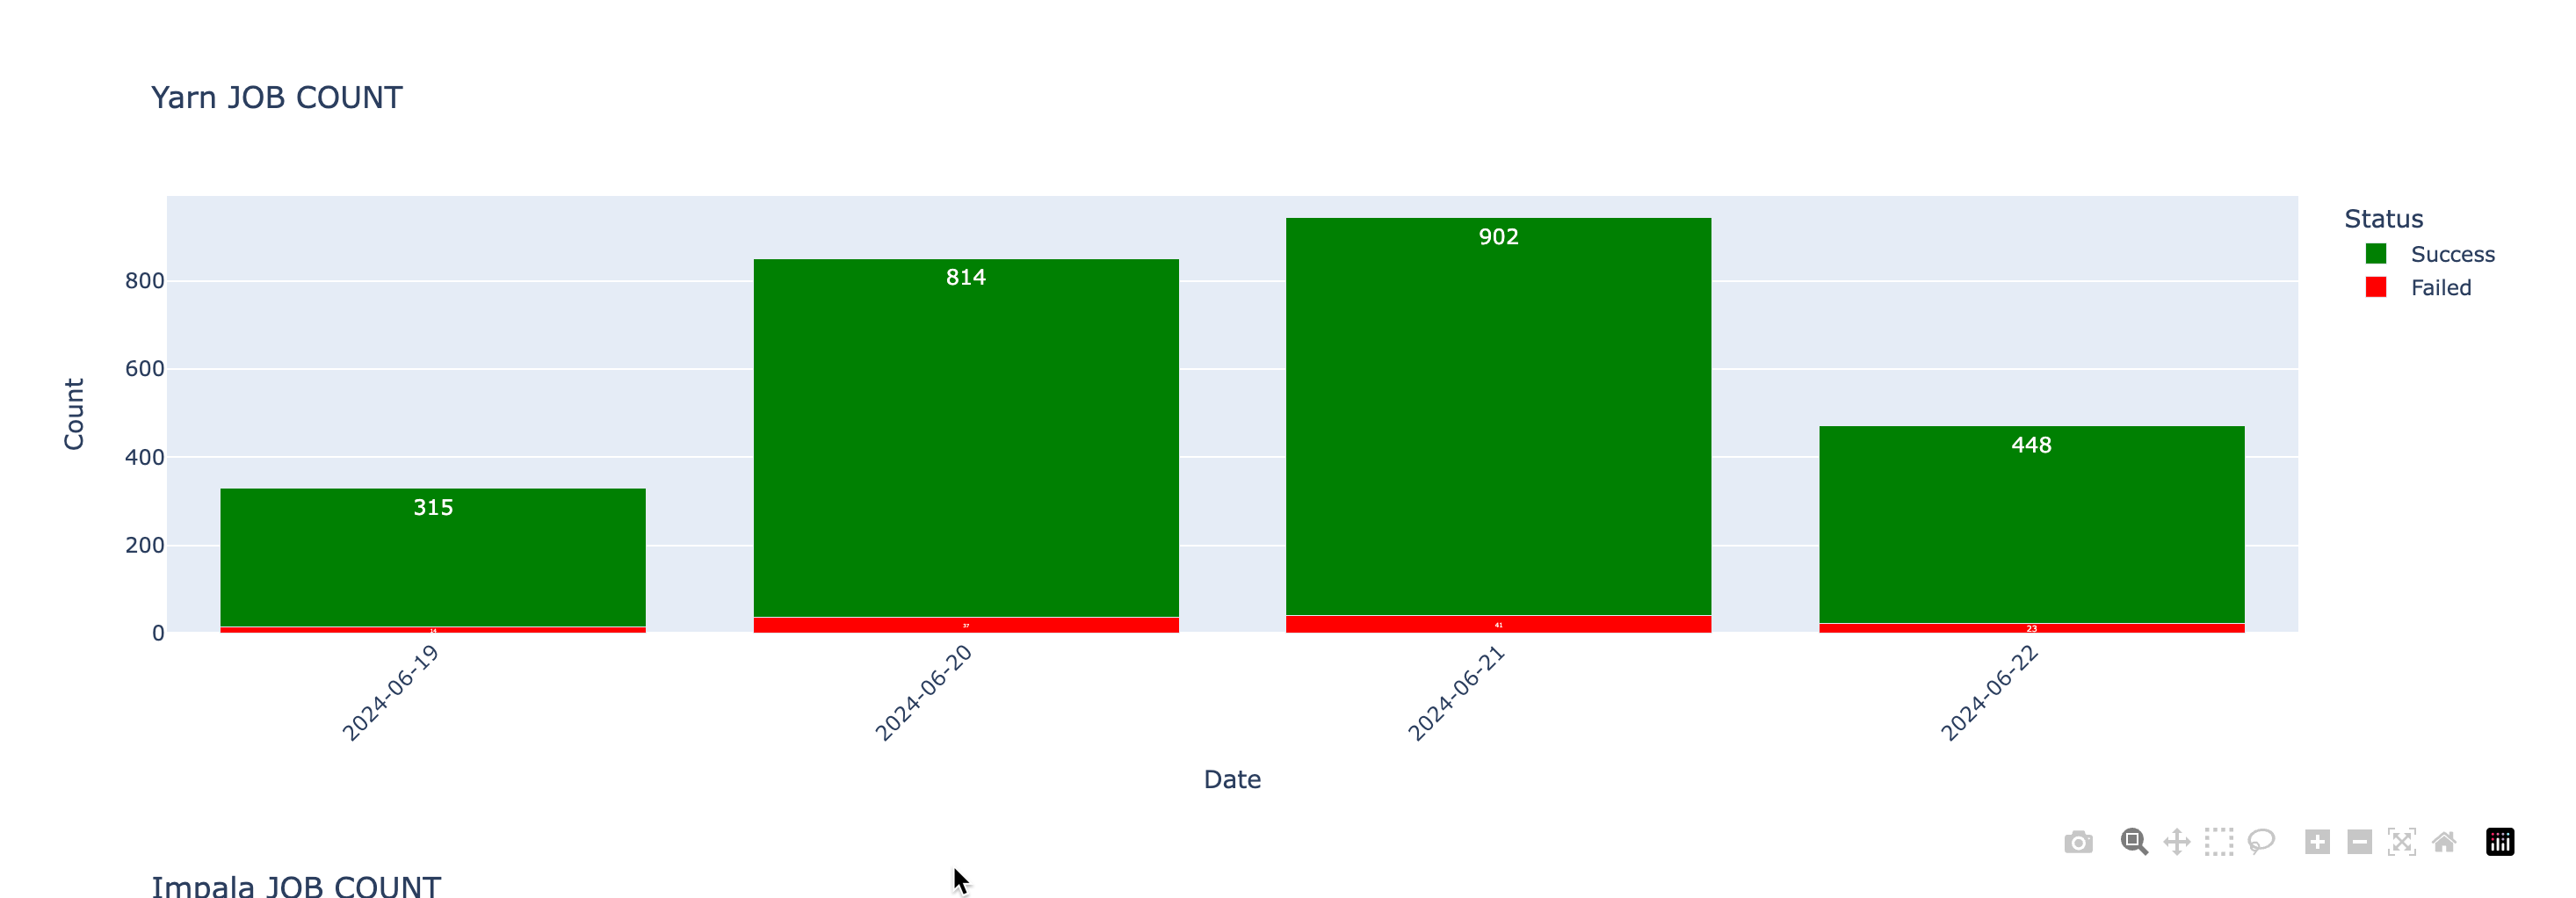
Trend Overview
This section provides various usage trends:
Yarn Usage Queue Distribution (Pie Chart): Distribution of Yarn usage across queues.
Yarn User Distribution (Pie Chart): Distribution of Yarn usage across users.
Impala Usage Queue Distribution Trend: Trend of Impala usage across queues.
Impala Usage User Distribution Trend: Trend of Impala usage across users.
Yarn Job Count: Number of Yarn jobs.
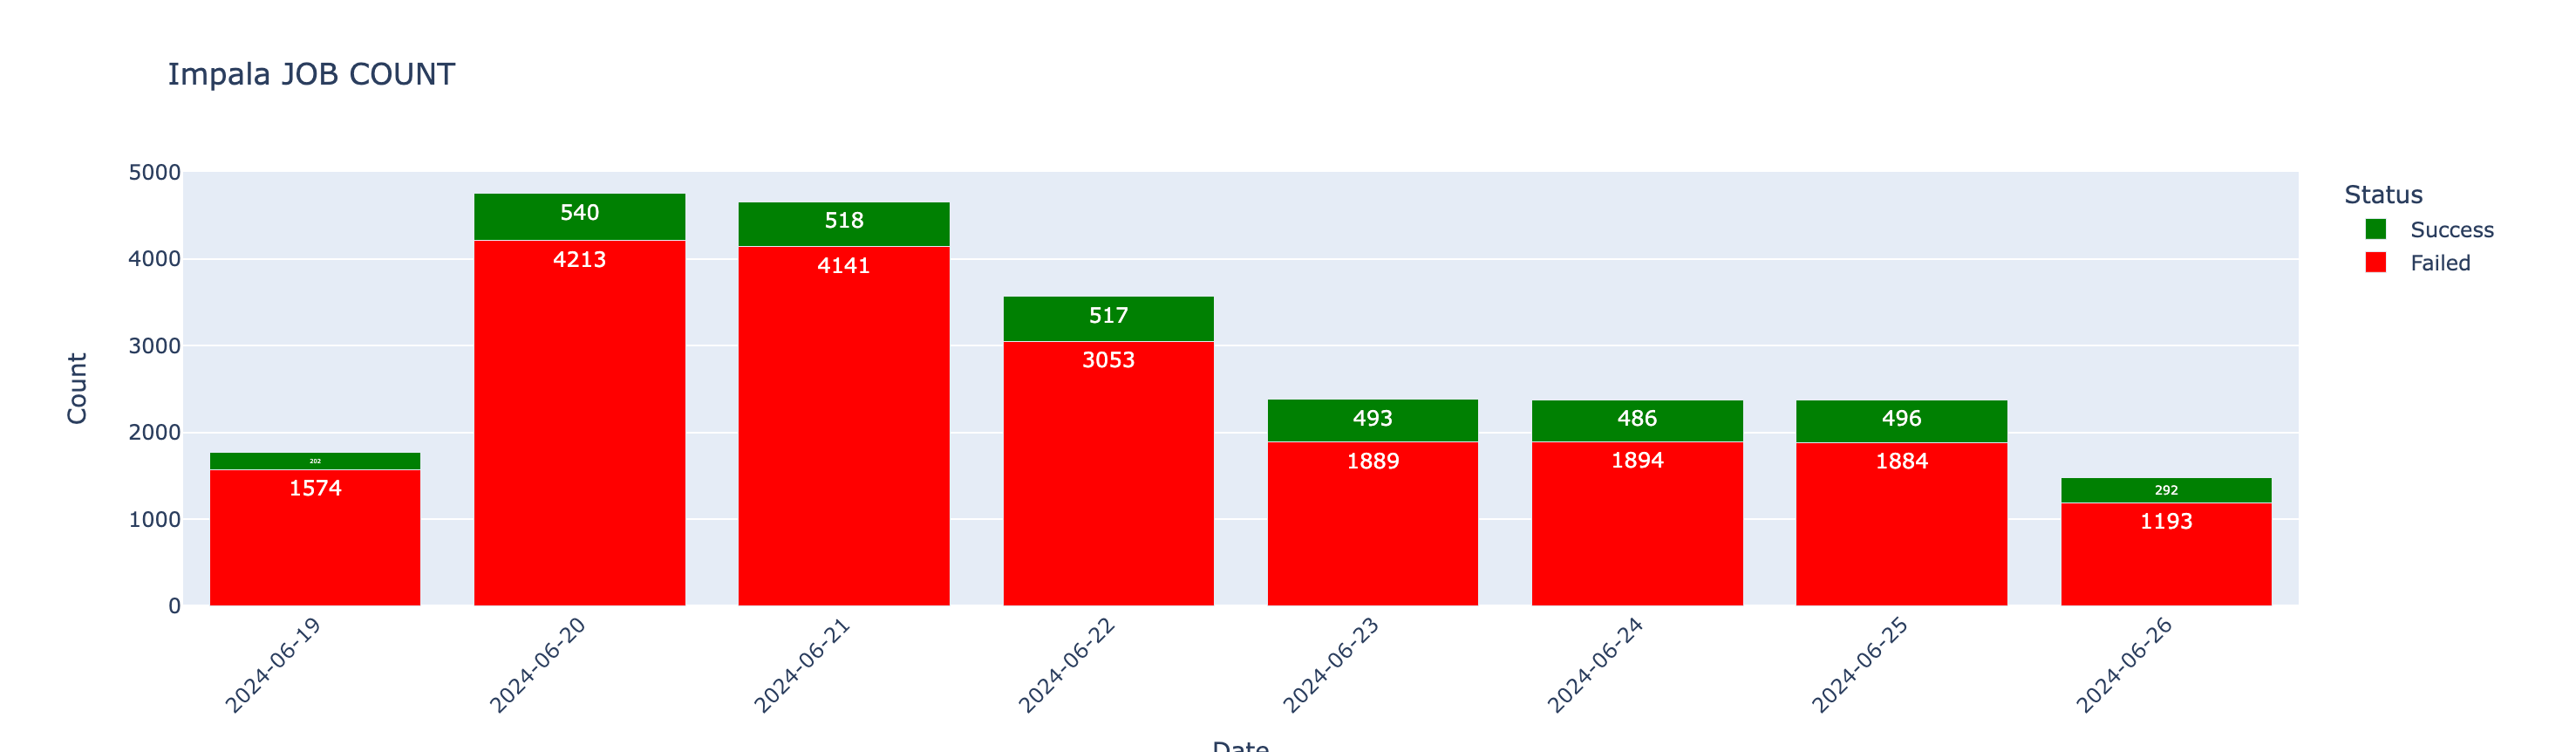
Impala Job Count: Number of Impala jobs.
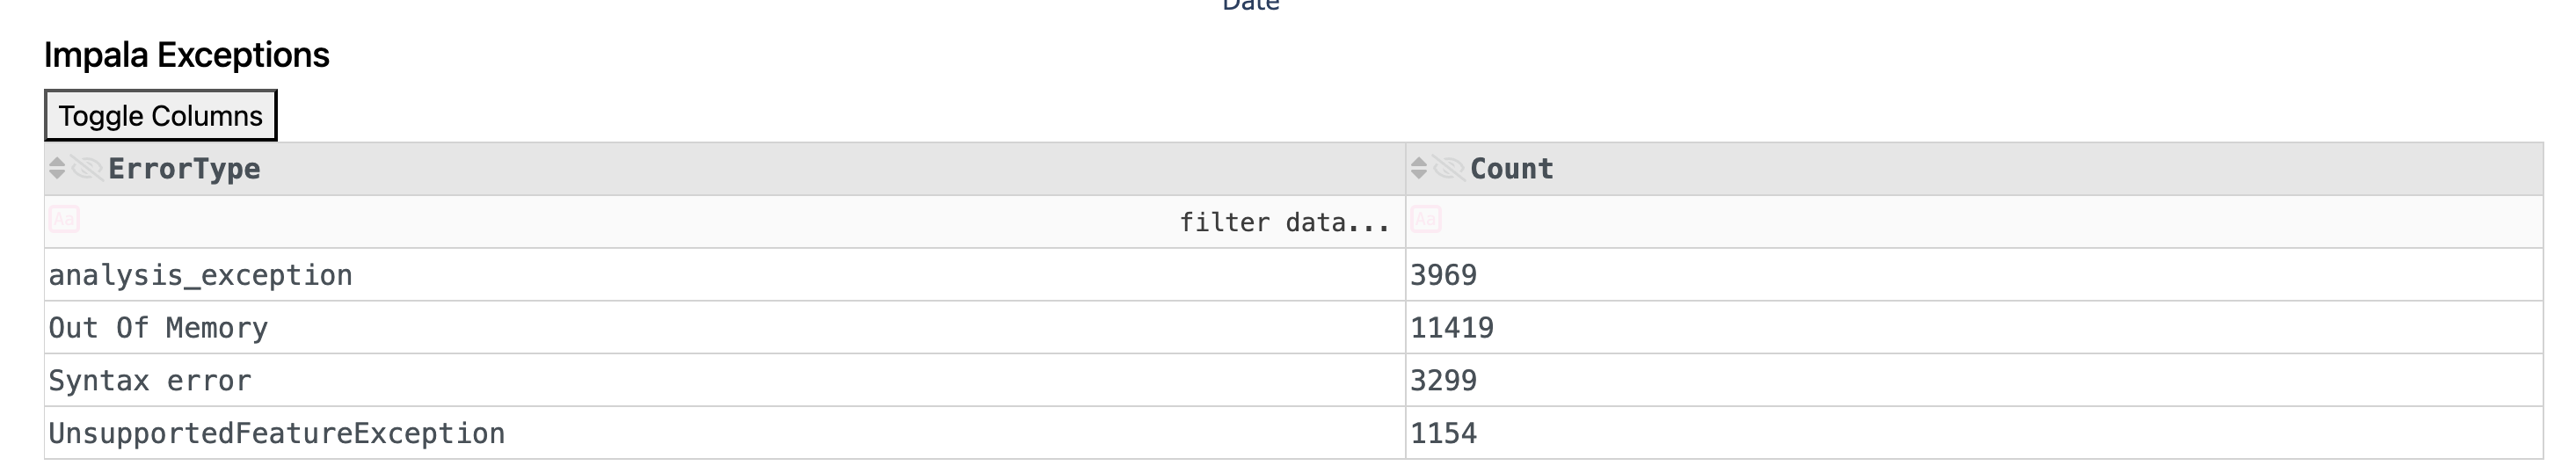
Impala Exceptions
This section tracks exception trends:
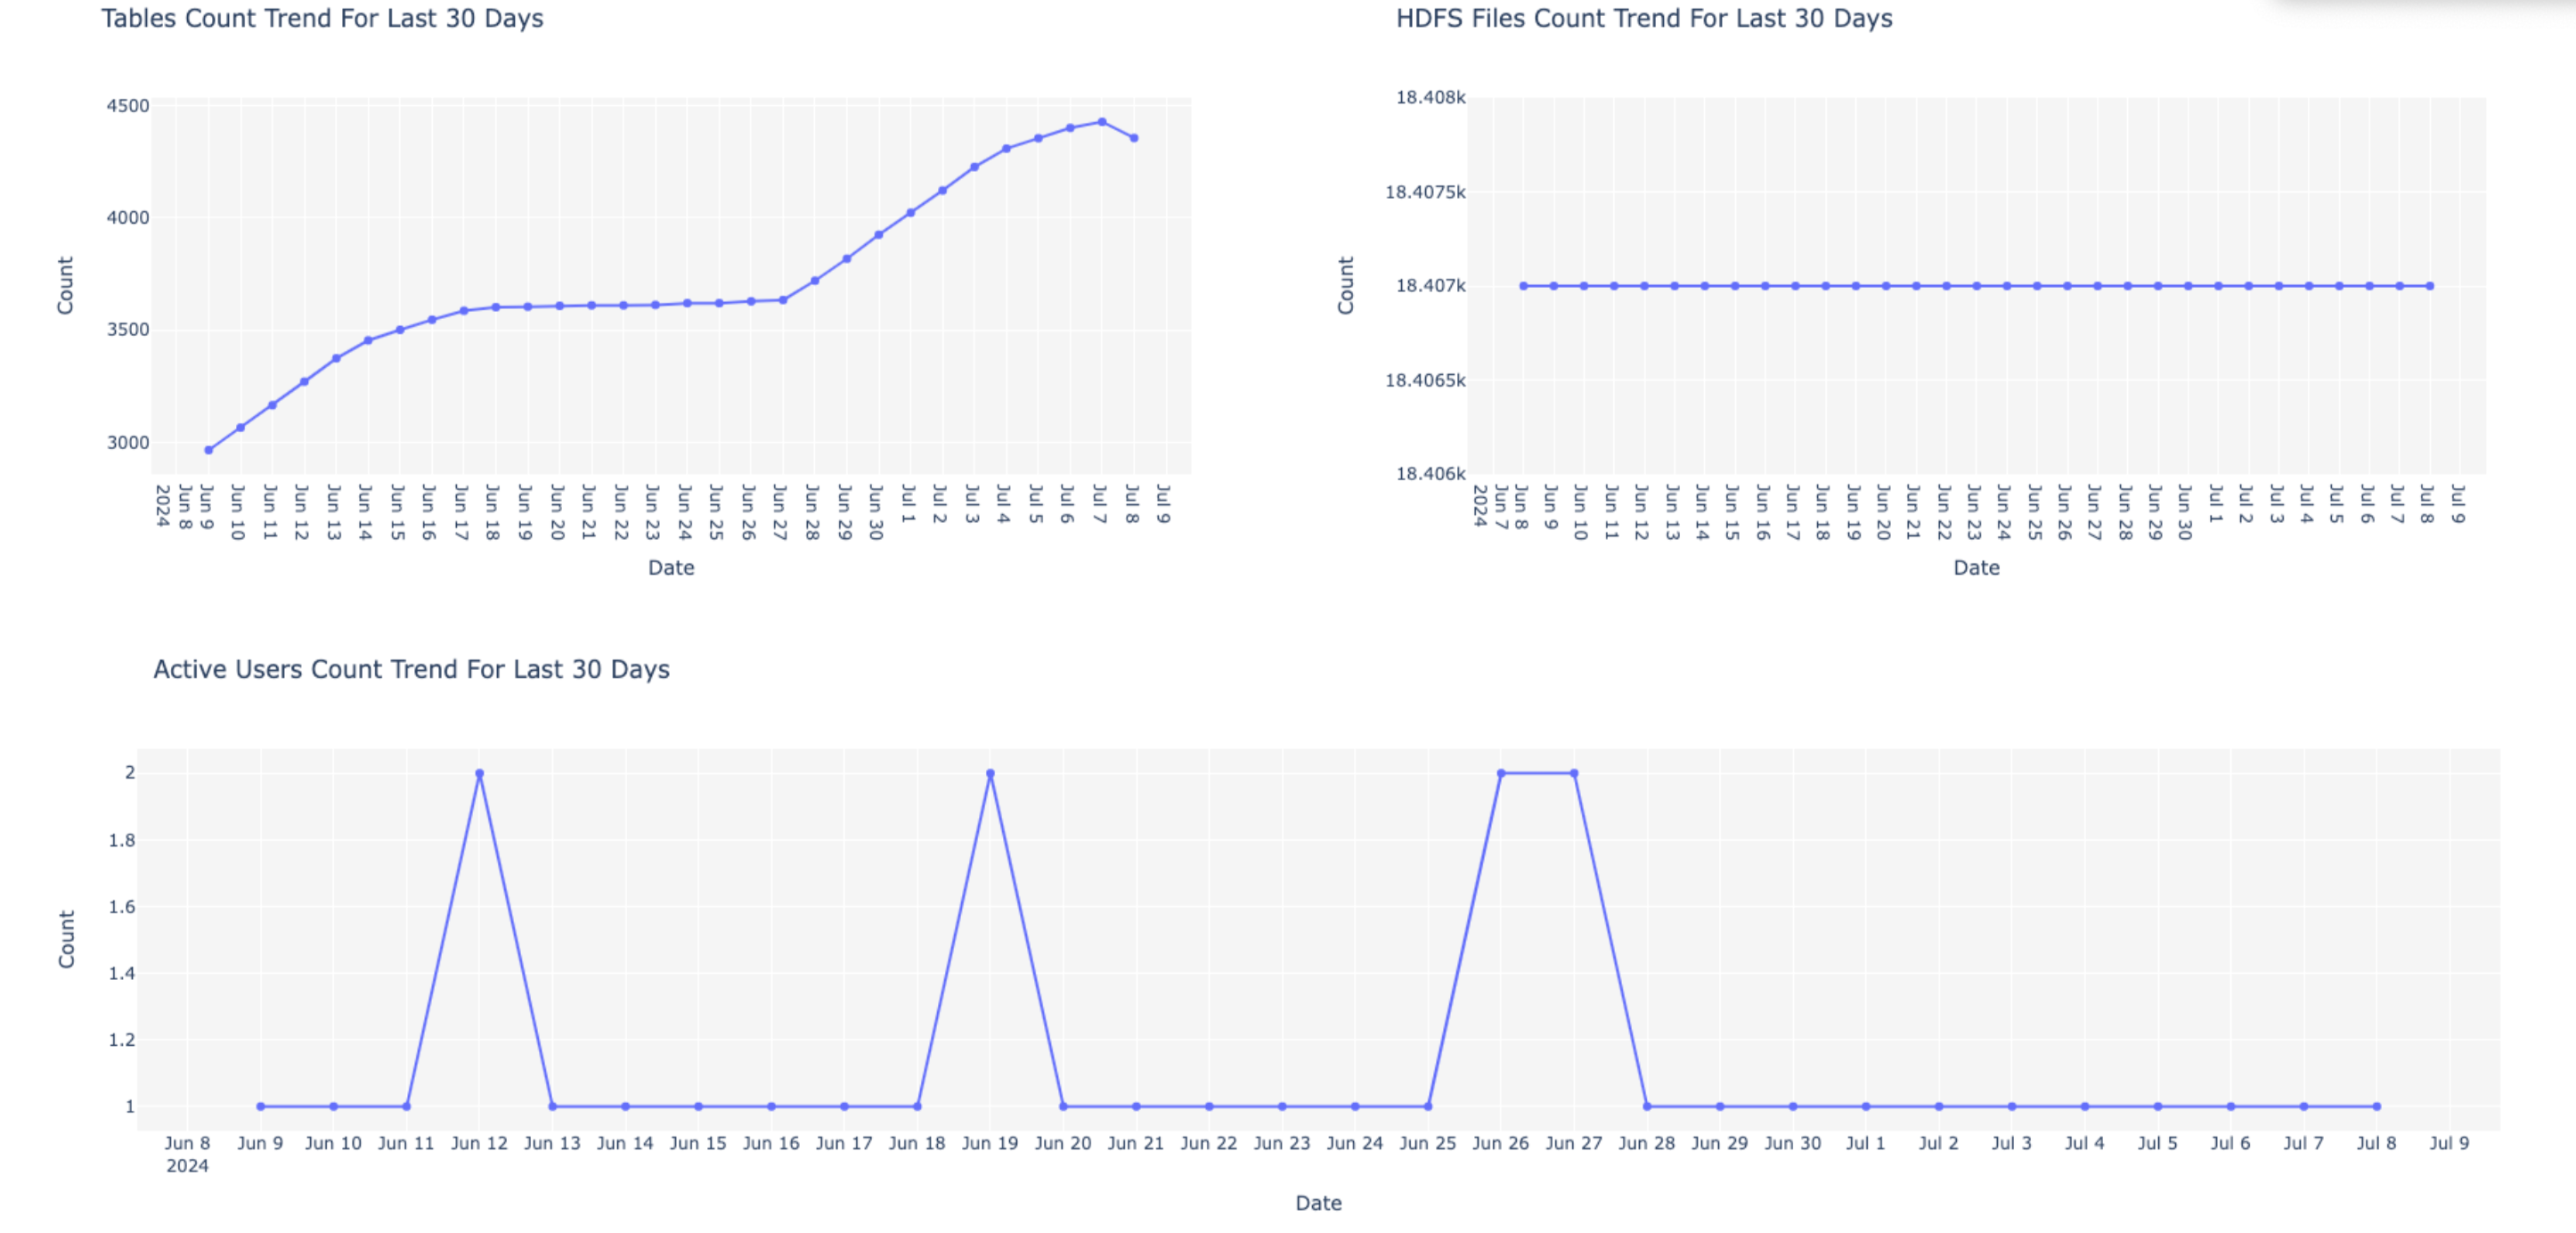
Tables Count Trends (Last 30 Days): Trend of table counts.
HDFS Files Count Trend (Last 30 Days): Trend of HDFS files count.
Active Users Count Trend (Last 30 Days): Trend of active users count.
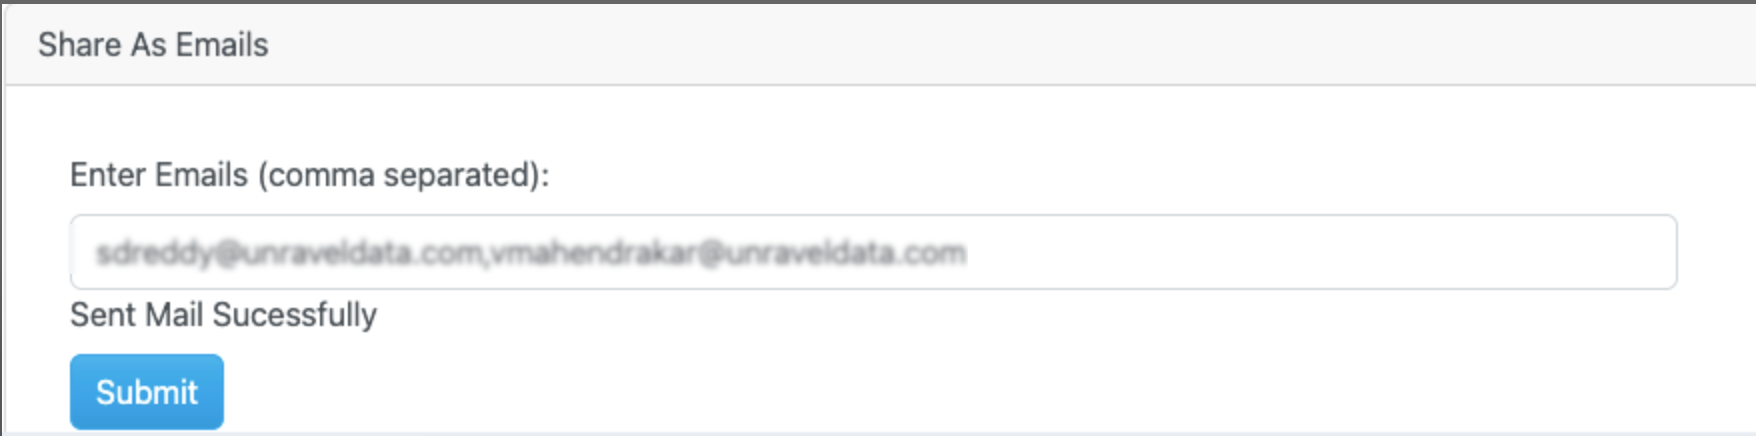
Share as Email
Enter your email address in the provided field.
Click Submit to receive the report in your email.
Note
To send Operational Dashboards via email, ensure that SMTP connections are enabled and configured in unravel.properties.