Monitor and Analyze Databricks Jobs with Unravel
Track, monitor, and analyze Databricks jobs—including Spark and SQL tasks—with Unravel. Access job status, run history, performance metrics, cluster usage, and cost analysis to optimize workflows and ensure efficient data pipeline execution in Databricks.
A Databricks job can contain single or multiple tasks (a workflow of tasks) with complex dependencies. Tasks include Notebook job, Spark-submit job, Spark SQL job, and so on. Each task can run on a different cluster.
The Workflows > Jobs tab lists all the job workflows.
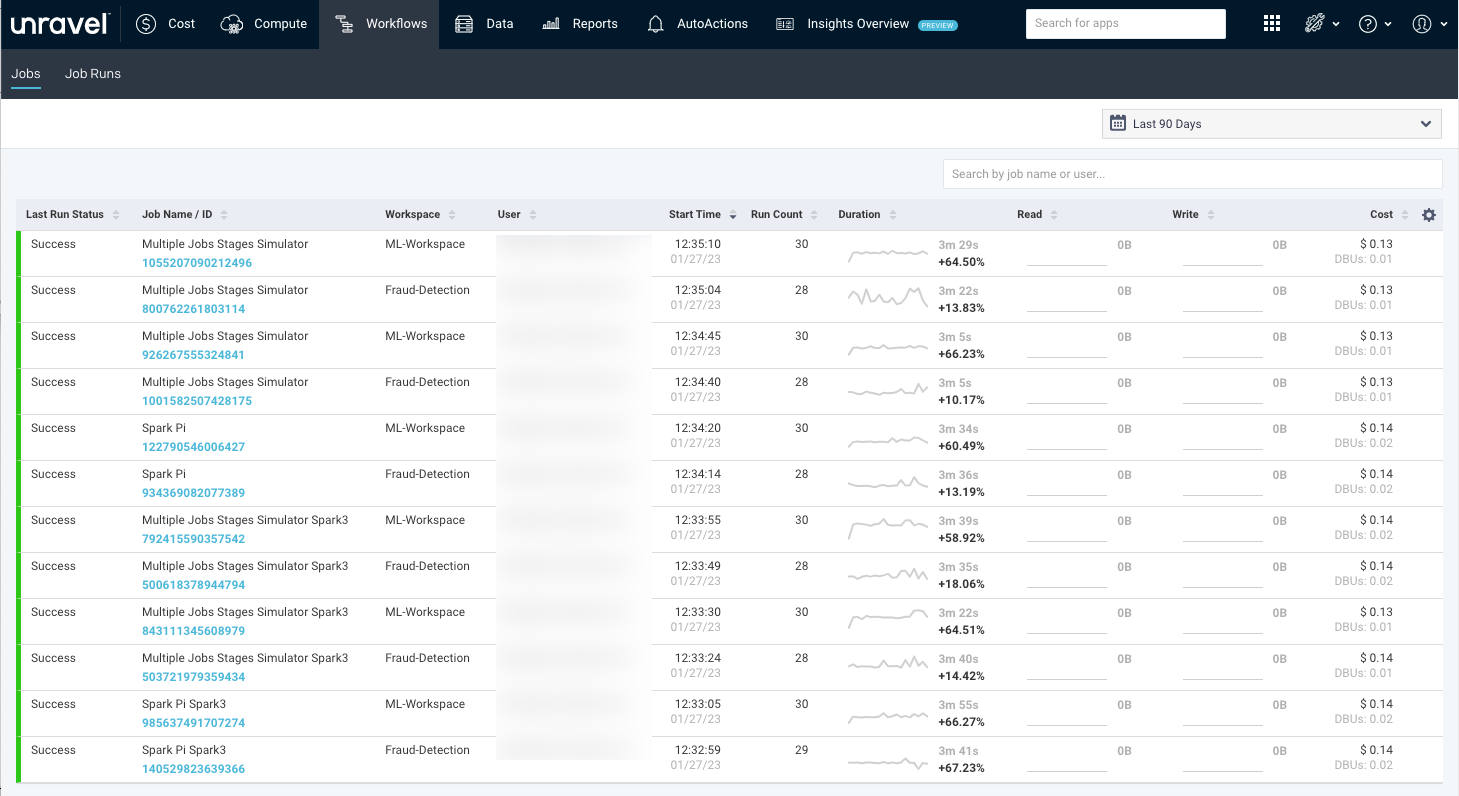
The Job workflow list provides the following details:
Columns | Description |
|---|---|
Last Run Status | Status of the last run job. |
Job Name/ID | Name and unique ID of the job. After you click the Job Name/ID link, the selected job name is filtered on the Job Runs page. You can view the runs for the selected job. For information, see Job Runs. |
Workspace | Name of the workspace where the job is run. |
User | Name of the user who submitted the job. |
Start Time | Start time and day of the job. |
Run Count | The count of jobs runs. |
Duration | Total time taken by the app to complete the job.
|
Read | Total data read by the app.
|
Write | Total data written by the app.
|
Cost | An estimated cost incurred in running the app. This cost is calculated based on VM and DBU prices. |