Reports

Manages your reports. You can view and generate reports directly from these tabs.
Archives: All reports and attempts to generate a report, whether the reports were scheduled or run on an ad hoc basis.
Schedules: Lists all scheduled reports.
The following reports can be viewed and generated:
Archives
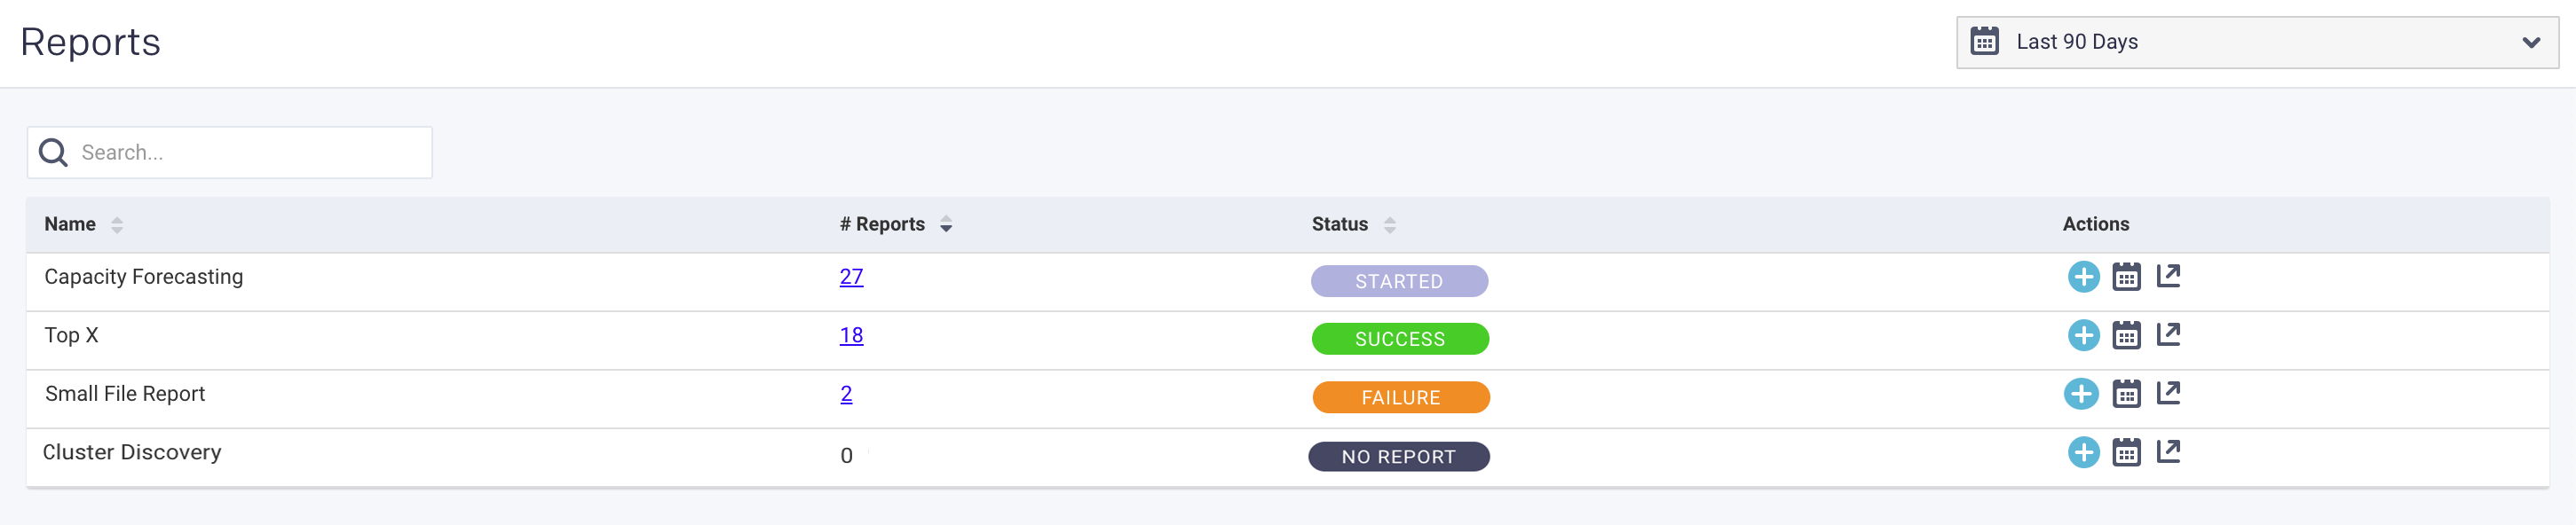
The archives list all the available reports by report type Name. You can search by report type, for example, File Reports. It is initially sorted in descending order on the # Reports. The Status column notes the status of the last or current support. The image below shows a status of Started for the latest Capacity Forecasting; this could be a scheduled or ad hoc report. Under Actions click  to create a report,
  to schedule a report and
  to view the latest report.
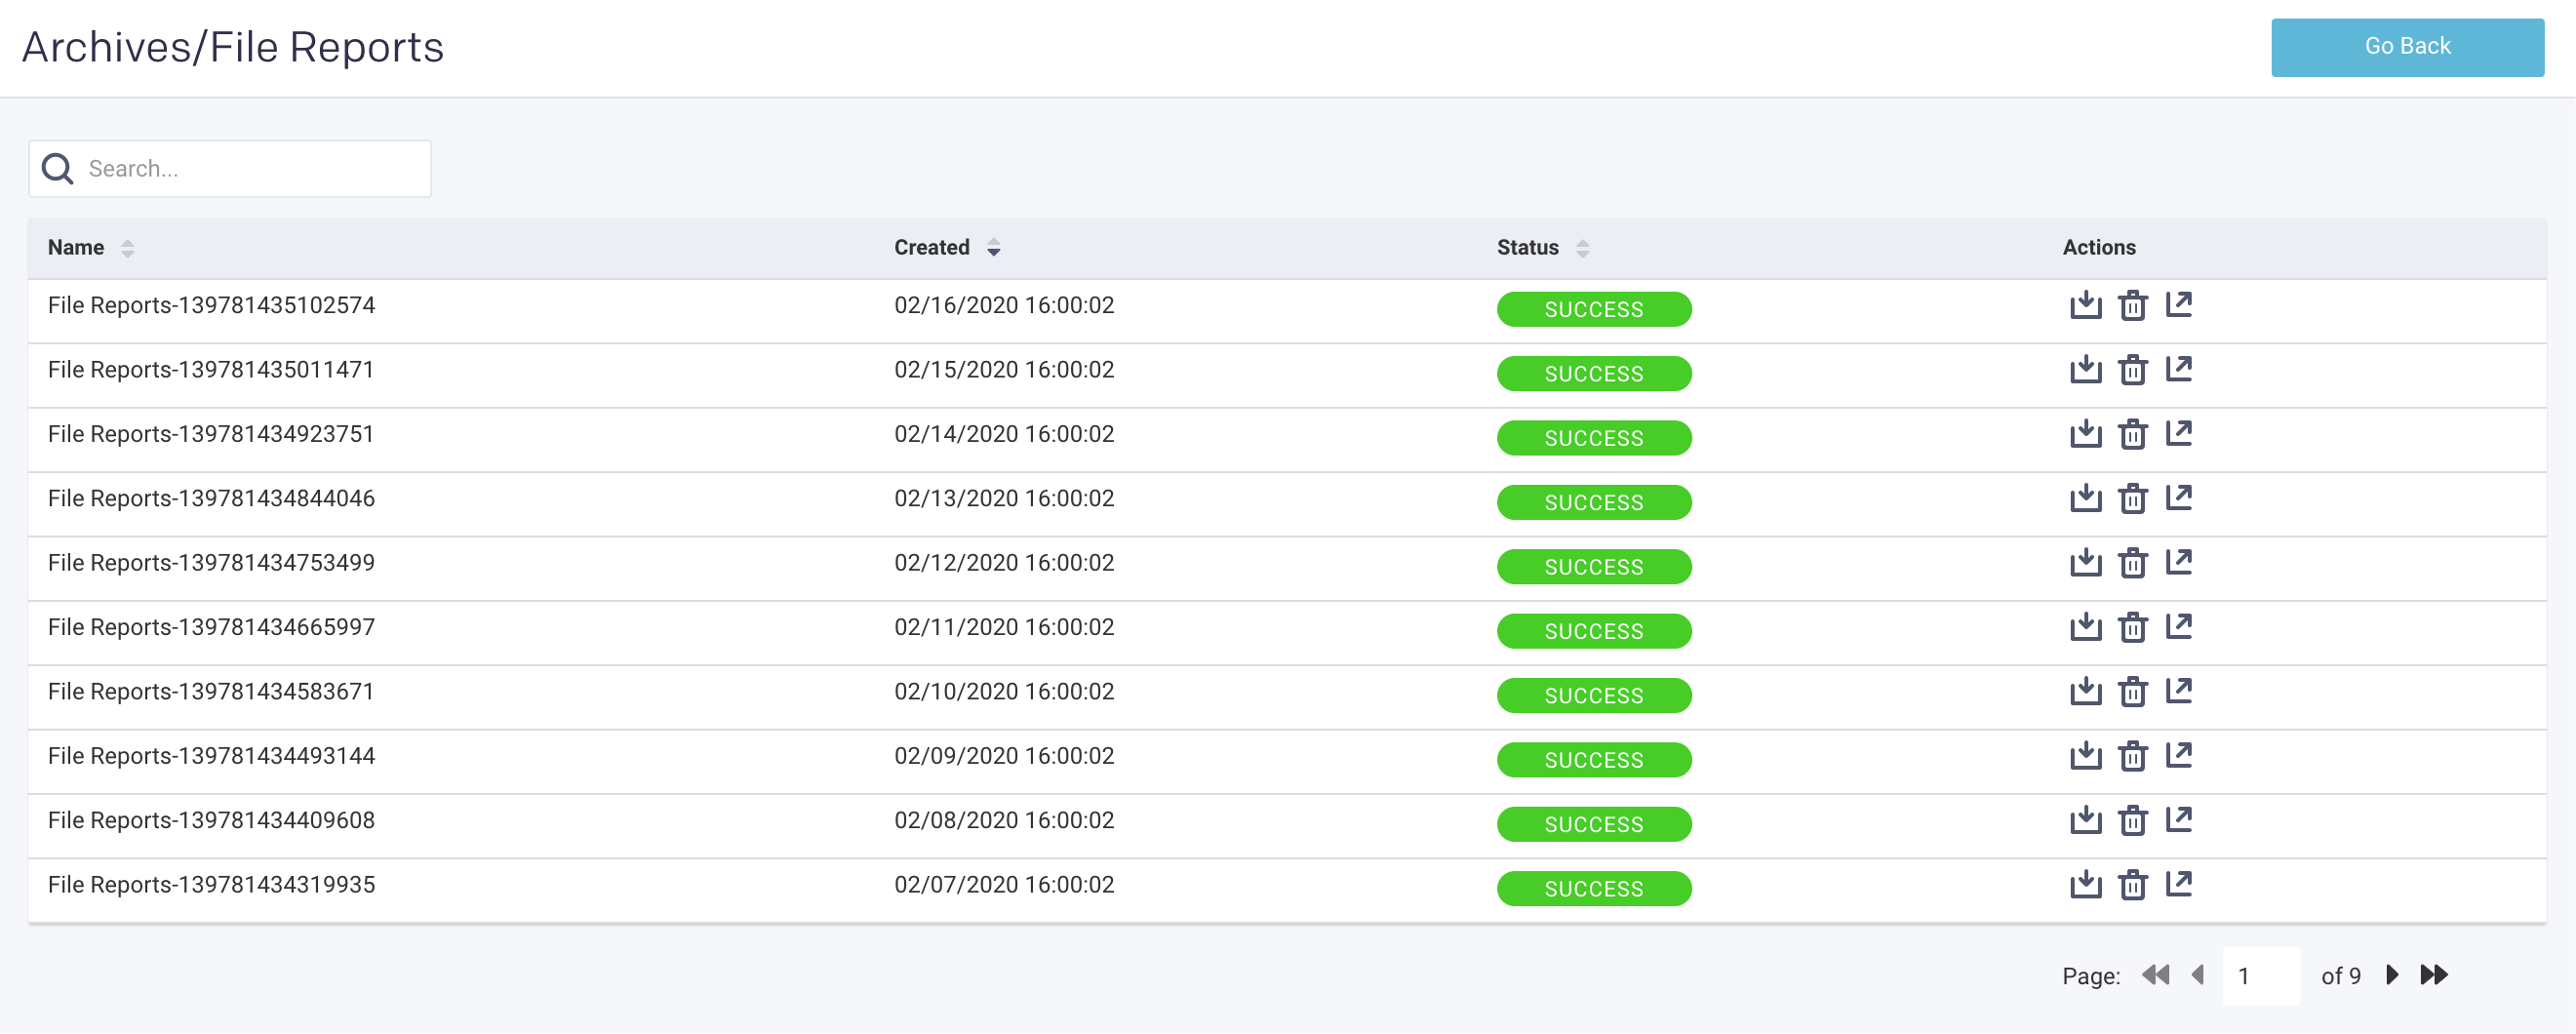
To see the list of archive reports, click the number in the # Reports column. The report type is listed in the title bar, the example below is for File Reports. You can search by report name. For each report the Create time and Status is listed. Click  to download the report, click
  to delete the report and to view the latest report. Click Go Back to return to the main archive page.
Schedules
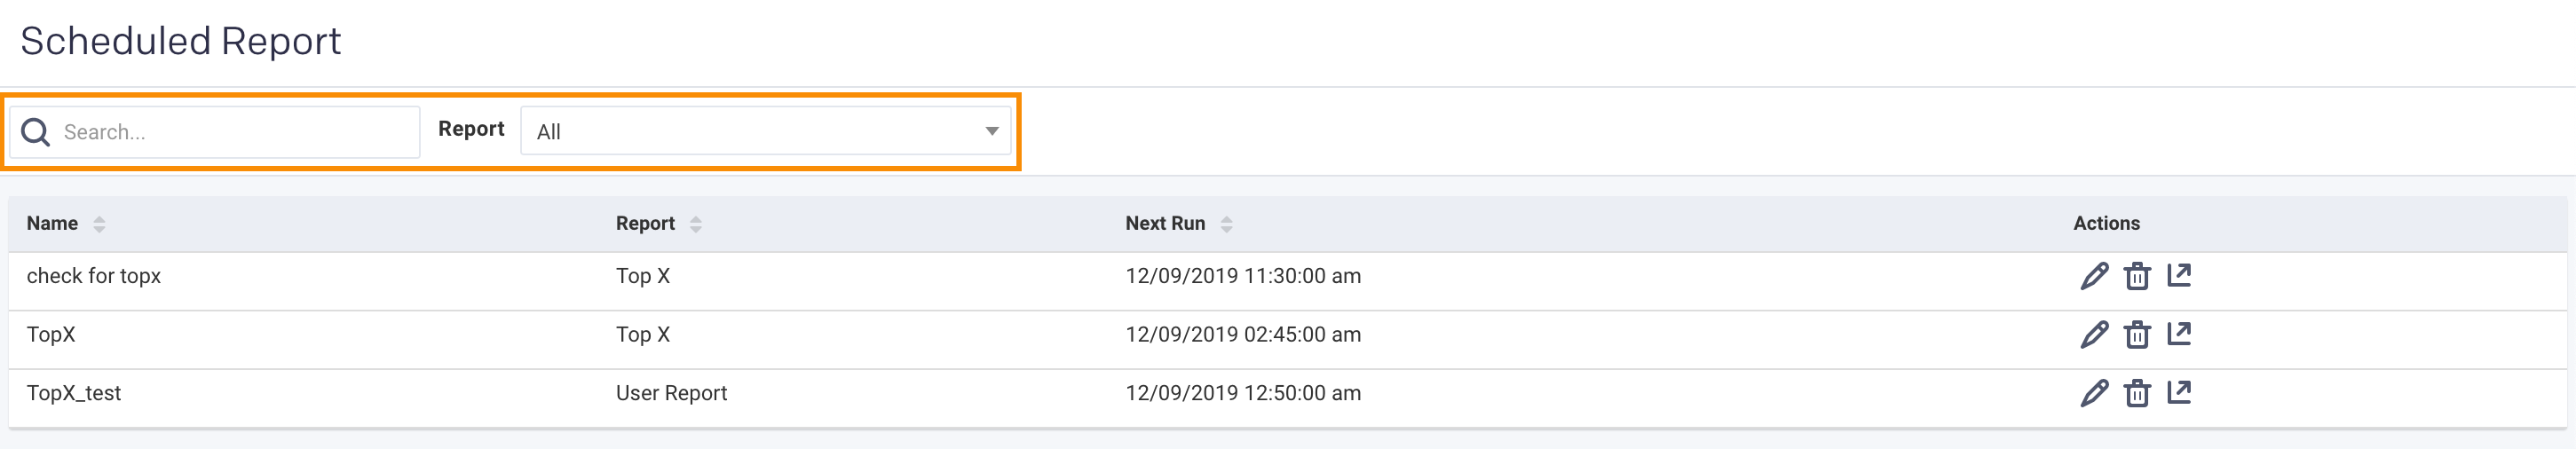
Lists all the reports currently scheduled. The window is initially sorted on Name. The Report column lists the type of report and Next Run the date and time of the next reports scheduled run. You can't create a new report in this window, but you can edit the existing report by clicking  under Actions. See the specific report type page for an explanation of the edit modal. Click to delete the report and to view it.
You can filter the report by report name (or substring) or report type.
Queue Analysis
From this tab, you can generate a report of active queues for a specified cluster. The report analyzes queue activity by jobs and vCores, memory. As with all reports, it can be generated instantly or can be scheduled. The tab opens displaying the last successfully generated report if any. Reports are archived and can be accessed via the Reports Archive tab.
Configuring the Queue Analysis report
To enable and configure the Queue Analysis report, You must set the Queue Analysis report properties as follows:
Stop Unravel
<Unravel installation directory>/unravel/manager stop
Set the Queue Analysis report properties as follows:
<Installation directory>/manager config properties set
<KEY><VALUES>##For example: <Unravel installation directory>/manager config properties set com.unraveldata.report.queue.http.retries 2 <Unravel installation directory>/manager config properties set com.unraveldata.report.queue.http.timeout.msec 15000Refer to Queue Analysis properties for the complete list of properties.
Apply the changes.
<Unravel installation directory>/unravel/manager config apply
Start Unravel
<Unravel installation directory>/unravel/manager start
Generating Queue Analysis report
Click Reports > Archived. Click the
icon corresponding to Queue Analysis. In the New Report dialog box, enter the following parameters:
Date Range: Select a period from the date picker.
Cluster: In a multi-cluster setup, you can select the cluster from where you want to generate the report.
Click
 to generate the report.
The progress of the report generation is shown on the top of the page and you are notified about the successful creation of the report.
All reports (successful or failed attempts) are in the Reports Archive.
Scheduling Queue Analysis report
Click Reports > Archived. Click the
icon corresponding to Queue Analysis. In the Schedule Report dialog box provide the following details:
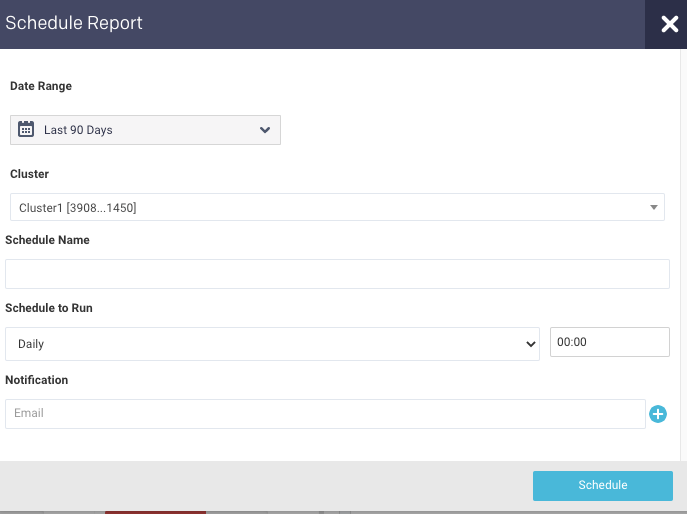
Date Range: Select a period from the date picker.
Cluster: In a multi-cluster setup, you can select the cluster from where you want to generate the report.
Schedule Name: Name of the schedule.
Schedule to Run: Select any of the following schedule options from the drop-down and set the time from the hours and minutes drop-down:
Daily
(Sun, Mon, Tue, Wed, Thu, Fri, Sat)
Every two weeks
Every month
Notification: Provide either a single or multiple email IDs to receive the notification of the reports generated.
Click
 .
.
Queue Analysis report
In the Reports > Archived, click the icon corresponding to Queue Analysis. The Queue Analysis report is displayed.
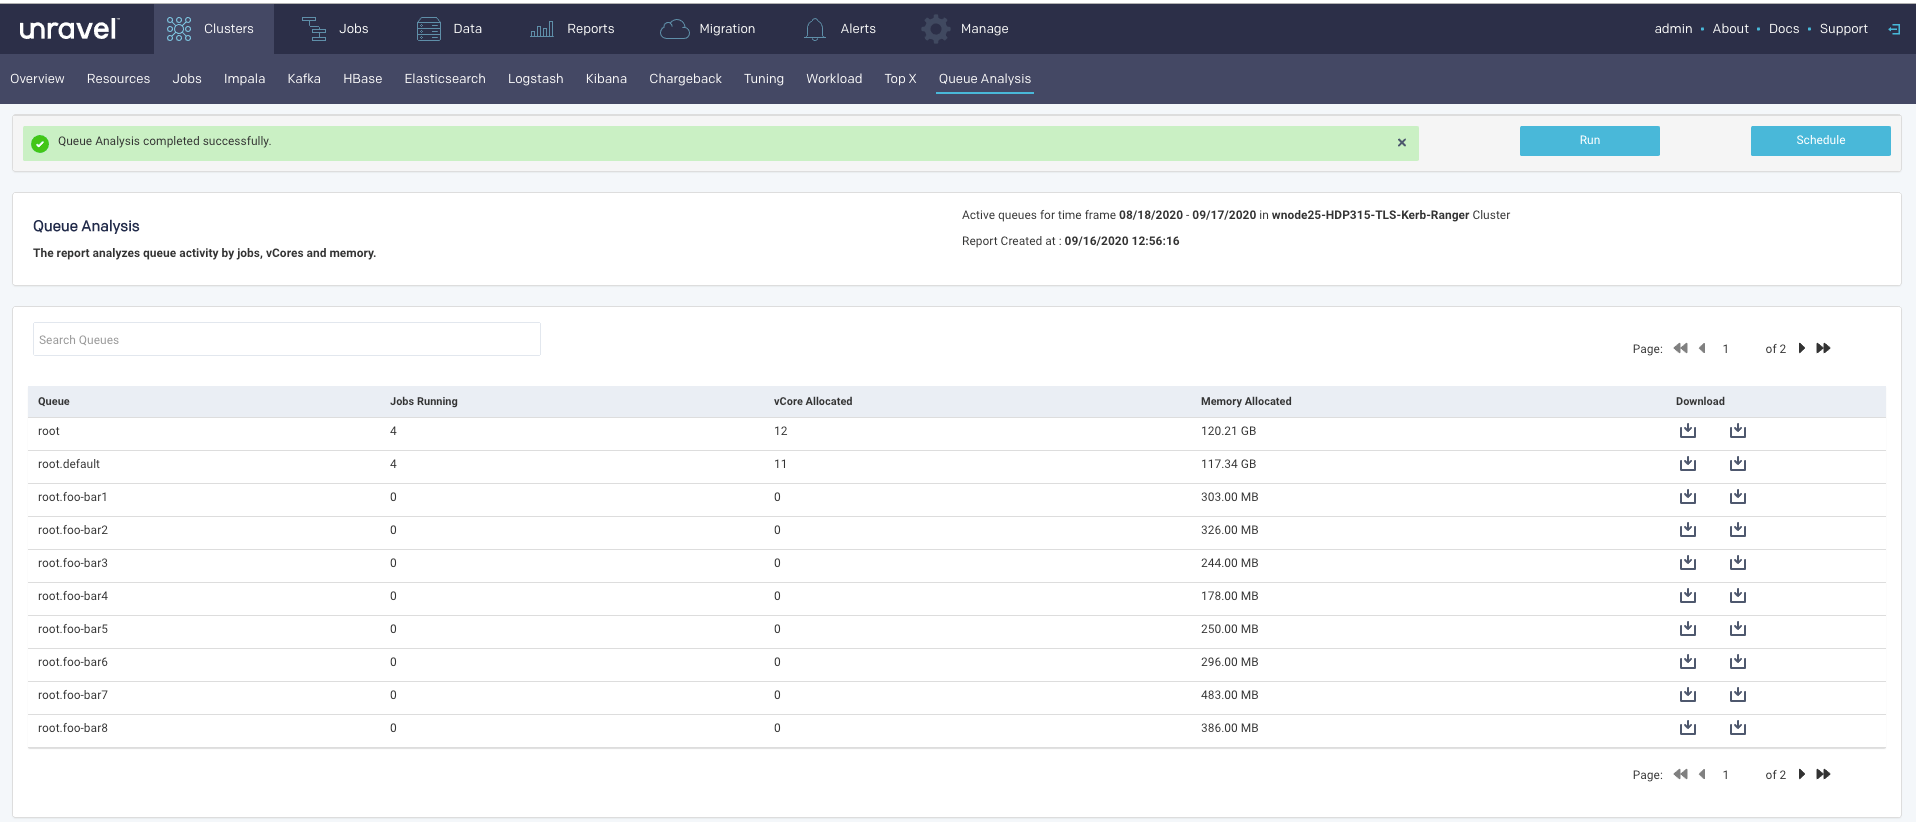
The active queues along with the following details are listed:
Column | Description |
|---|---|
Queue | Name of the queue. |
Jobs running | Number of jobs running in the queue. These are average values. |
vCore Allocated | Number of vCores allocated for the queue. These are average values. |
Memory Allocated | Memory allocated for the queue. These are average values. |
Click  to download the complete report of the selected queue in a CSV or JSON format.
Drilling down in a Queue Analysis report
Click a row in the active queue list, the details of the running jobs, vCores usage, and memory usage are displayed in the following graphs:
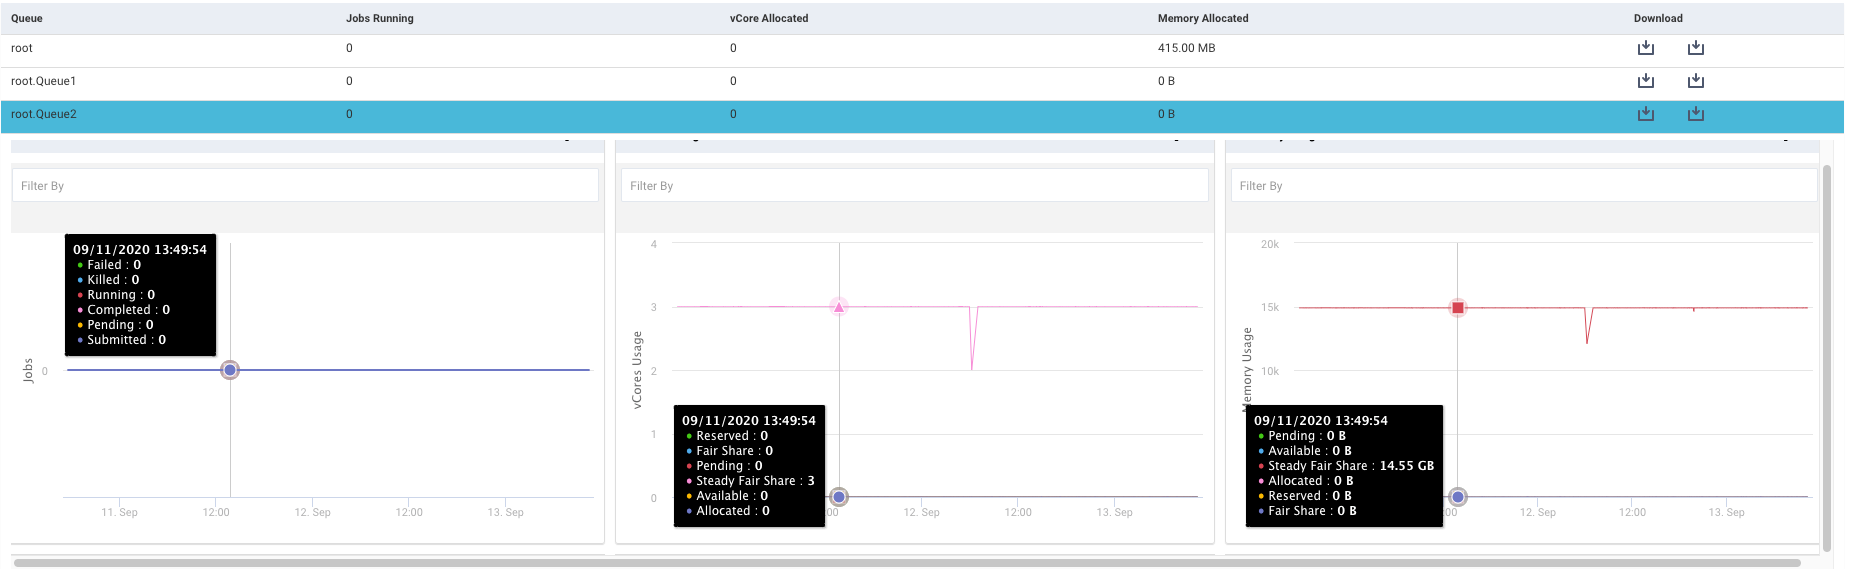

Click  to expand a graph. Each of the graphs can be filtered further.
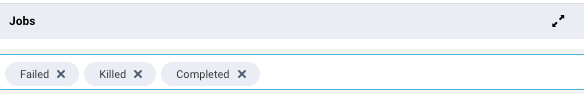
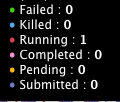
Jobs: This graph plots the number of jobs running along with their status, in the specified period. The status is shown in color-coded lines. The status can be any of the following which can be used to filter and change the trends shown in the graph.
vCore: This graph plots the usage of the allocated vCore along with the following metrics, for the selected queue, in the specified period. The metrics can be used to further filter the graph:
Reserved
Fair Share
Pending
Steady Fair Share
Available
Allocated
Memory Usage: This graph plots the memory usage along with the following metrics, for the selected queue, in the specified period. The metrics can be used to further filter the graph:
Reserved
Fair Share
Pending
Steady Fair Share
Available
Allocated
Click any point in the graph, the Resources page corresponding to the point of time clicked in the graph, for that queue is displayed.
Top X report
This topic provides information about the Top X applications. The Top X reports are enabled by default.
Generating TopX report
Click Reports > Archived. Click the
icon corresponding to Top X. In the New Report dialog box, enter the following parameters:
History (Date Range): Use the date picker drop-down to specify the date range.
Top X: Enter a number for the top Hive, Spark, Impala apps that you want to view.
Cluster: Select a cluster from where you want to generate the report.
Users: Users who submitted the app.
Real User: Users who actually submitted the app. For instance, the user might be a hive, but the real user is joan@mycompany.com.
Queue: Select queues.
Tags: Select tags.
Click
to generate the report.The progress of the report generation is shown on the top of the page and you are notified about the successful creation of the report. The latest successful report is shown on the Clusters > Top X page.
All reports (successful or failed attempts) are in the Reports Archive.
Scheduling TopX report
Click Reports > Archived. Click the
icon corresponding to Top X. In the Schedule Report dialog box provide the following details:
History (Date Range): Use the date picker drop-down to specify the date range.
Top X: Enter a number for the top Hive, Spark, Impala apps that you want to view.
Cluster: Select a cluster from where you want to generate the report.
Users: Users who submitted the app.
Real User: Users who actually submitted the app. For instance, the user might be a hive, but the real user is joan@mycompany.com.
Queue: Select queues.
Tags: Select tags.
Schedule to Run: Select any of the following schedule options from the drop-down and set the time from the hours and minutes drop-down:
Daily
Select a day in the week. (Sun, Mon, Tue, Wed, Thu, Fri, Sat)
Every two weeks
Every month
Notification: Provide either a single or multiple email IDs to receive the notification of the reports generated.
Click
.
Viewing TopX report
In the Reports > Archived, click the icon corresponding to Top X. The TopX report is displayed.
The following sections are included in the TopX reports which can be grouped by Hive, Spark, or Impala.
Input Parameters
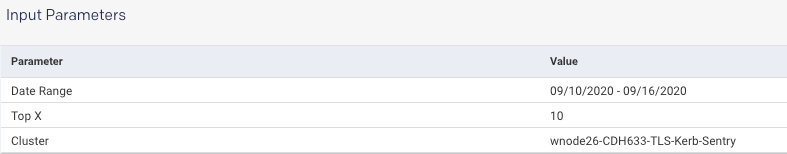
This section provides the basic information about the report, that is the date range selected, the number of top results included in the TopX report, and the cluster from where the report is generated.
Applications
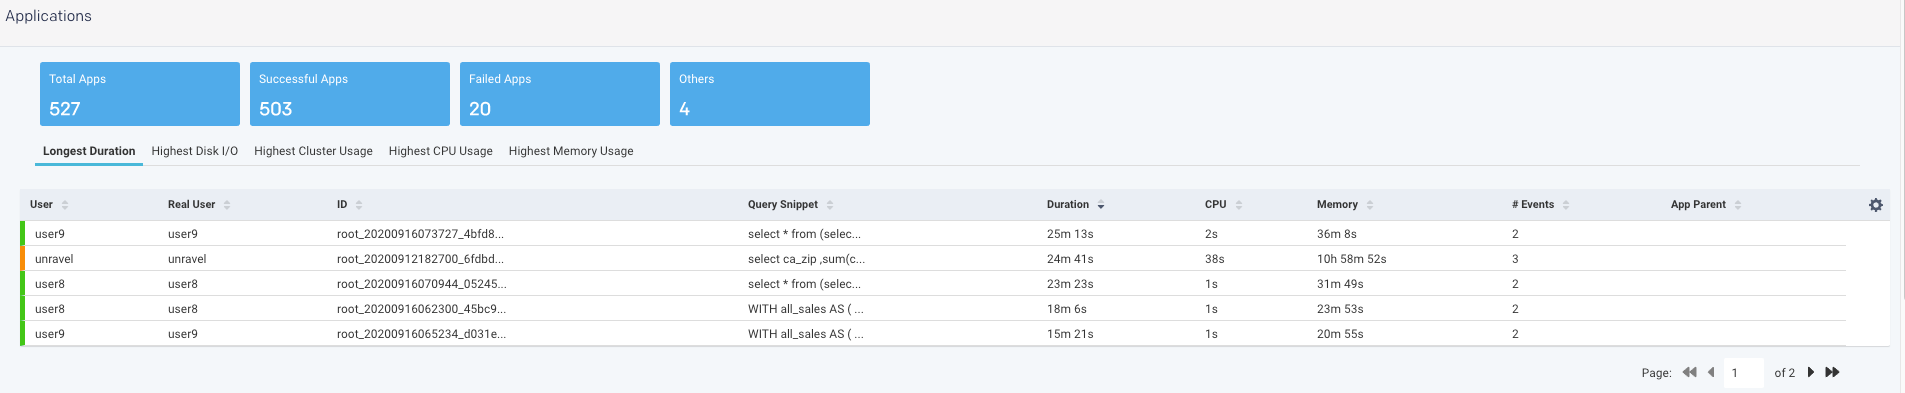
The Applications section shows the following app metrics for the generated TopX report:
Total Apps: Number of apps on the cluster.
Successful Apps: Number of apps that are completed successfully.
Failed Apps: Number of apps that have failed to complete.
Others: Number of apps that were killed, or those that are in a pending, running, waiting, or unknown state.
Further, the detailed TopX report for applications are generated which are grouped based on the following categories:
Longest Duration: The Top N number of applications that ran for the longest duration.
Highest Disk I/O: The Top N number of applications that have the highest disk input/output operations.
Highest Cluster Usage: The Top N number of applications that have the highest cluster usage.
Highest CPU Usage: The Top N number of applications that have the highest CPU usage.
Highest Memory Usage: The Top N number of applications that have the highest memory usage.
Click any of the tabs, to view further TopX details of the selected app.
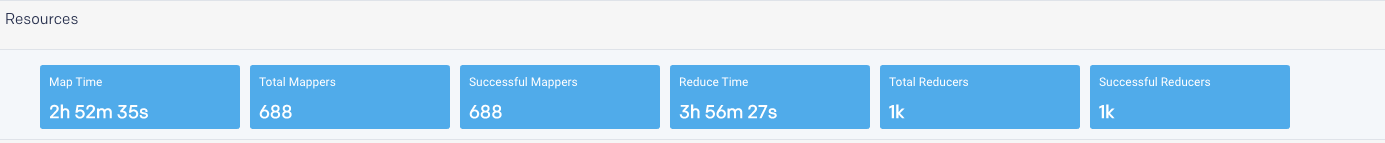
Resources
Resources breakdown the Map/reduce time for Hive apps. The information about total mappers, successful mappers, total reducers, and successful reducers is shown.
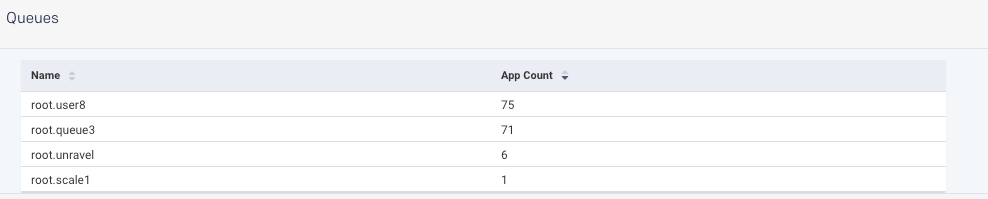
Queues
The Queues section shows the app count for the selected queue plus the other criteria, which were selected for generating the report.
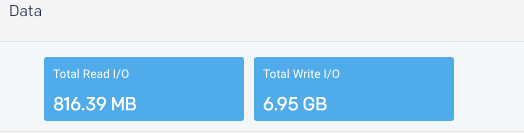
Data
The Data tile displays the cumulative total by Read and Write I/O
Tuning
This report is an OnDemand report which analyzes your cluster workload over a specified period. It provides insights and configuration recommendations to optimize throughput, resources, and performance. Currently, this feature only supports Hive on MapReduce.
You can use these reports to:
Fine-tune your cluster to maximize its performance and minimize your costs.
Compare your cluster's performance between two time periods.
Reports are generated on an ad hoc or scheduled basis. All reports are archived and can be accessed via the Reports Archive tab. The tab opens displaying the last report, if any, generated.
Generating Tuning report
Click Reports > Archived. Click the
icon corresponding to Tuning. In the New Report dialog box provide the following details:
Date Range: Select a period from the date picker.
Cluster: In a multi-cluster setup, you can select the cluster from where you want to generate the report.
Click
to generate the report.The progress of the report generation is shown on the top of the page and you are notified about the successful creation of the report.

All reports (successful or failed attempts) are in the Reports Archive.
Scheduling Tuning report
Click Reports > Archived. Click the
icon corresponding to Tuning. In the Schedule Report dialog box provide the following details:
Date Range: Select a period from the date picker.
Cluster: In a multi-cluster setup, you can select the cluster from where you want to generate the report.
Schedule Name: Name of the schedule.
Schedule to Run: Select any of the following schedule options from the drop-down and set the time from the hours and minutes drop-down:
Daily
Weekdays (Sun-Sat)
Every two weeks
Every month
Notification: Provide an email ID to receive the notification of the reports generated.
Click
.
Viewing the Tuning report
In the Reports > Archived, click the icon corresponding to Tuning. The Tuning report is displayed.
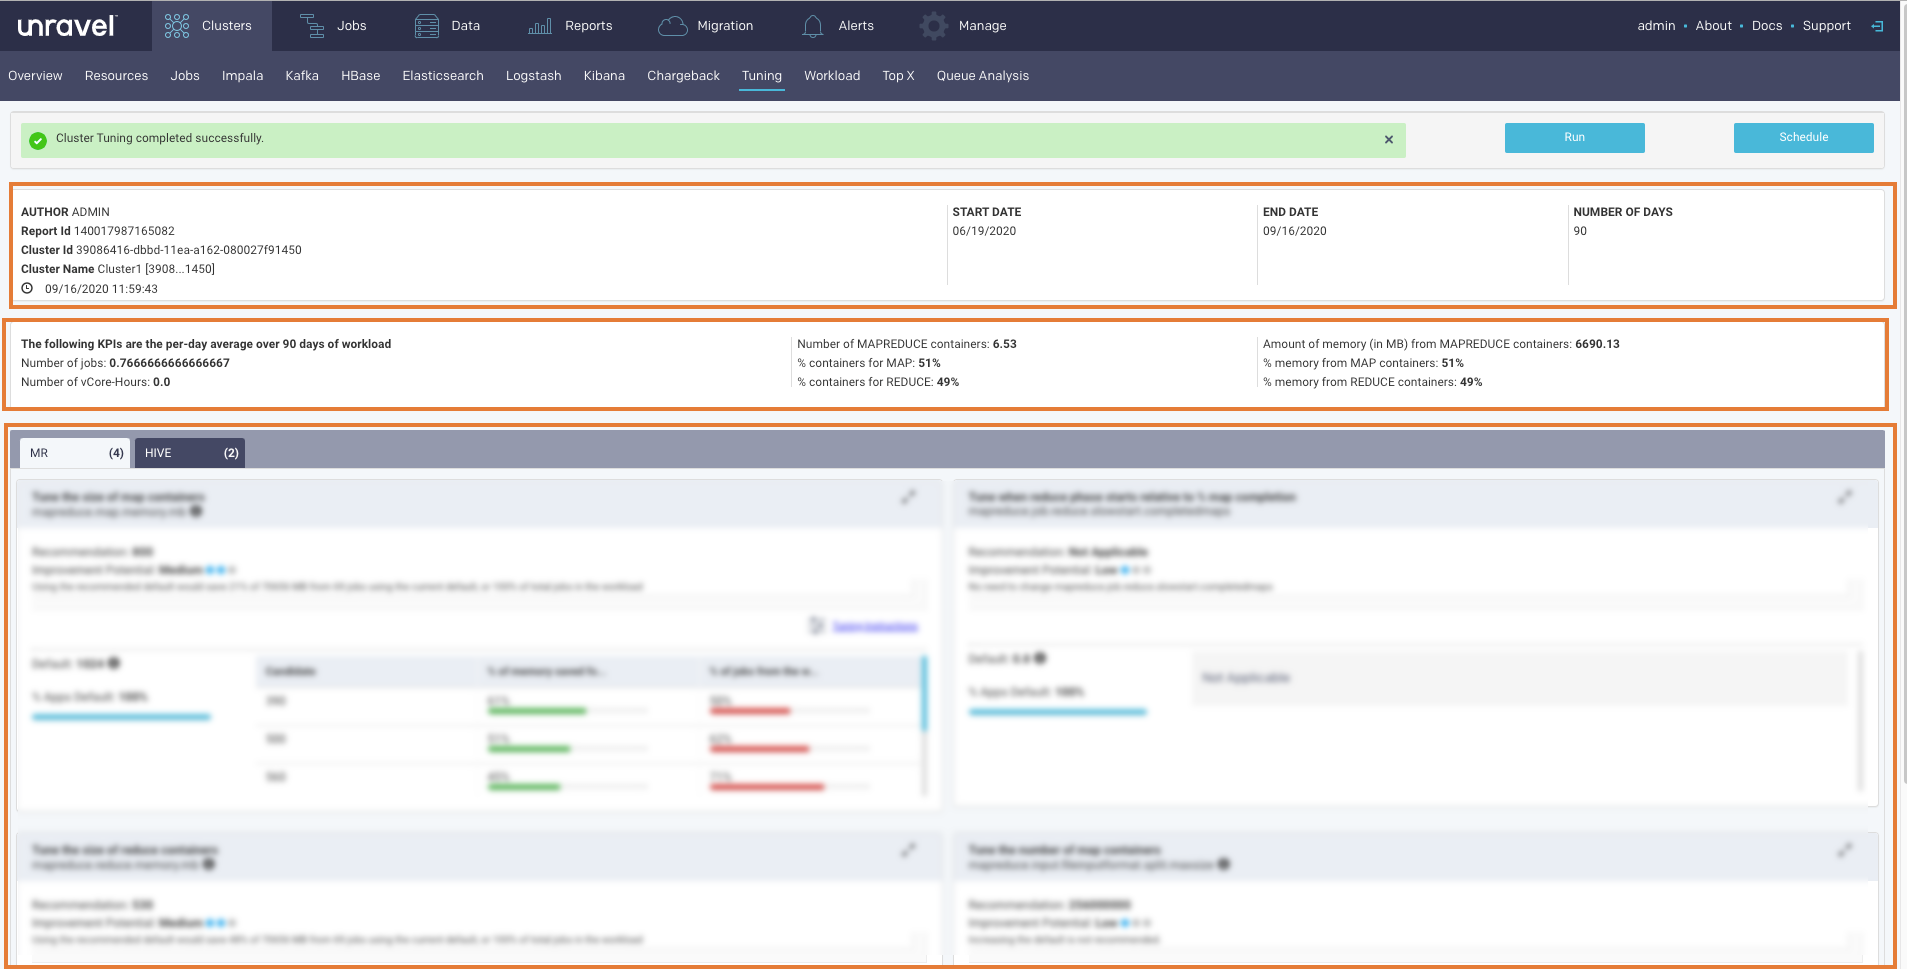
The Report has three sections.
Header: This section contains the following basic information about the report:
Item
Description
Author
Unravel user who has generated the report.
Report Id
Unique identification of the report.
Cluster Id
Unique identification of the cluster from where the report is generated.
Cluster Name
Name of the cluster from where the report is generated.
Time stamp
The date and time when the report was generated.
Start Date
Start date in the selected time range for the report.
End Date
End date in the selected time range for the report.
Number of Days
Select time range for the report in days.
KPIs: This section provides the following KPI information. The KPIs are calculated as per-day average of the workload in the selected time range.
Number of Jobs
Number of vCore Hours
Number of MapReduce Containers
% containers for Map
% containers for Reduce
Amount of memory (in MB) from MapReduce containers
% containers from Map containers
% containers from Reduce containers
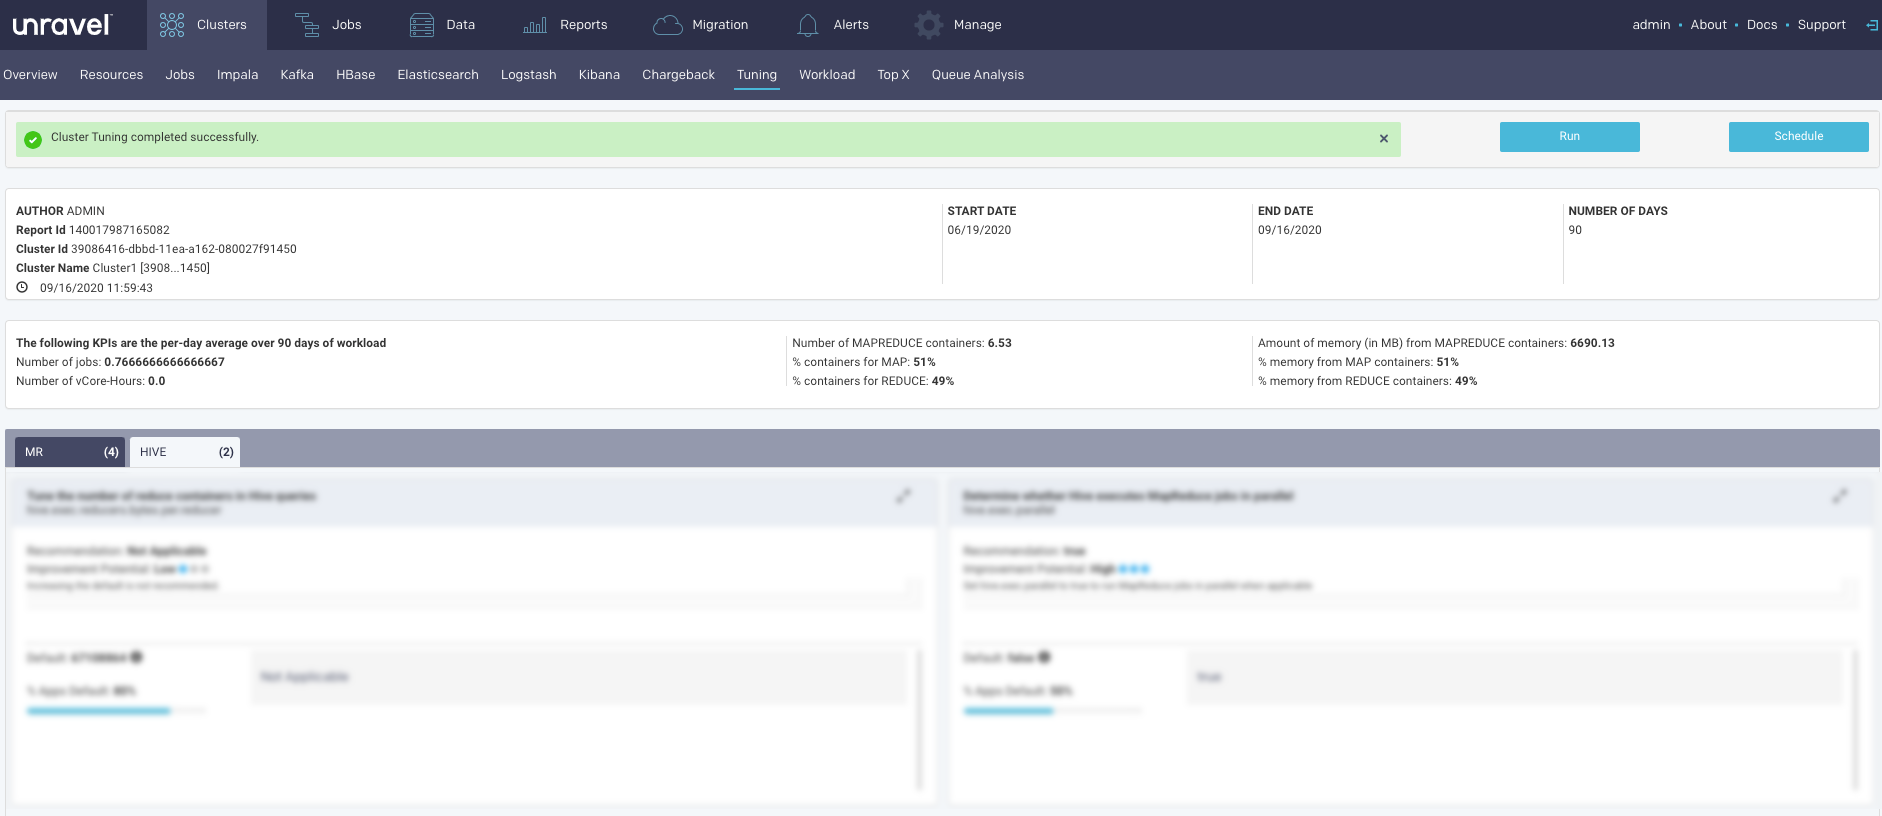
Insights/Recommendations
This section provides tuning instructions, recommendations, and insights. Click
 to tuning instructions. Click
  for viewing the related properties. Click
  to close any information box. Click to expand or collapse any of the sub-sections.