Databricks Health Check ROI app
You can use the Unravel Databricks Health Check App to analyze and optimize the efficiency of your Databricks environment.. It gives you insights into costs, resource usage, and efficiency, covering areas like your user, workspace, cluster, and job details. The app also provides recommendations for optimizing your workloads, finding potential savings through job migration, and analyzing your cluster-related costs and wastage.
Cost visibility: Gain insights into daily cost trends and understand the breakdown across users, workspaces, clusters, and jobs.
Resource Optimization: Identify opportunities to optimize workloads by analyzing average CPU, memory, and disk usage.
Cluster Efficiency: Evaluate the efficiency of interactive/all-purpose clusters, including trends and detailed cost breakdowns.
Identify Potential Savings: Identify potential cost savings by migrating workloads from interactive/all-purpose clusters to automated clusters. Analyze periods of cluster wastage, attributing a dollar value estimate, and explore potential savings by moving workloads.
Workload Classification: Classify workloads based on worker memory and CPU utilization, aiding in the identification of optimization candidates.
Important
After installation, download the insights-service-jar file from the install package and place it in this location: <unravel_installation_directory>/appstore_apps/healthcheck-ROI/healthcheck-ROI.
In this tab you can view the summary of the total cost, users, workspaces, clusters, and jobs.
On the Unravel UI, from the upper-right corner, click
 and select App Store. The App Store page is displayed.
 Open the Healthcheck ROI app. The Summary tab is opened by default.
Click on the required tile to view the trends and reports.

You can view the daily cost trend, workload breakdown, and compute breakdown here.

Daily Cost Trend: Visualize the daily cost trends to understand expenditure patterns.
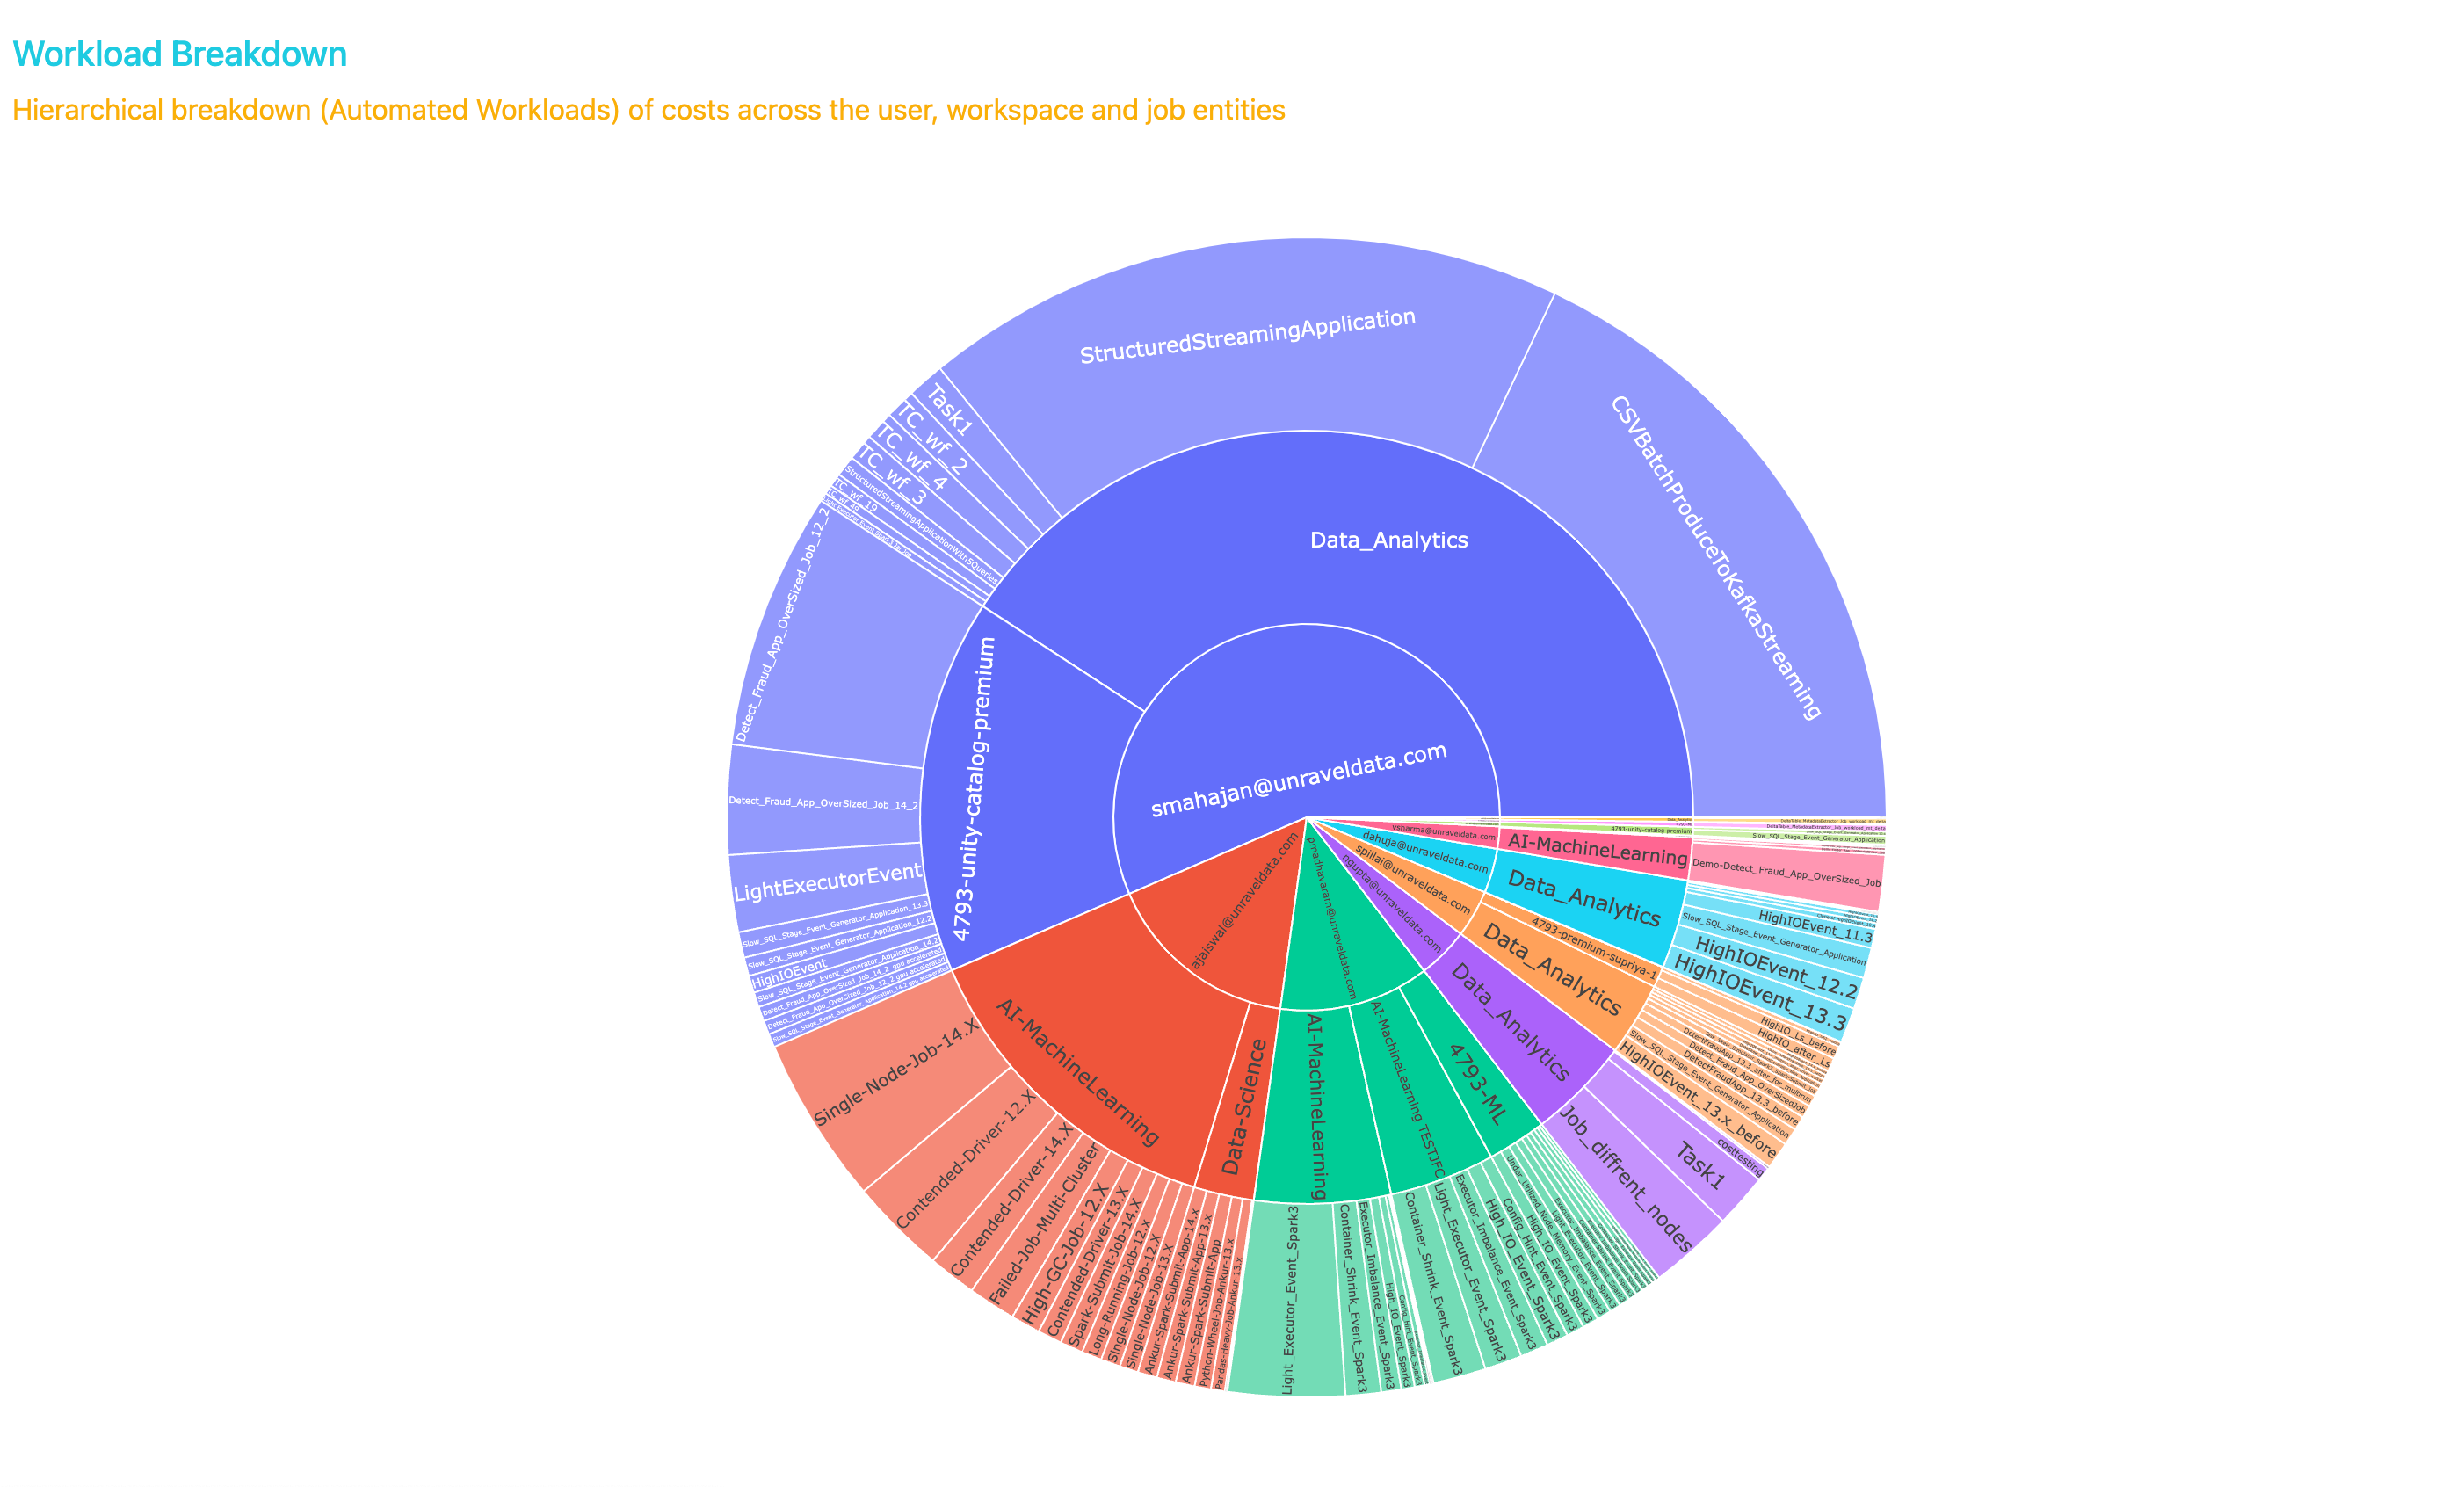
Workload Breakdown: Gain insights into hierarchical costs across users, workspaces, and jobs.
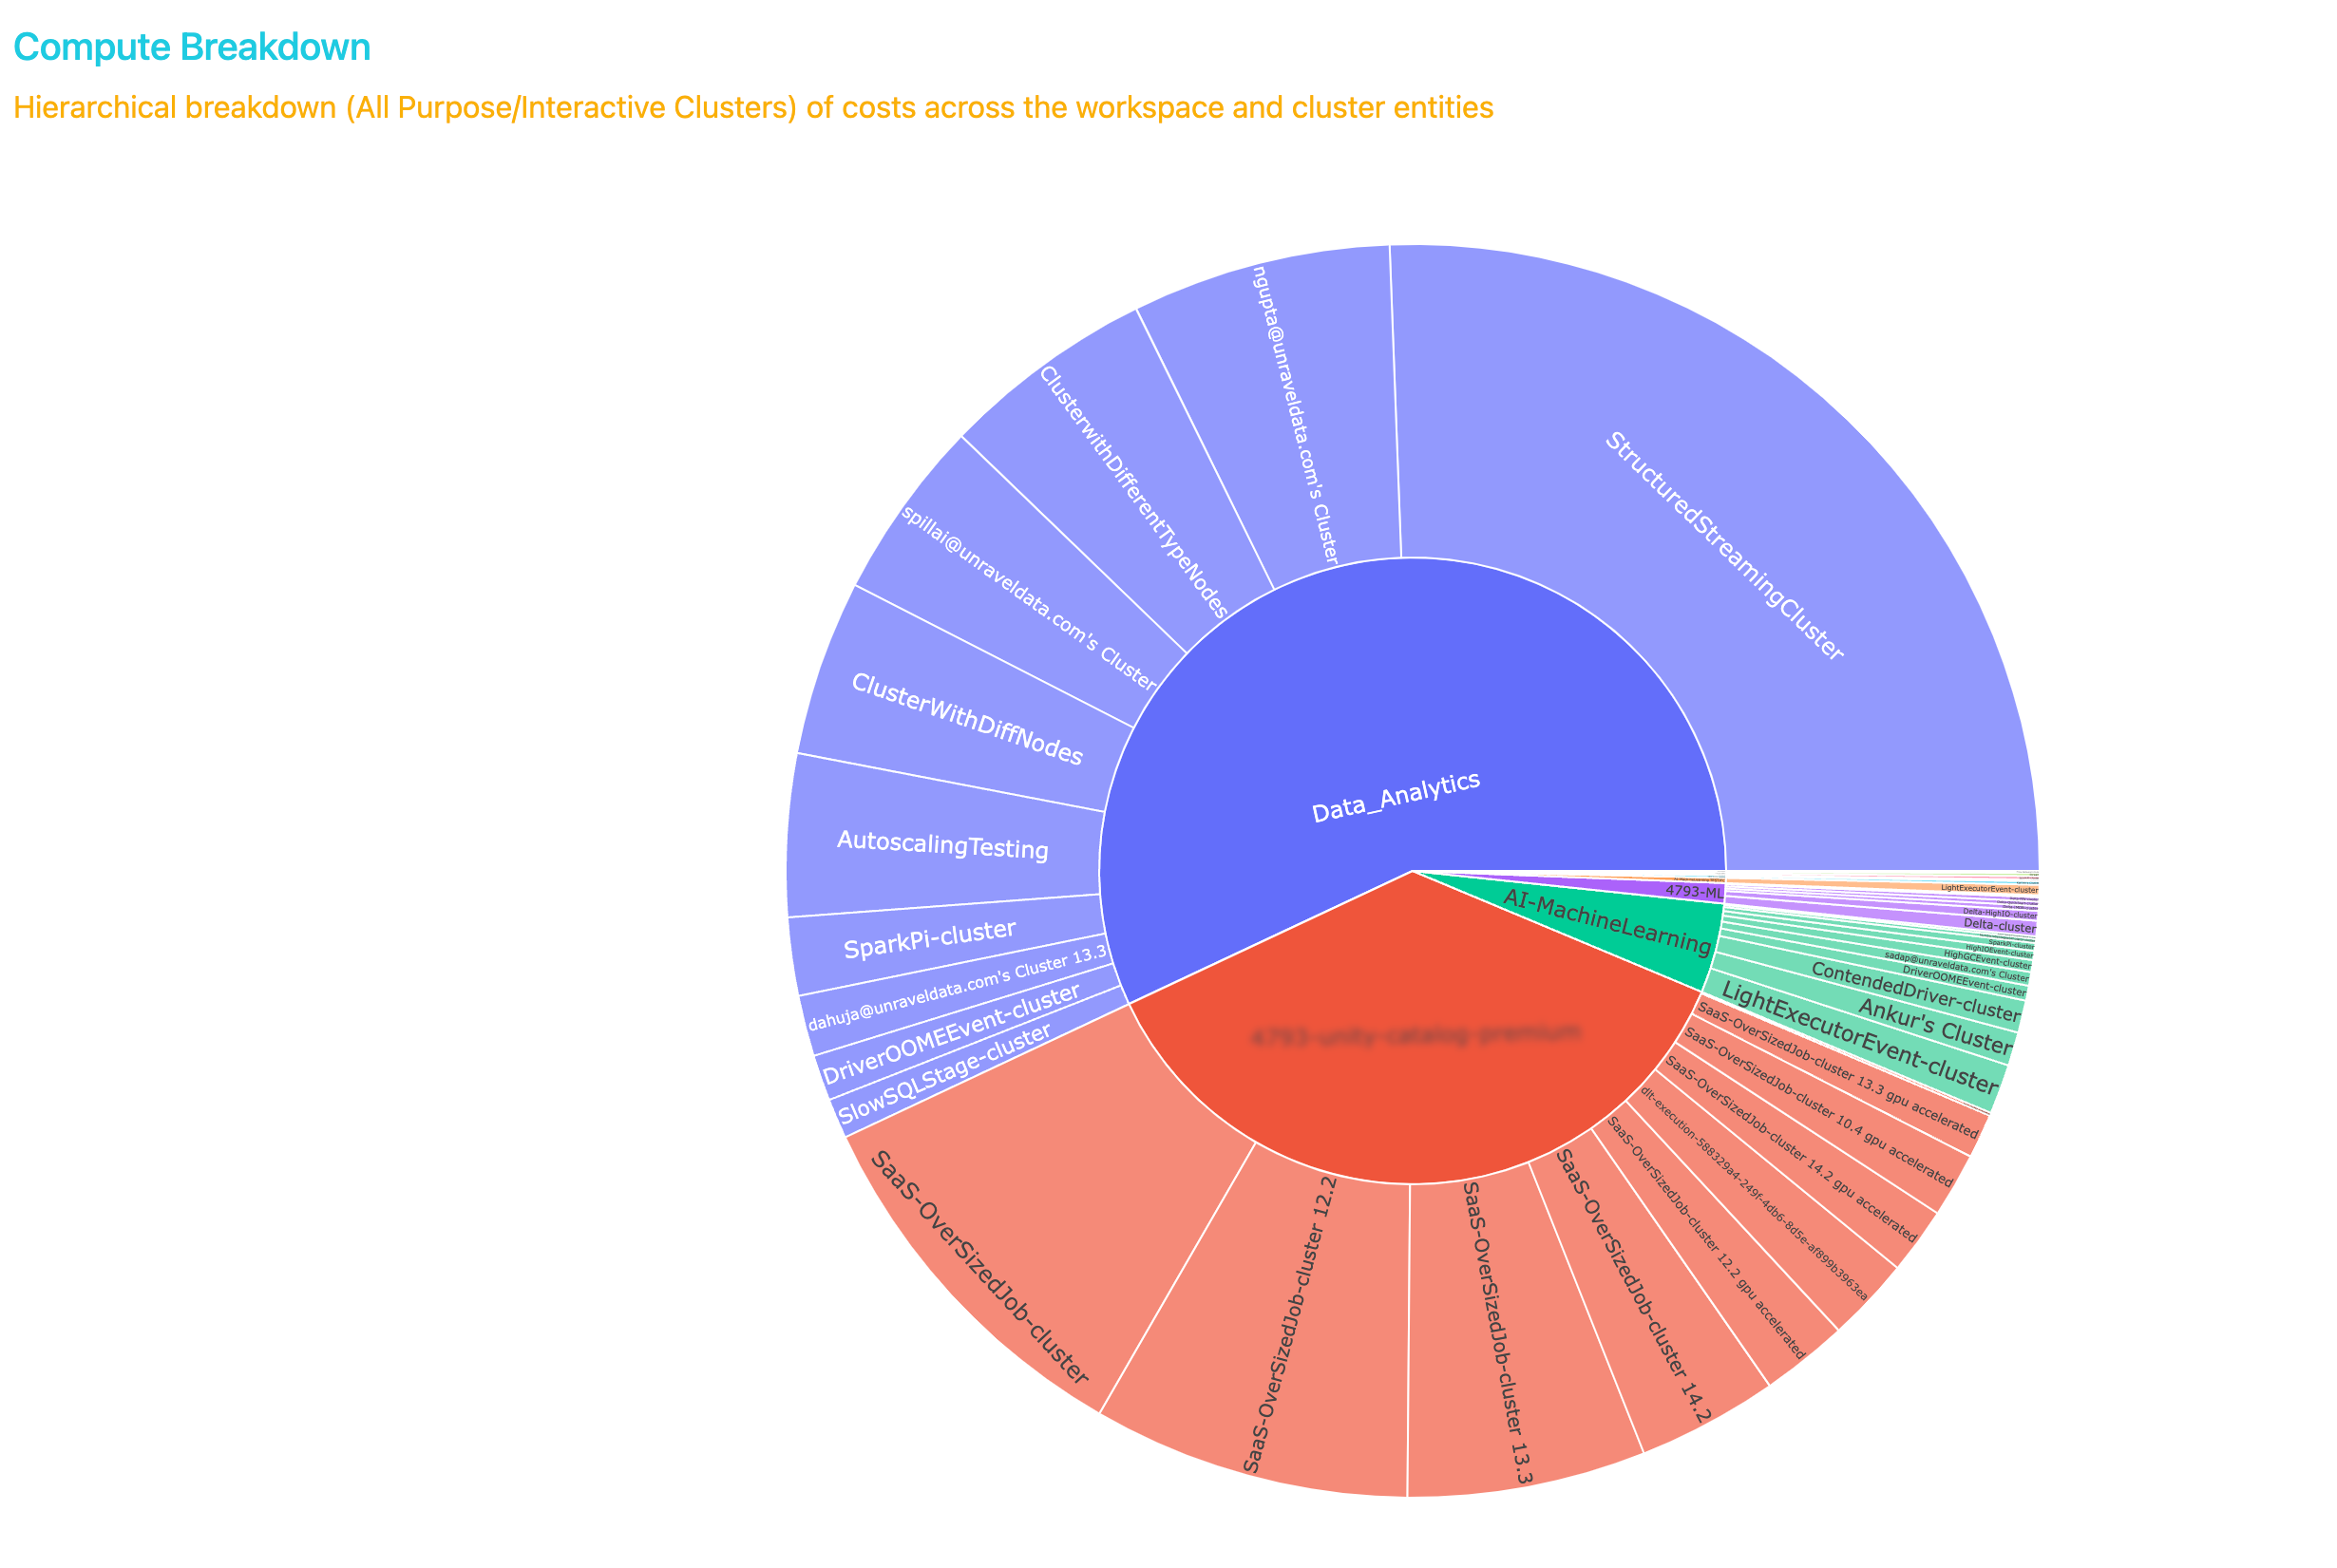
Compute Breakdown: Analyze hierarchical costs across workspaces and clusters.
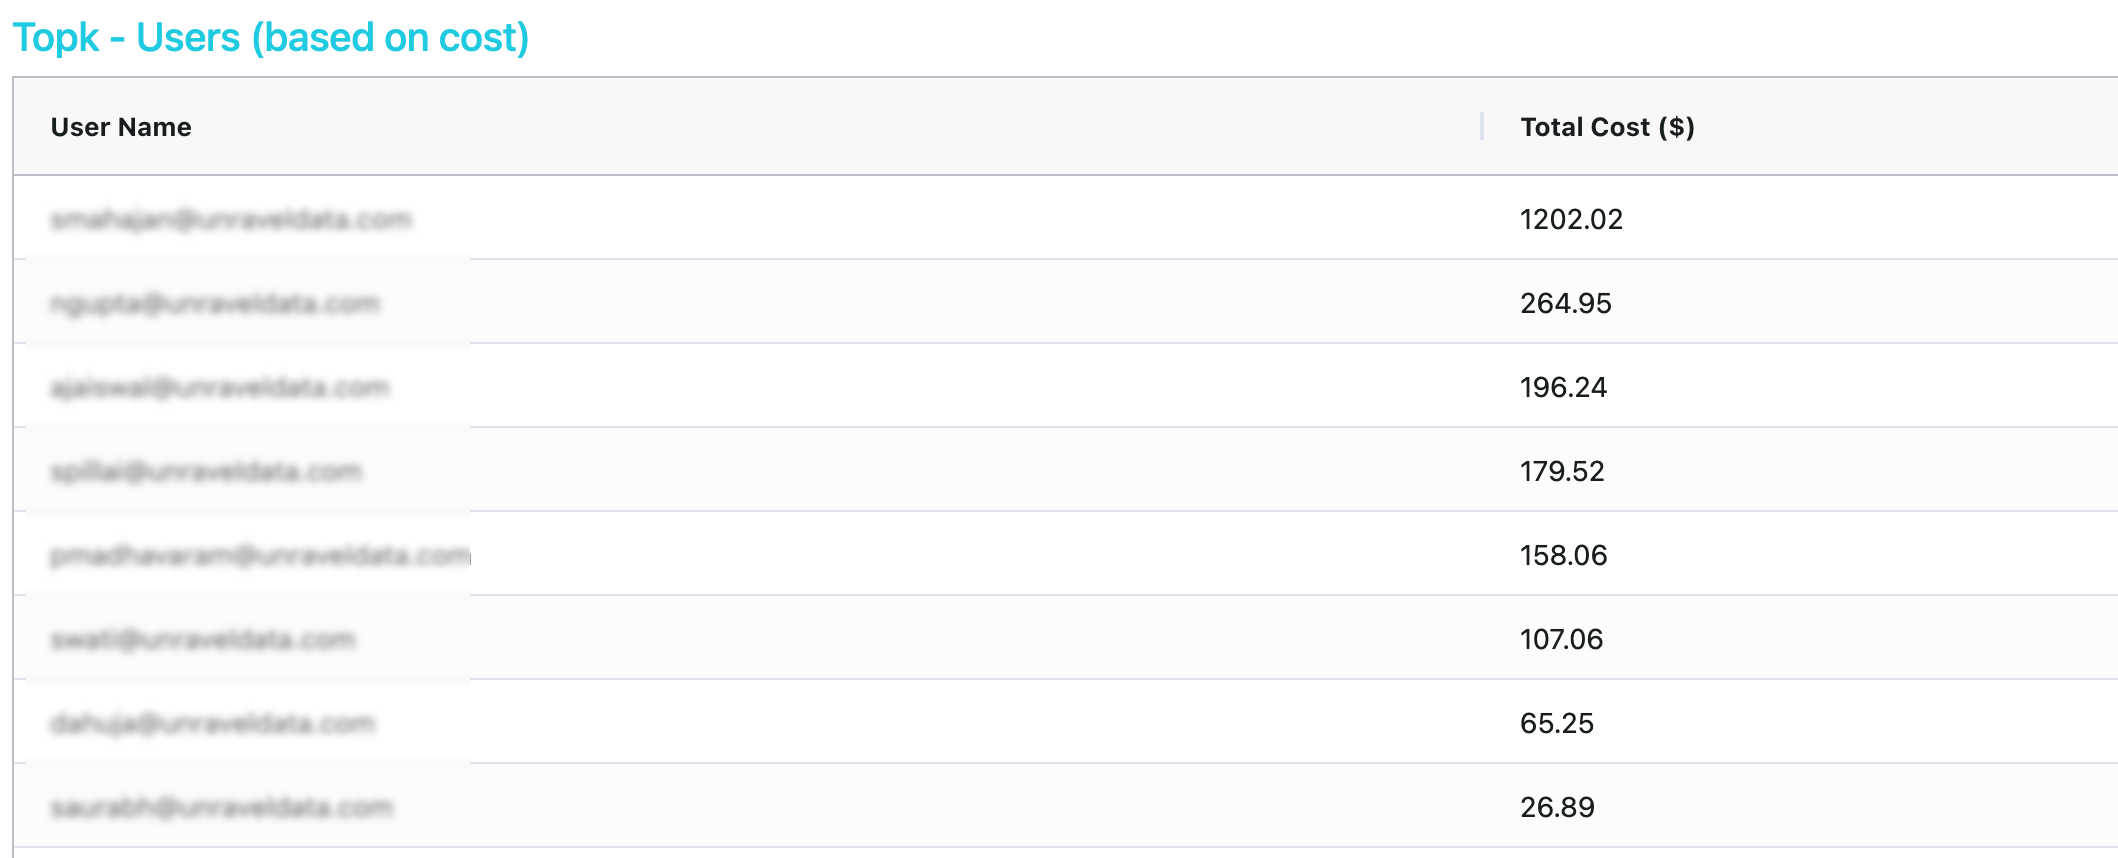
You can identify the top users based on cost, trends in user-related costs, and access detailed information about the users.

Topk-Users (based on cost)
User-Cost Trends
User Details

You can identify the top workspaces based on cost, explore trends in workspace-related costs, and access detailed information about workspaces in this tab.
TopK Workspaces (based on cost)
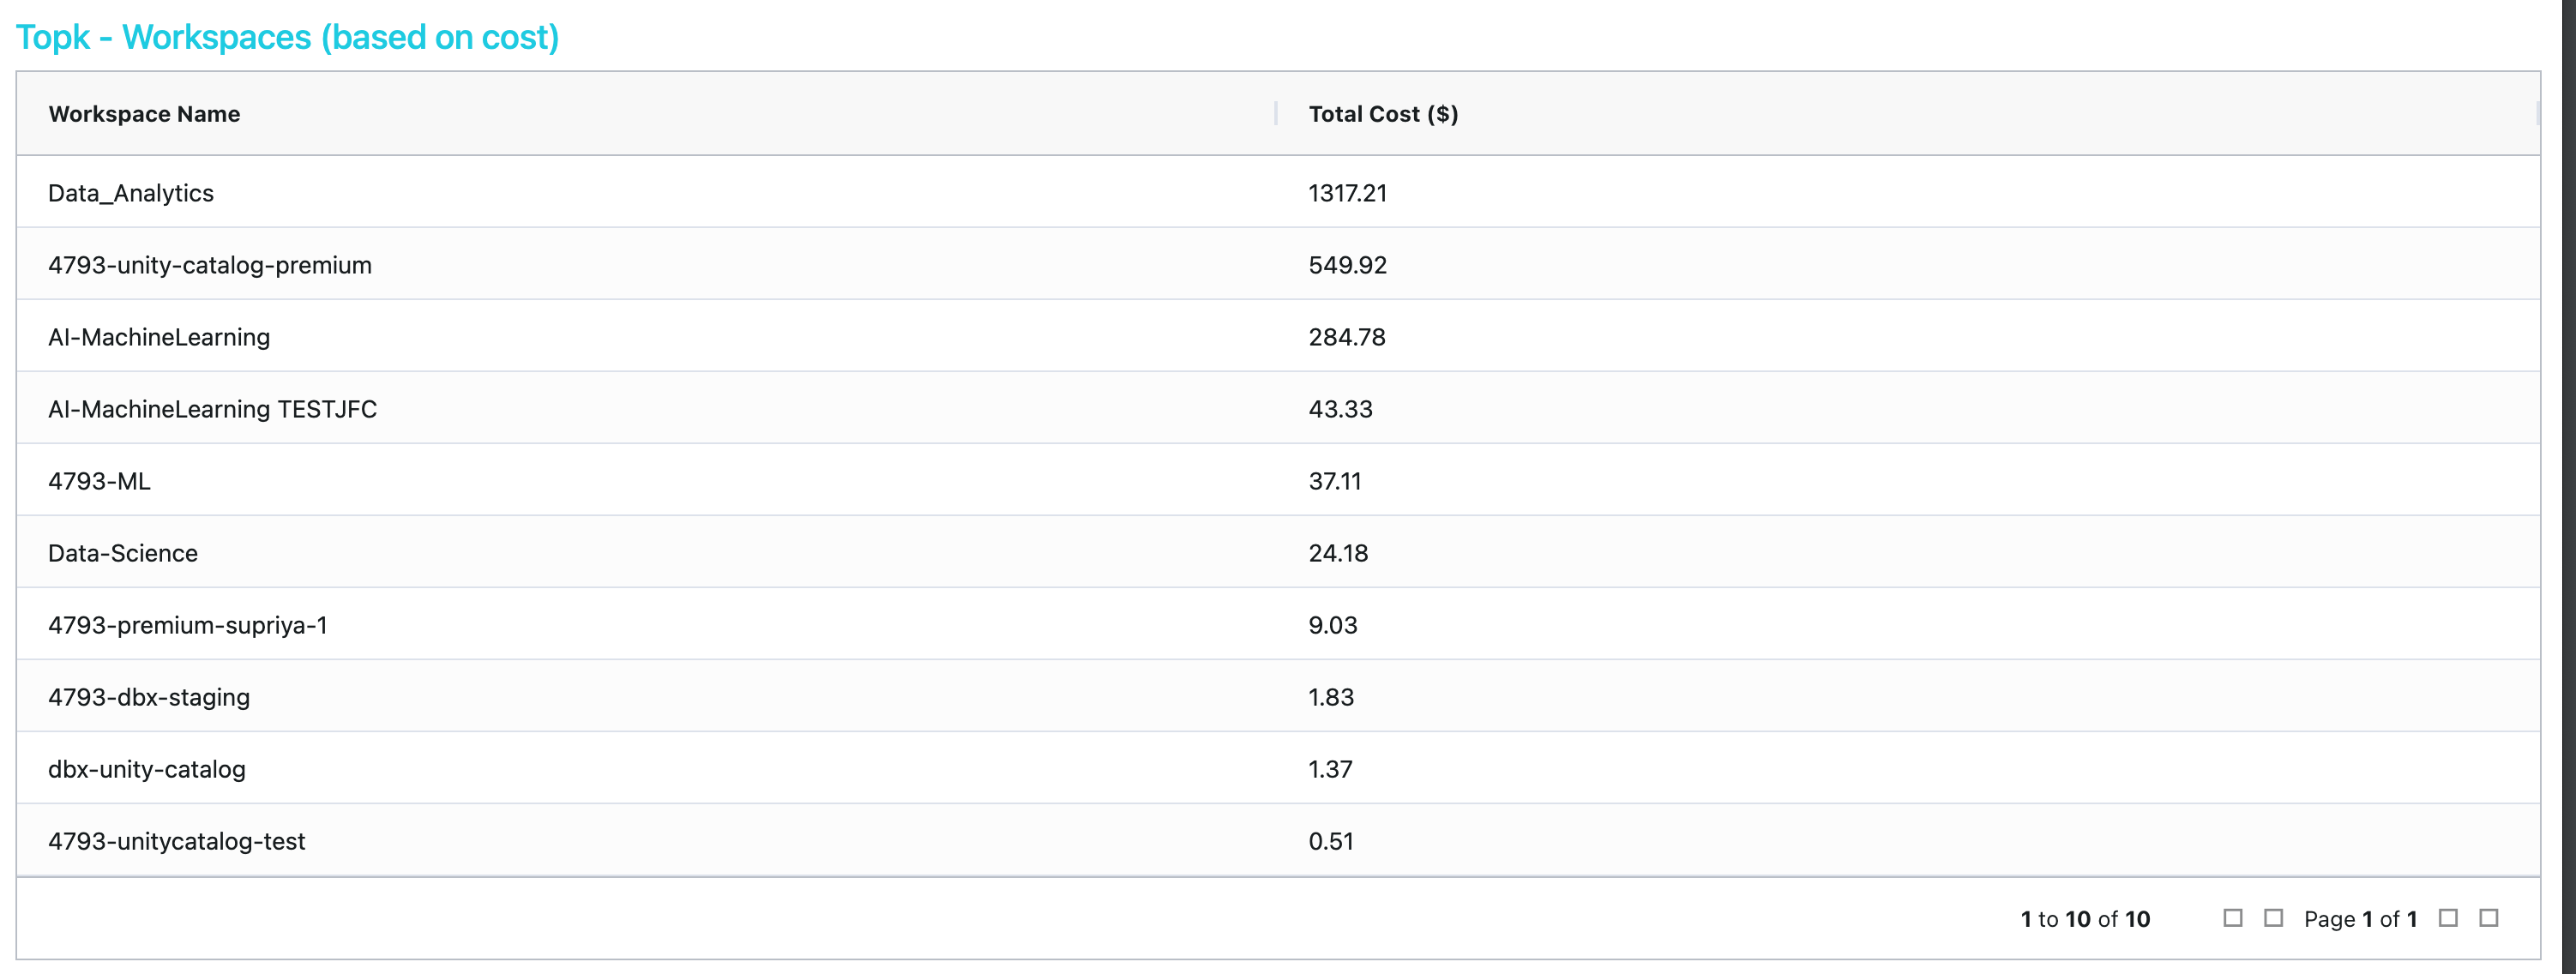
Workspace-Cost Trends

Workspace Details

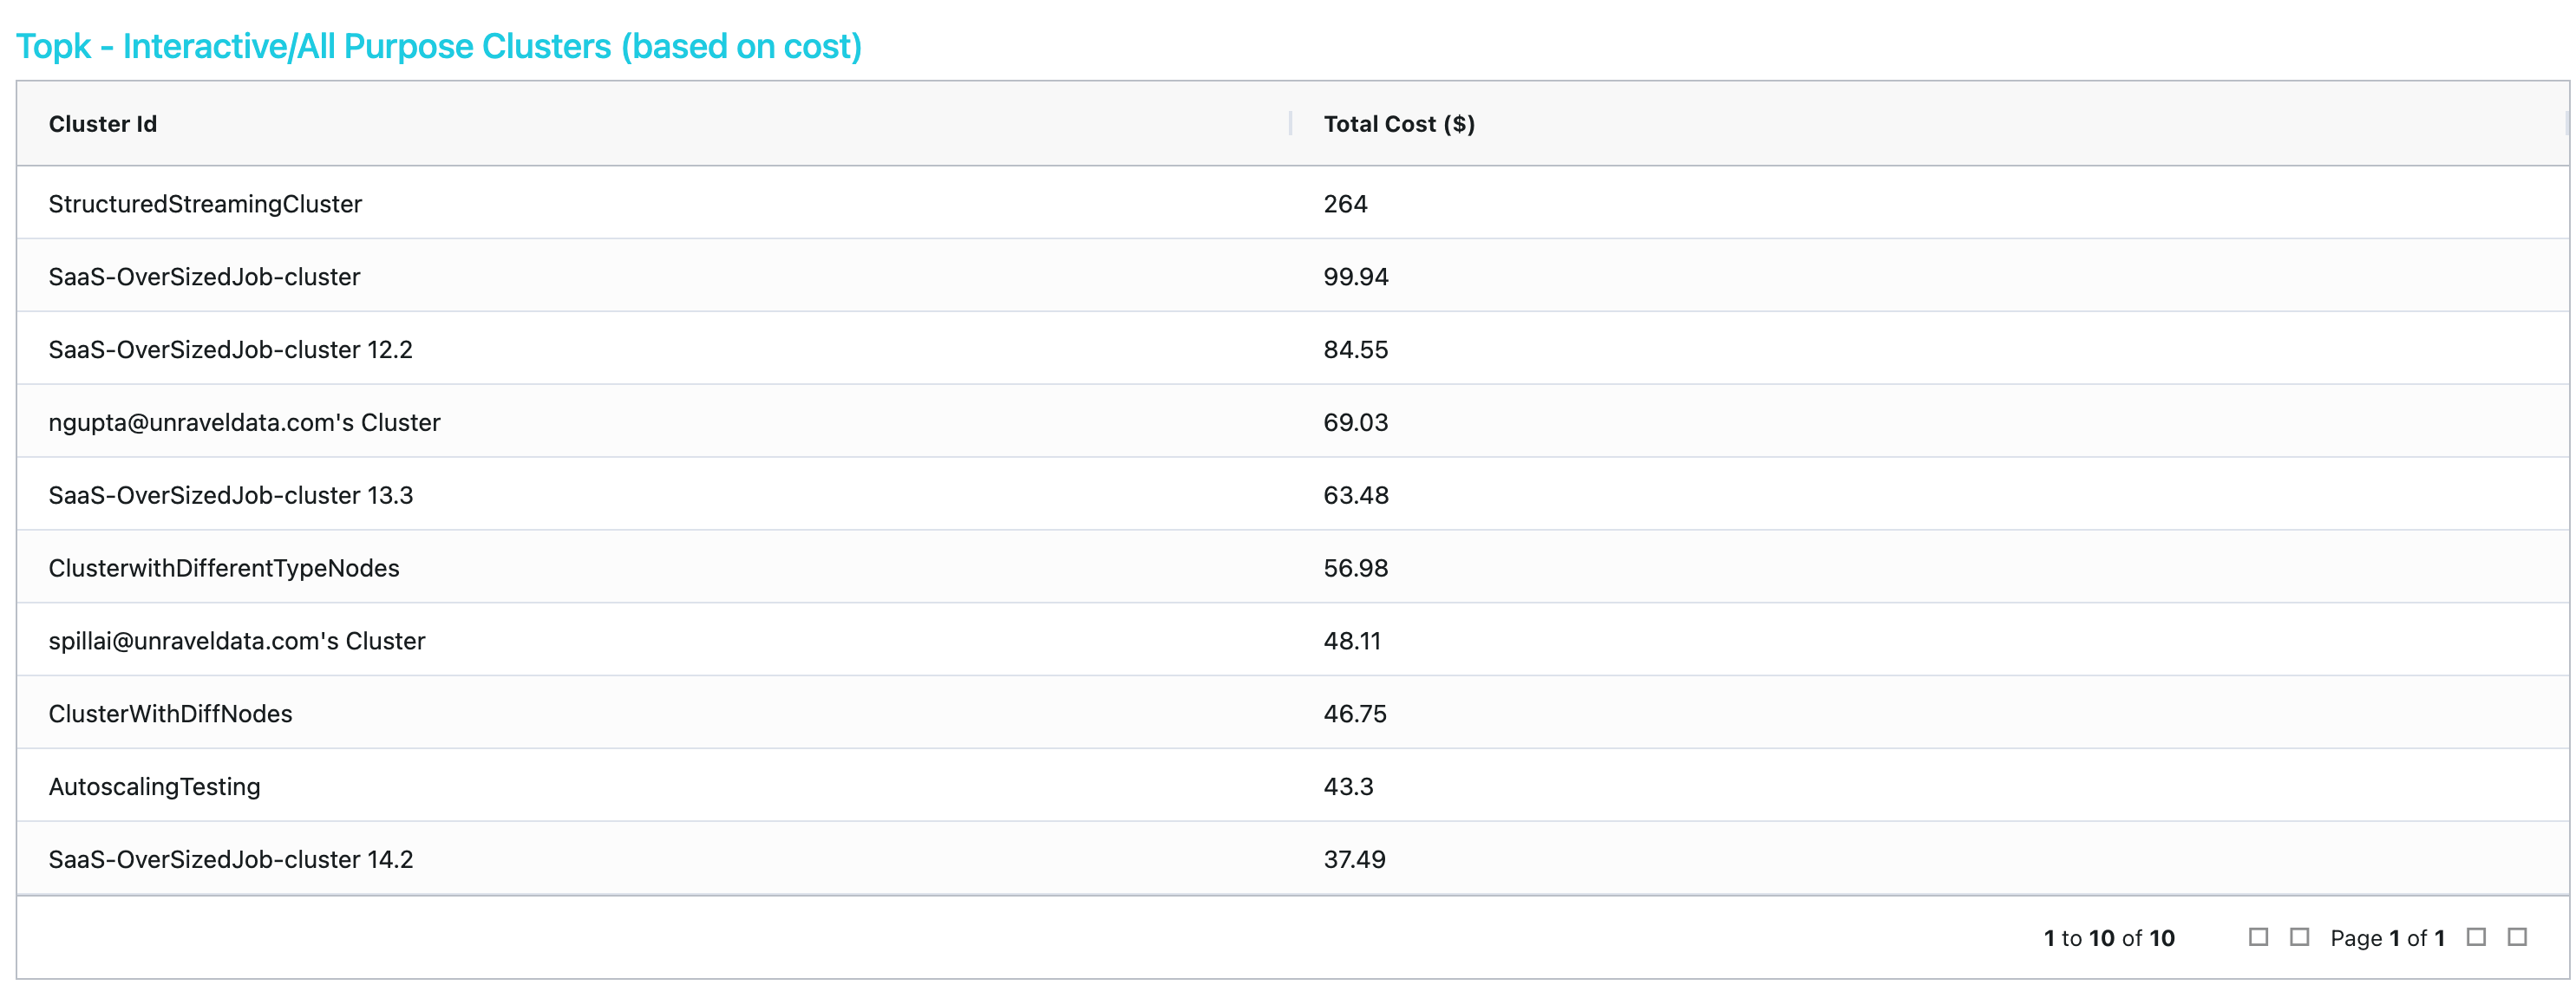
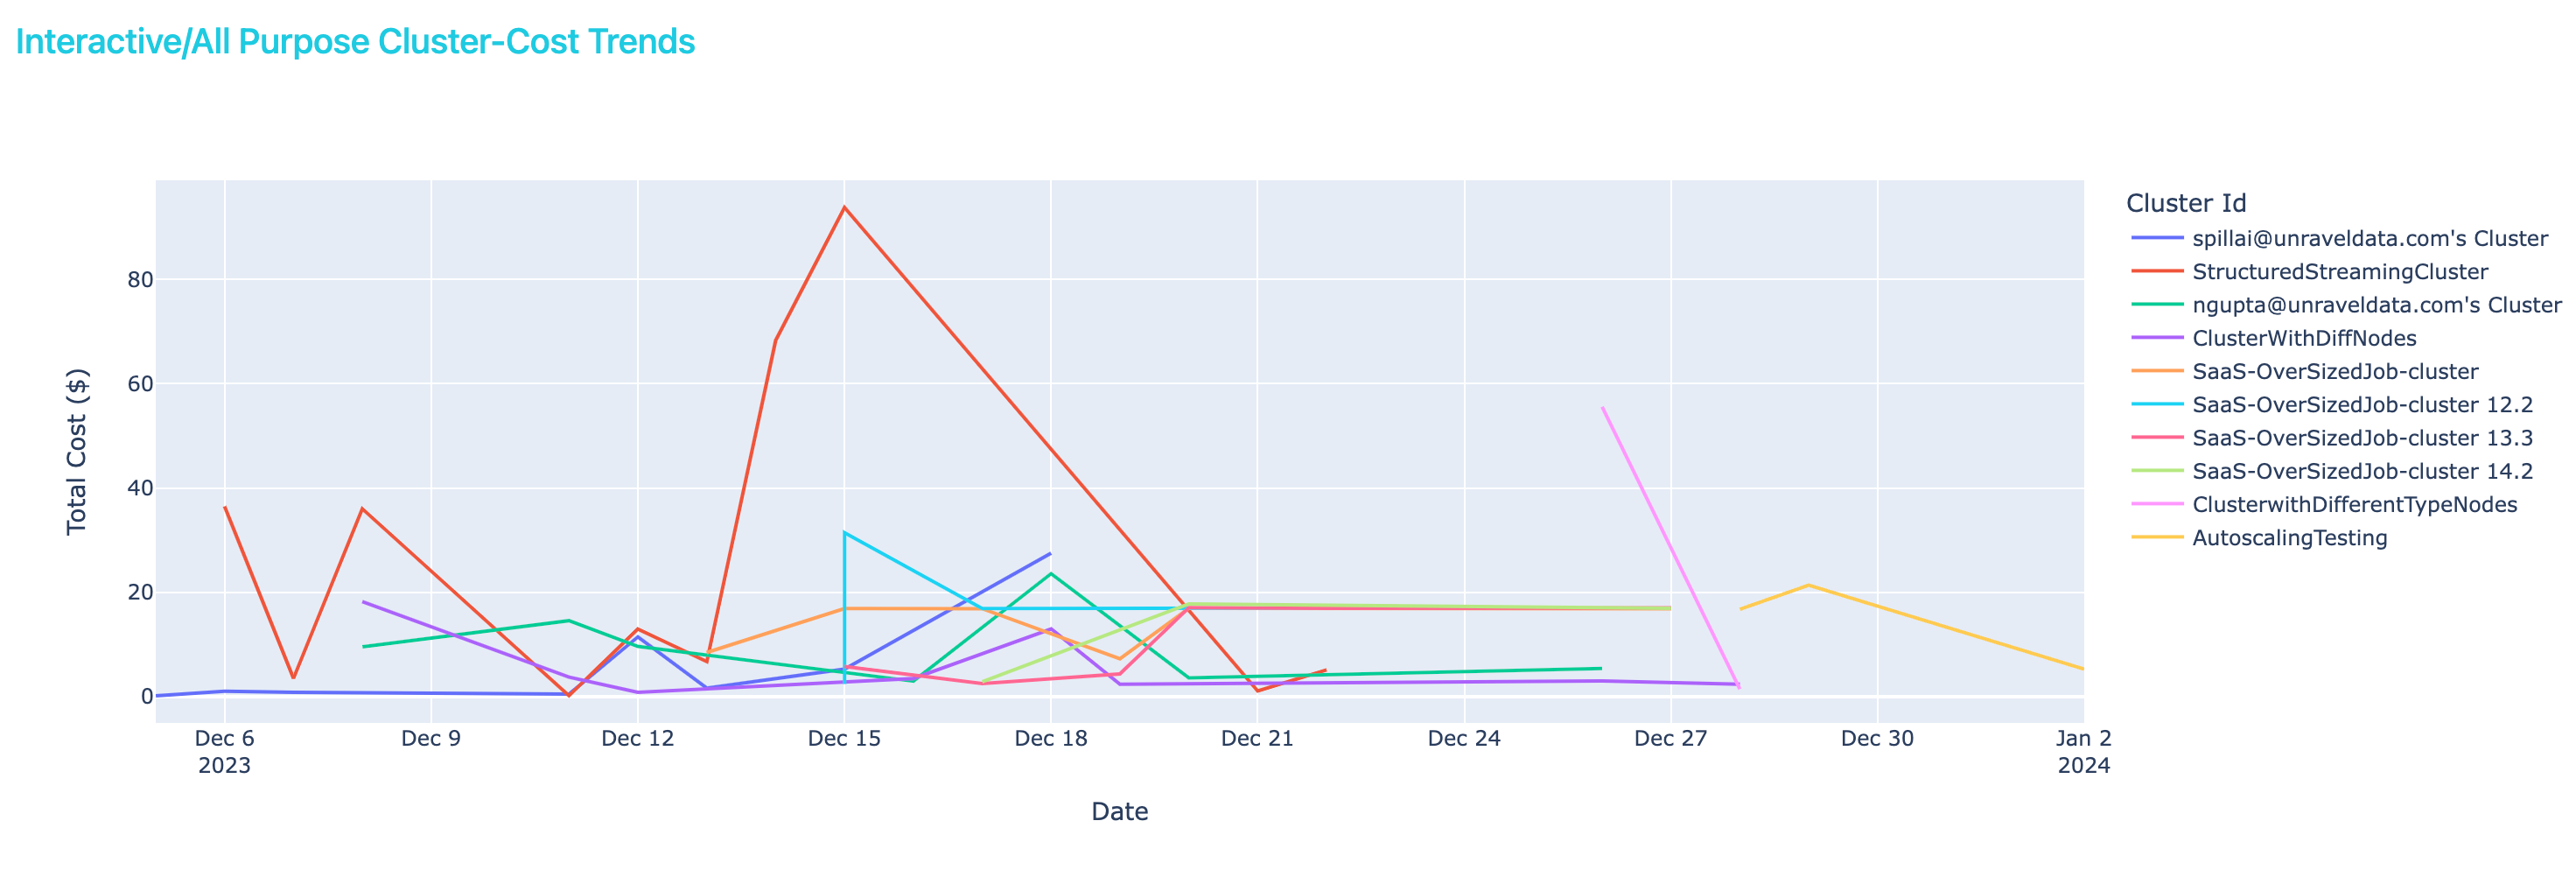
You can identify the top interactive/all-purpose clusters based on cost, explore trends in cluster-related costs, and access detailed information about clusters in this tab.
Topk - Interactive/All Purpose Clusterss (based on cost)
Interactive/All Purpose Clusters-Cost Trends
Interactive/All Purpose Clusters Details

You can identify top jobs based on cost, explore trends in job-related costs, and access detailed information about jobs in this tab.
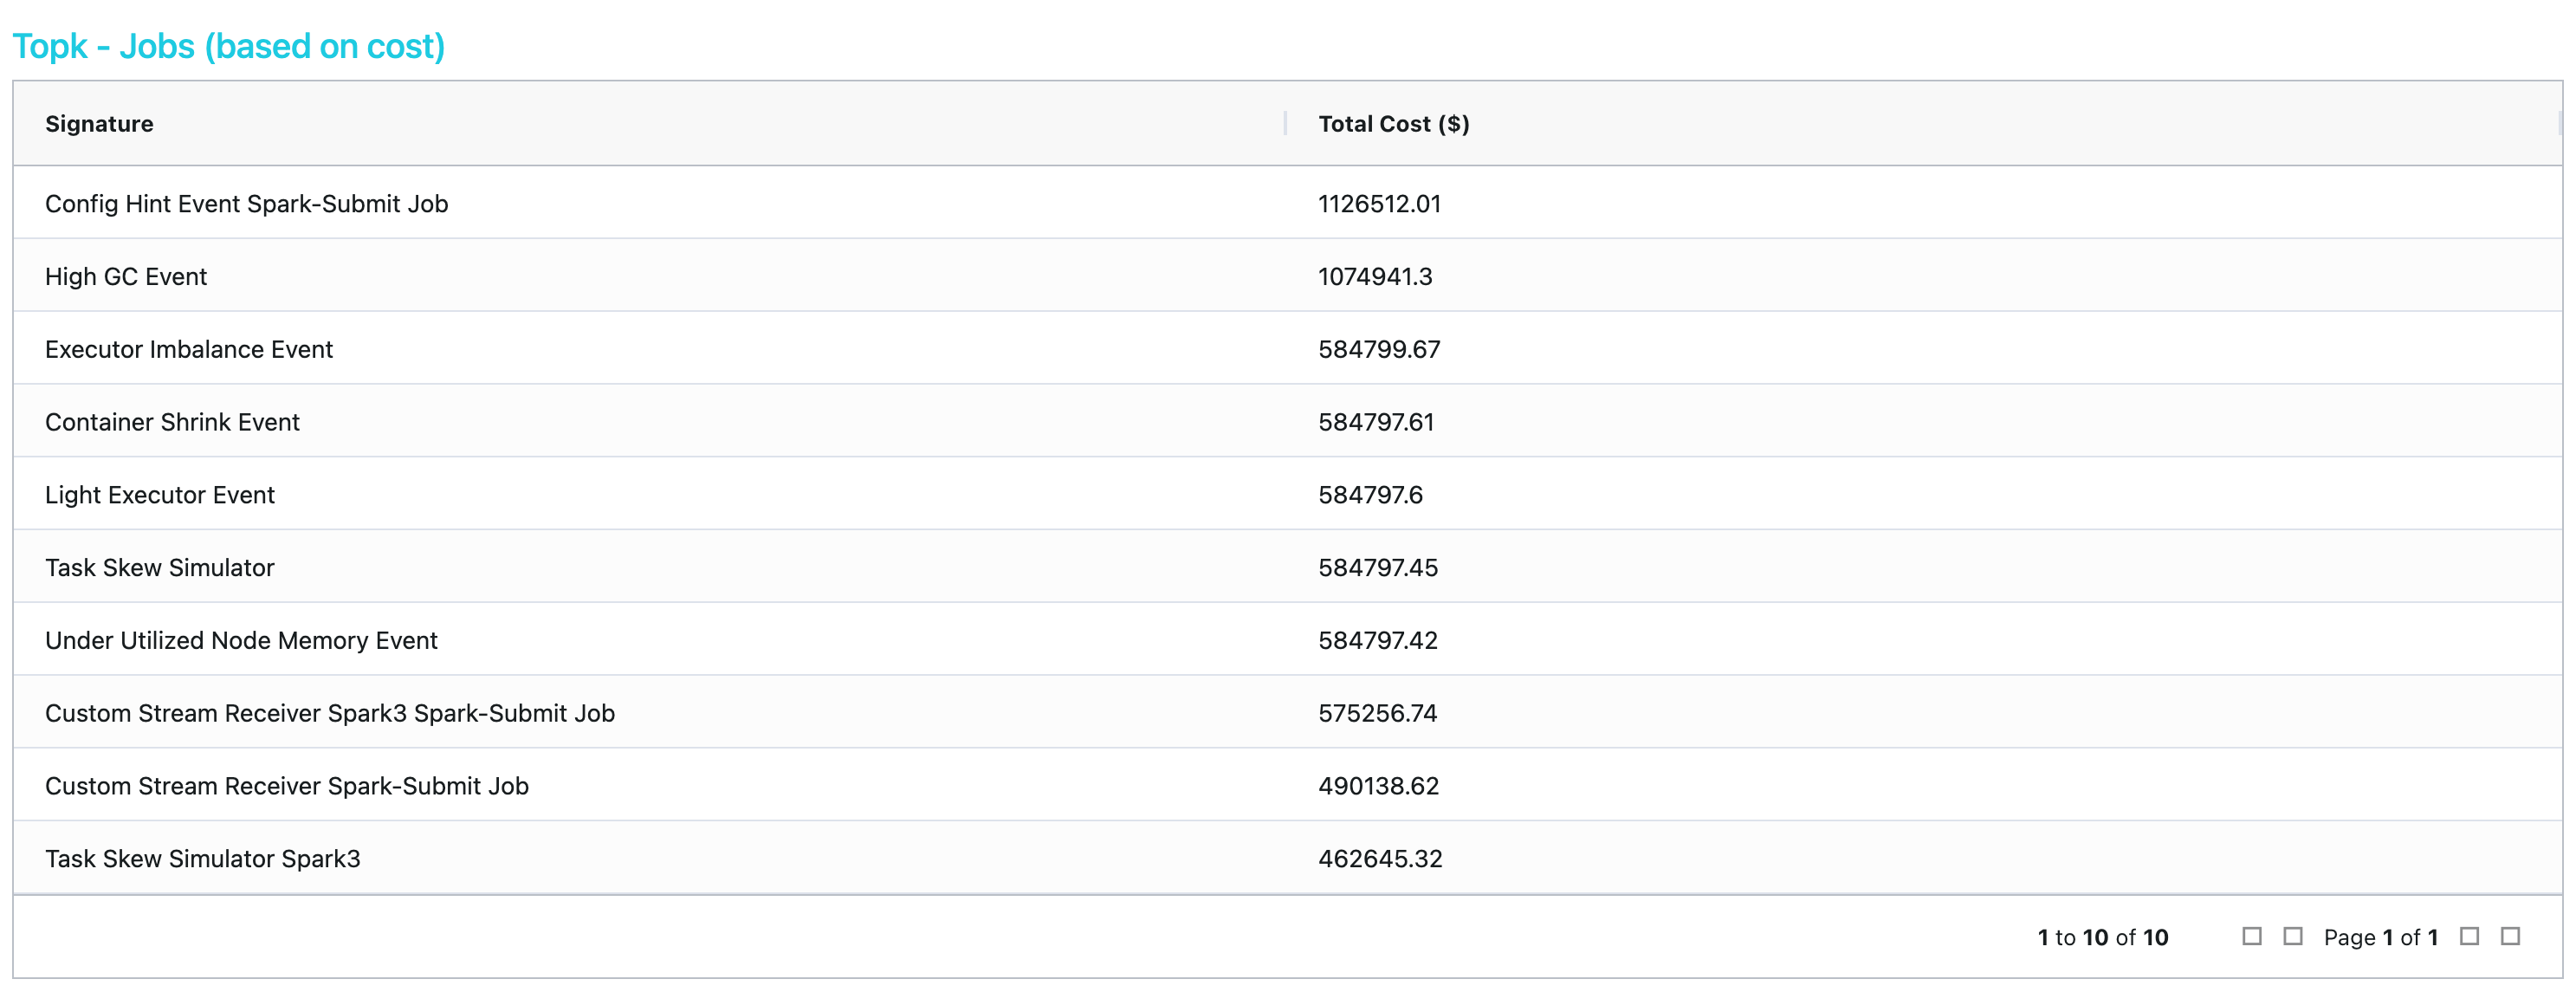
Topk - Jobs (based on cost)
Job-Cost Trends

Job Details

Workload (Healthcheck ROI App)
The Workload page of the Healthcheck ROI app helps you understand and optimize your Databricks setup. Dive in to analyze how your resources like CPU, memory, and disk are used. Explore detailed insights into your workloads and get actionable recommendations. You can also organize your workloads based on worker resources and find areas for improvement. Identify which workloads can be fine-tuned for better performance and explore opportunities to save costs through migration.
Analyze the workload efficiency using the Workload Optimization and Migration Savings tabs.

Open the Healthcheck ROI app.
Click Workloads . The Workload Optimization is opened by default. Scroll down to view the required information.
Click Migration Savings to explore the migration savings.
You can analyze the Workload Optimization, Worker Resource, and Driver Resource in this tab.
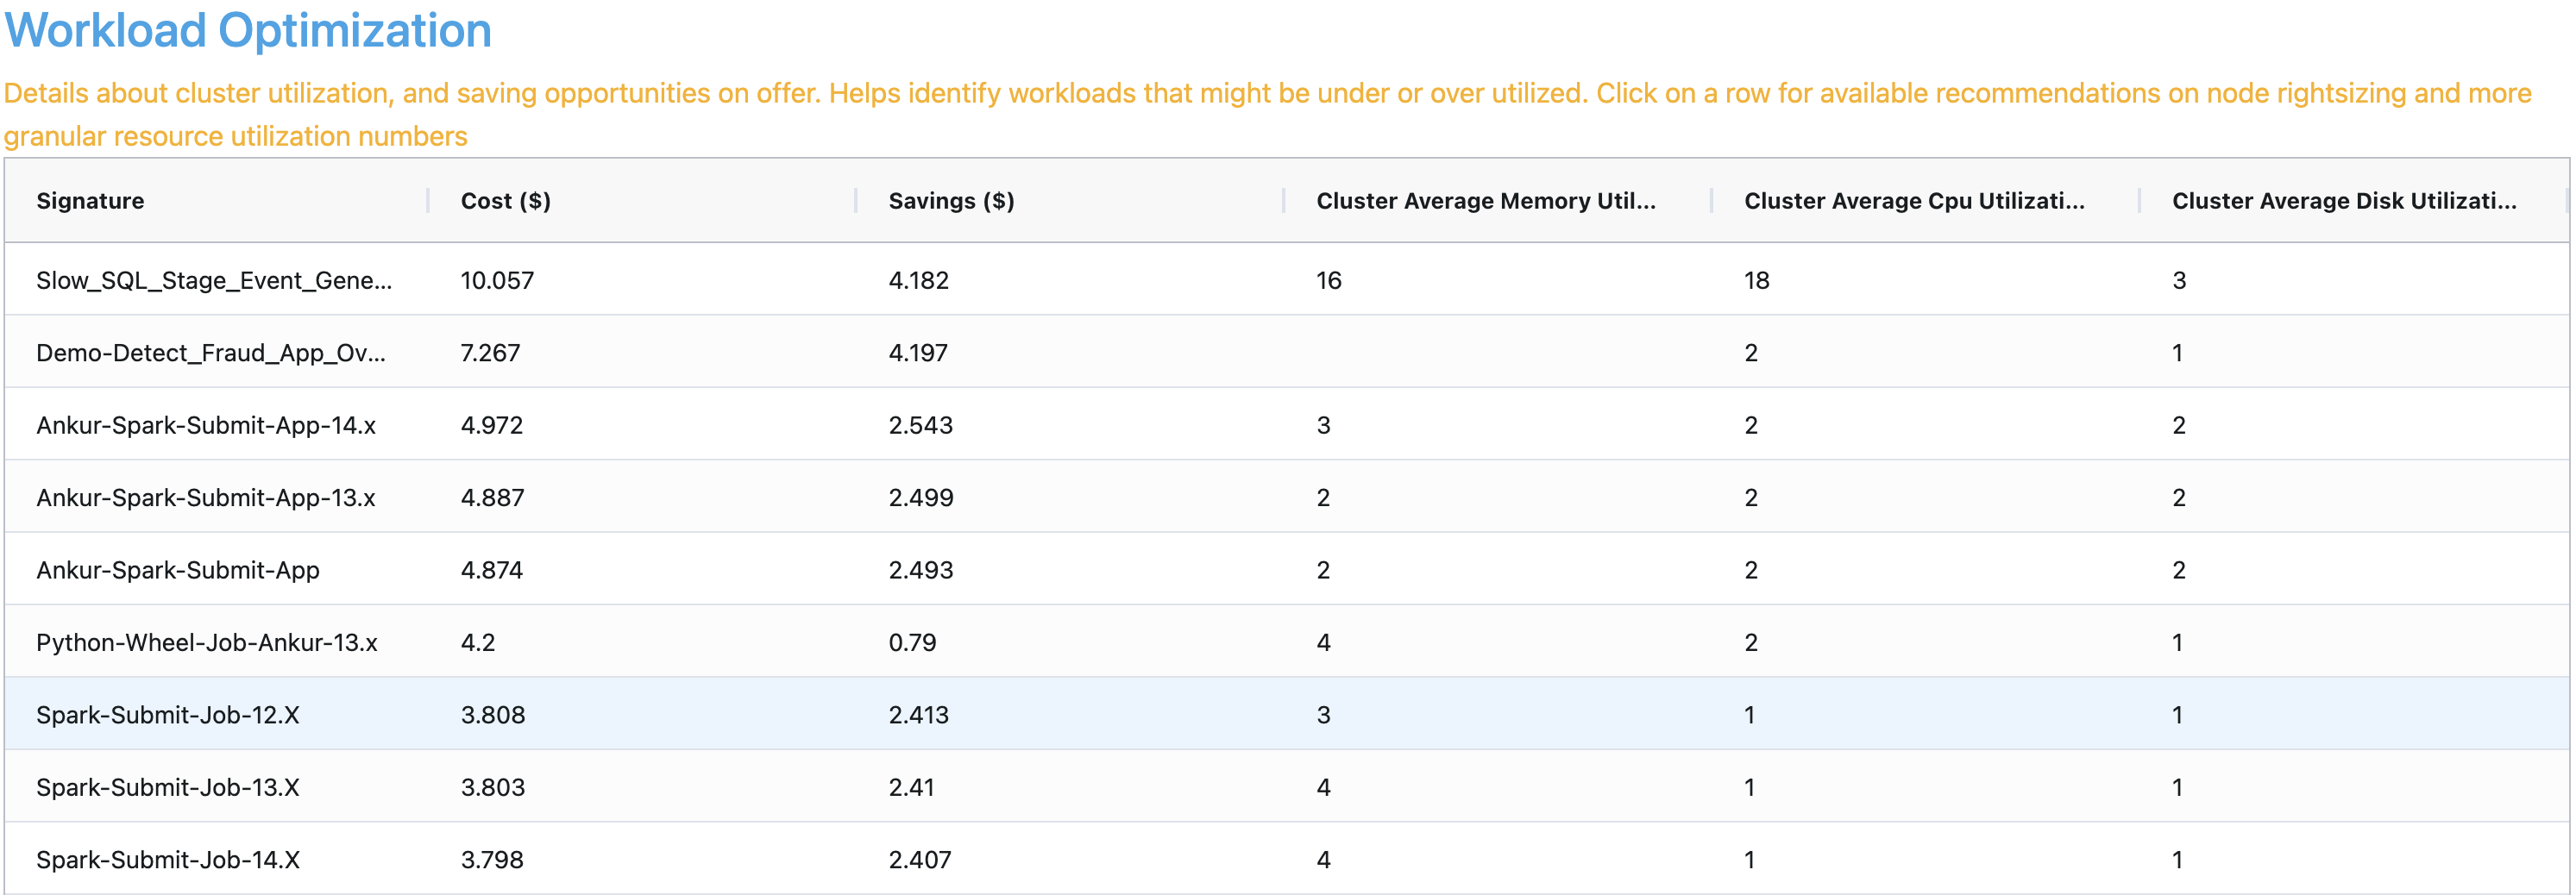
Workload Optimization: View details about cluster utilization and saving opportunities in this tab. You can identify workloads that might be under or over-utilized.
Click the required row for available recommendations on node rightsizing and more granular resource utilization numbers.
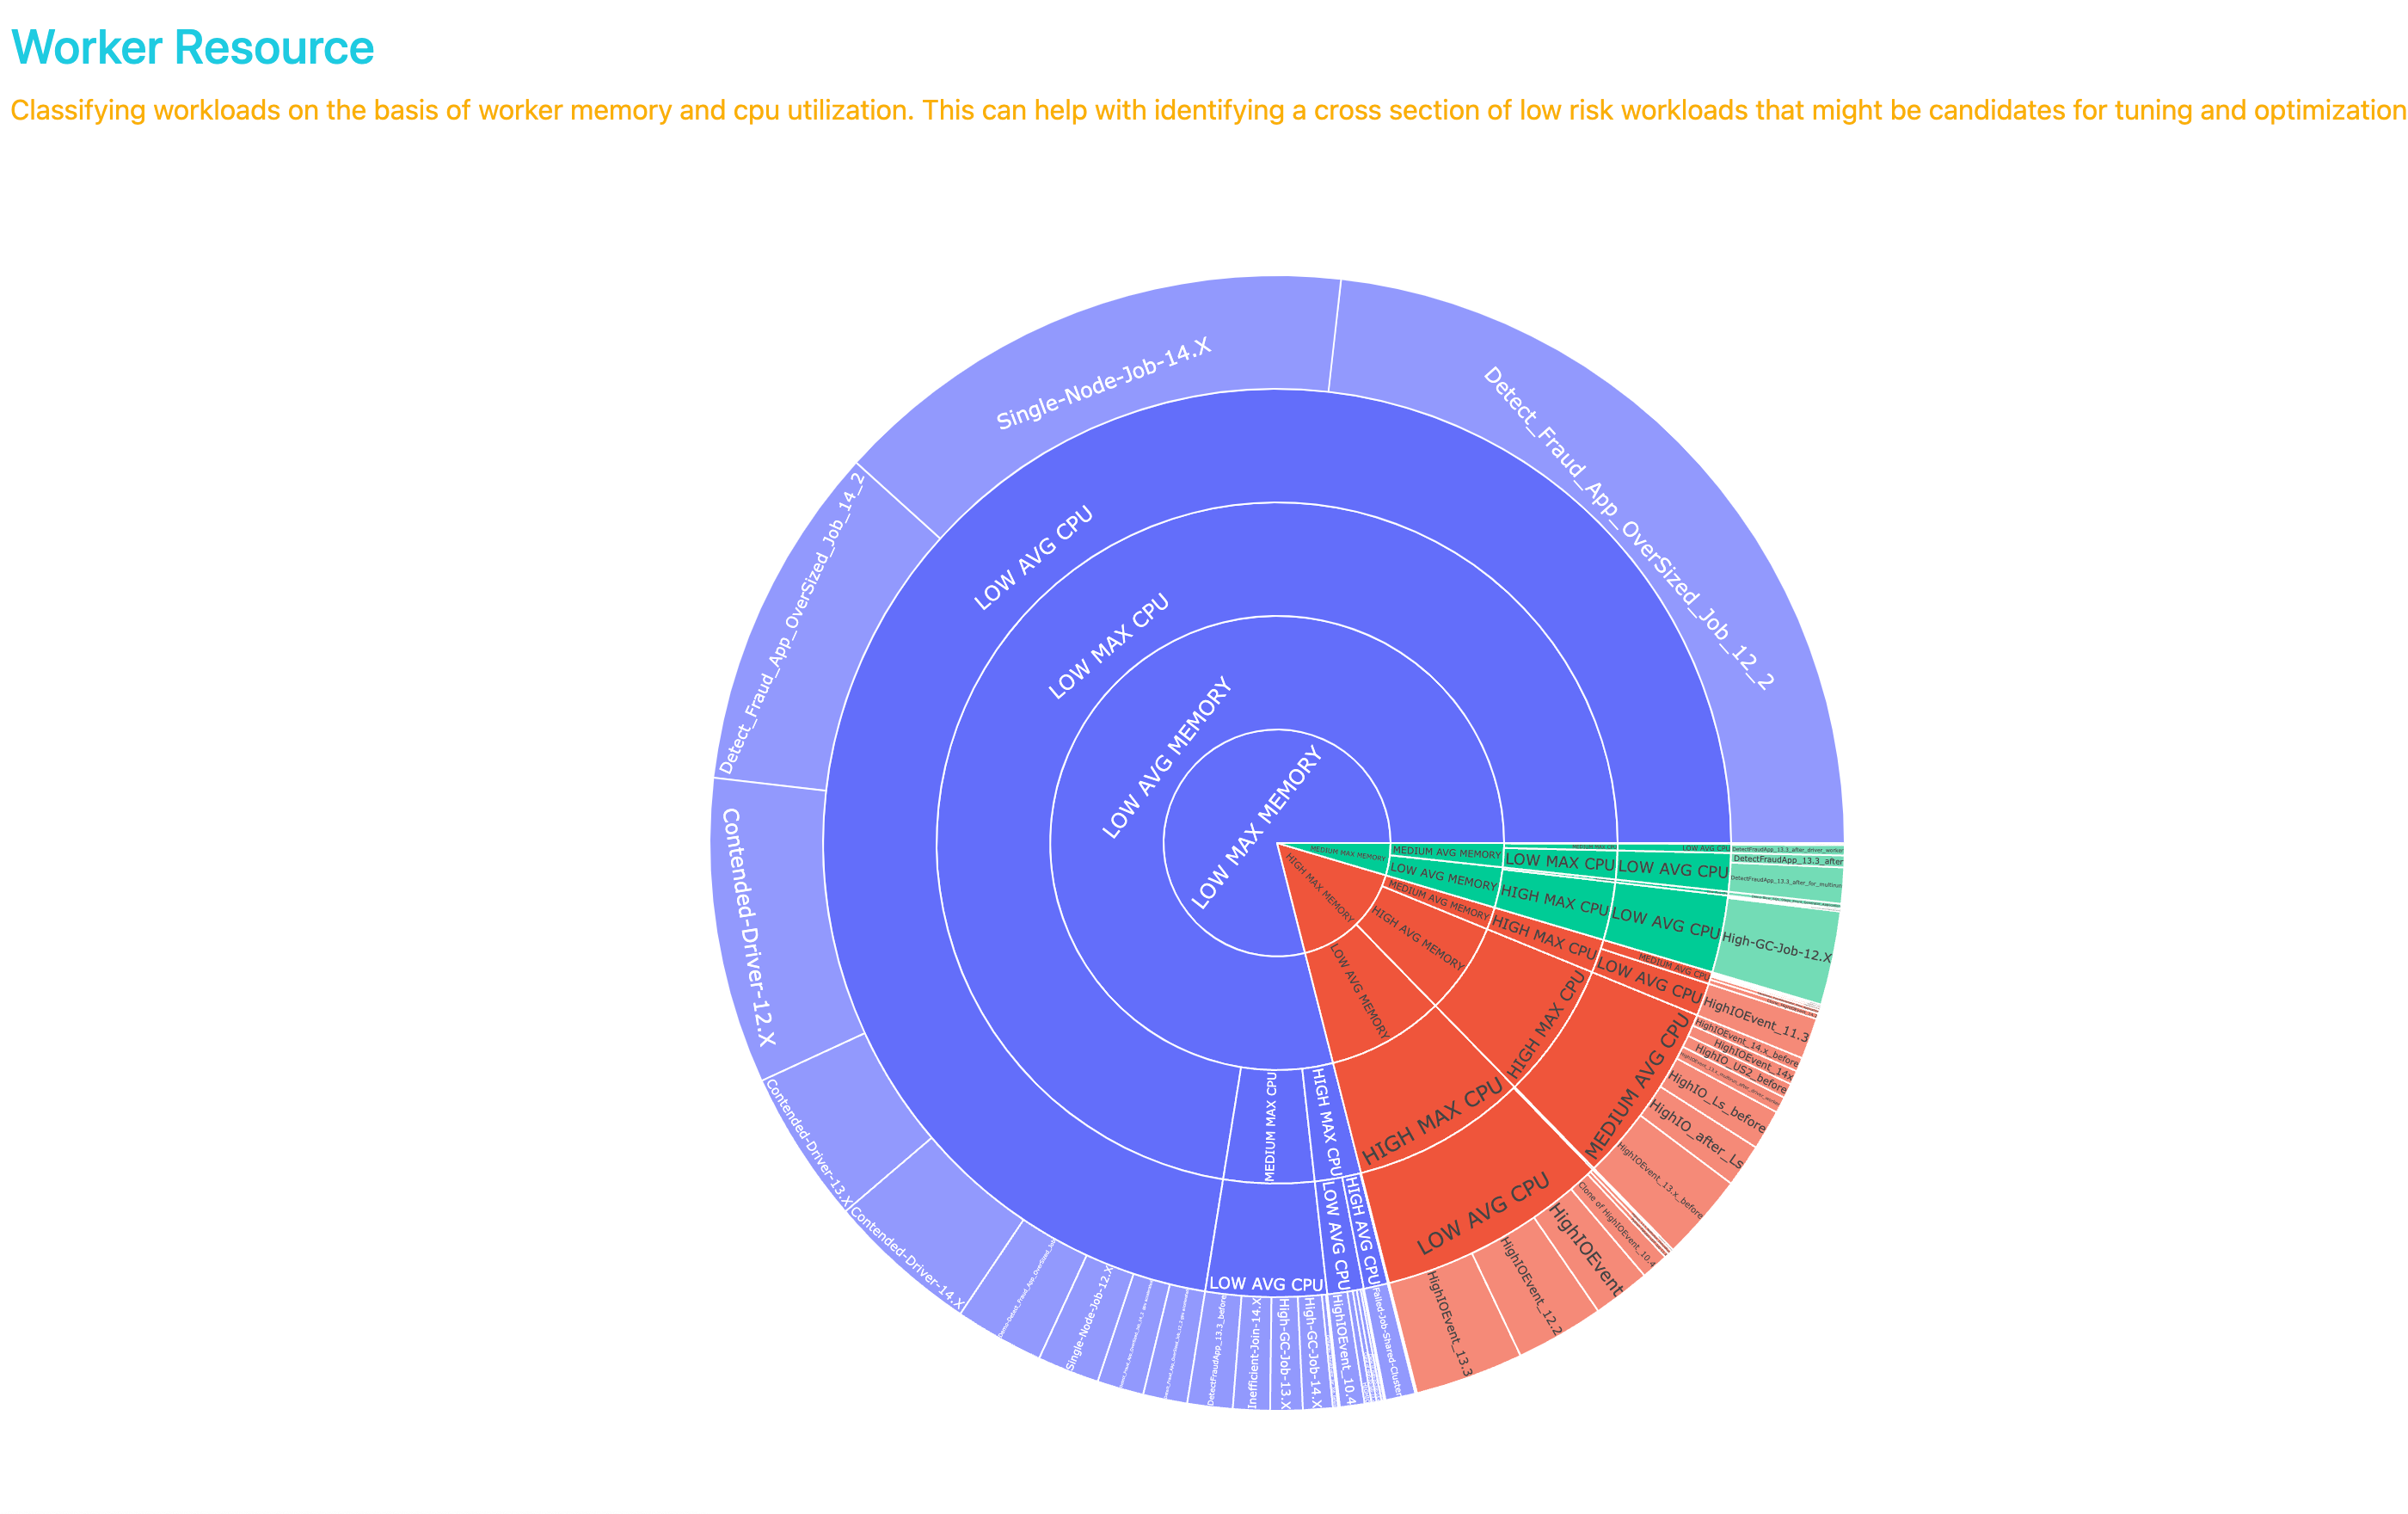
Worker Resource: View the classification of workloads based on worker memory and CPU utilization. This assists in identifying a cross-section of low-risk workloads that could be considered for tuning and optimization.
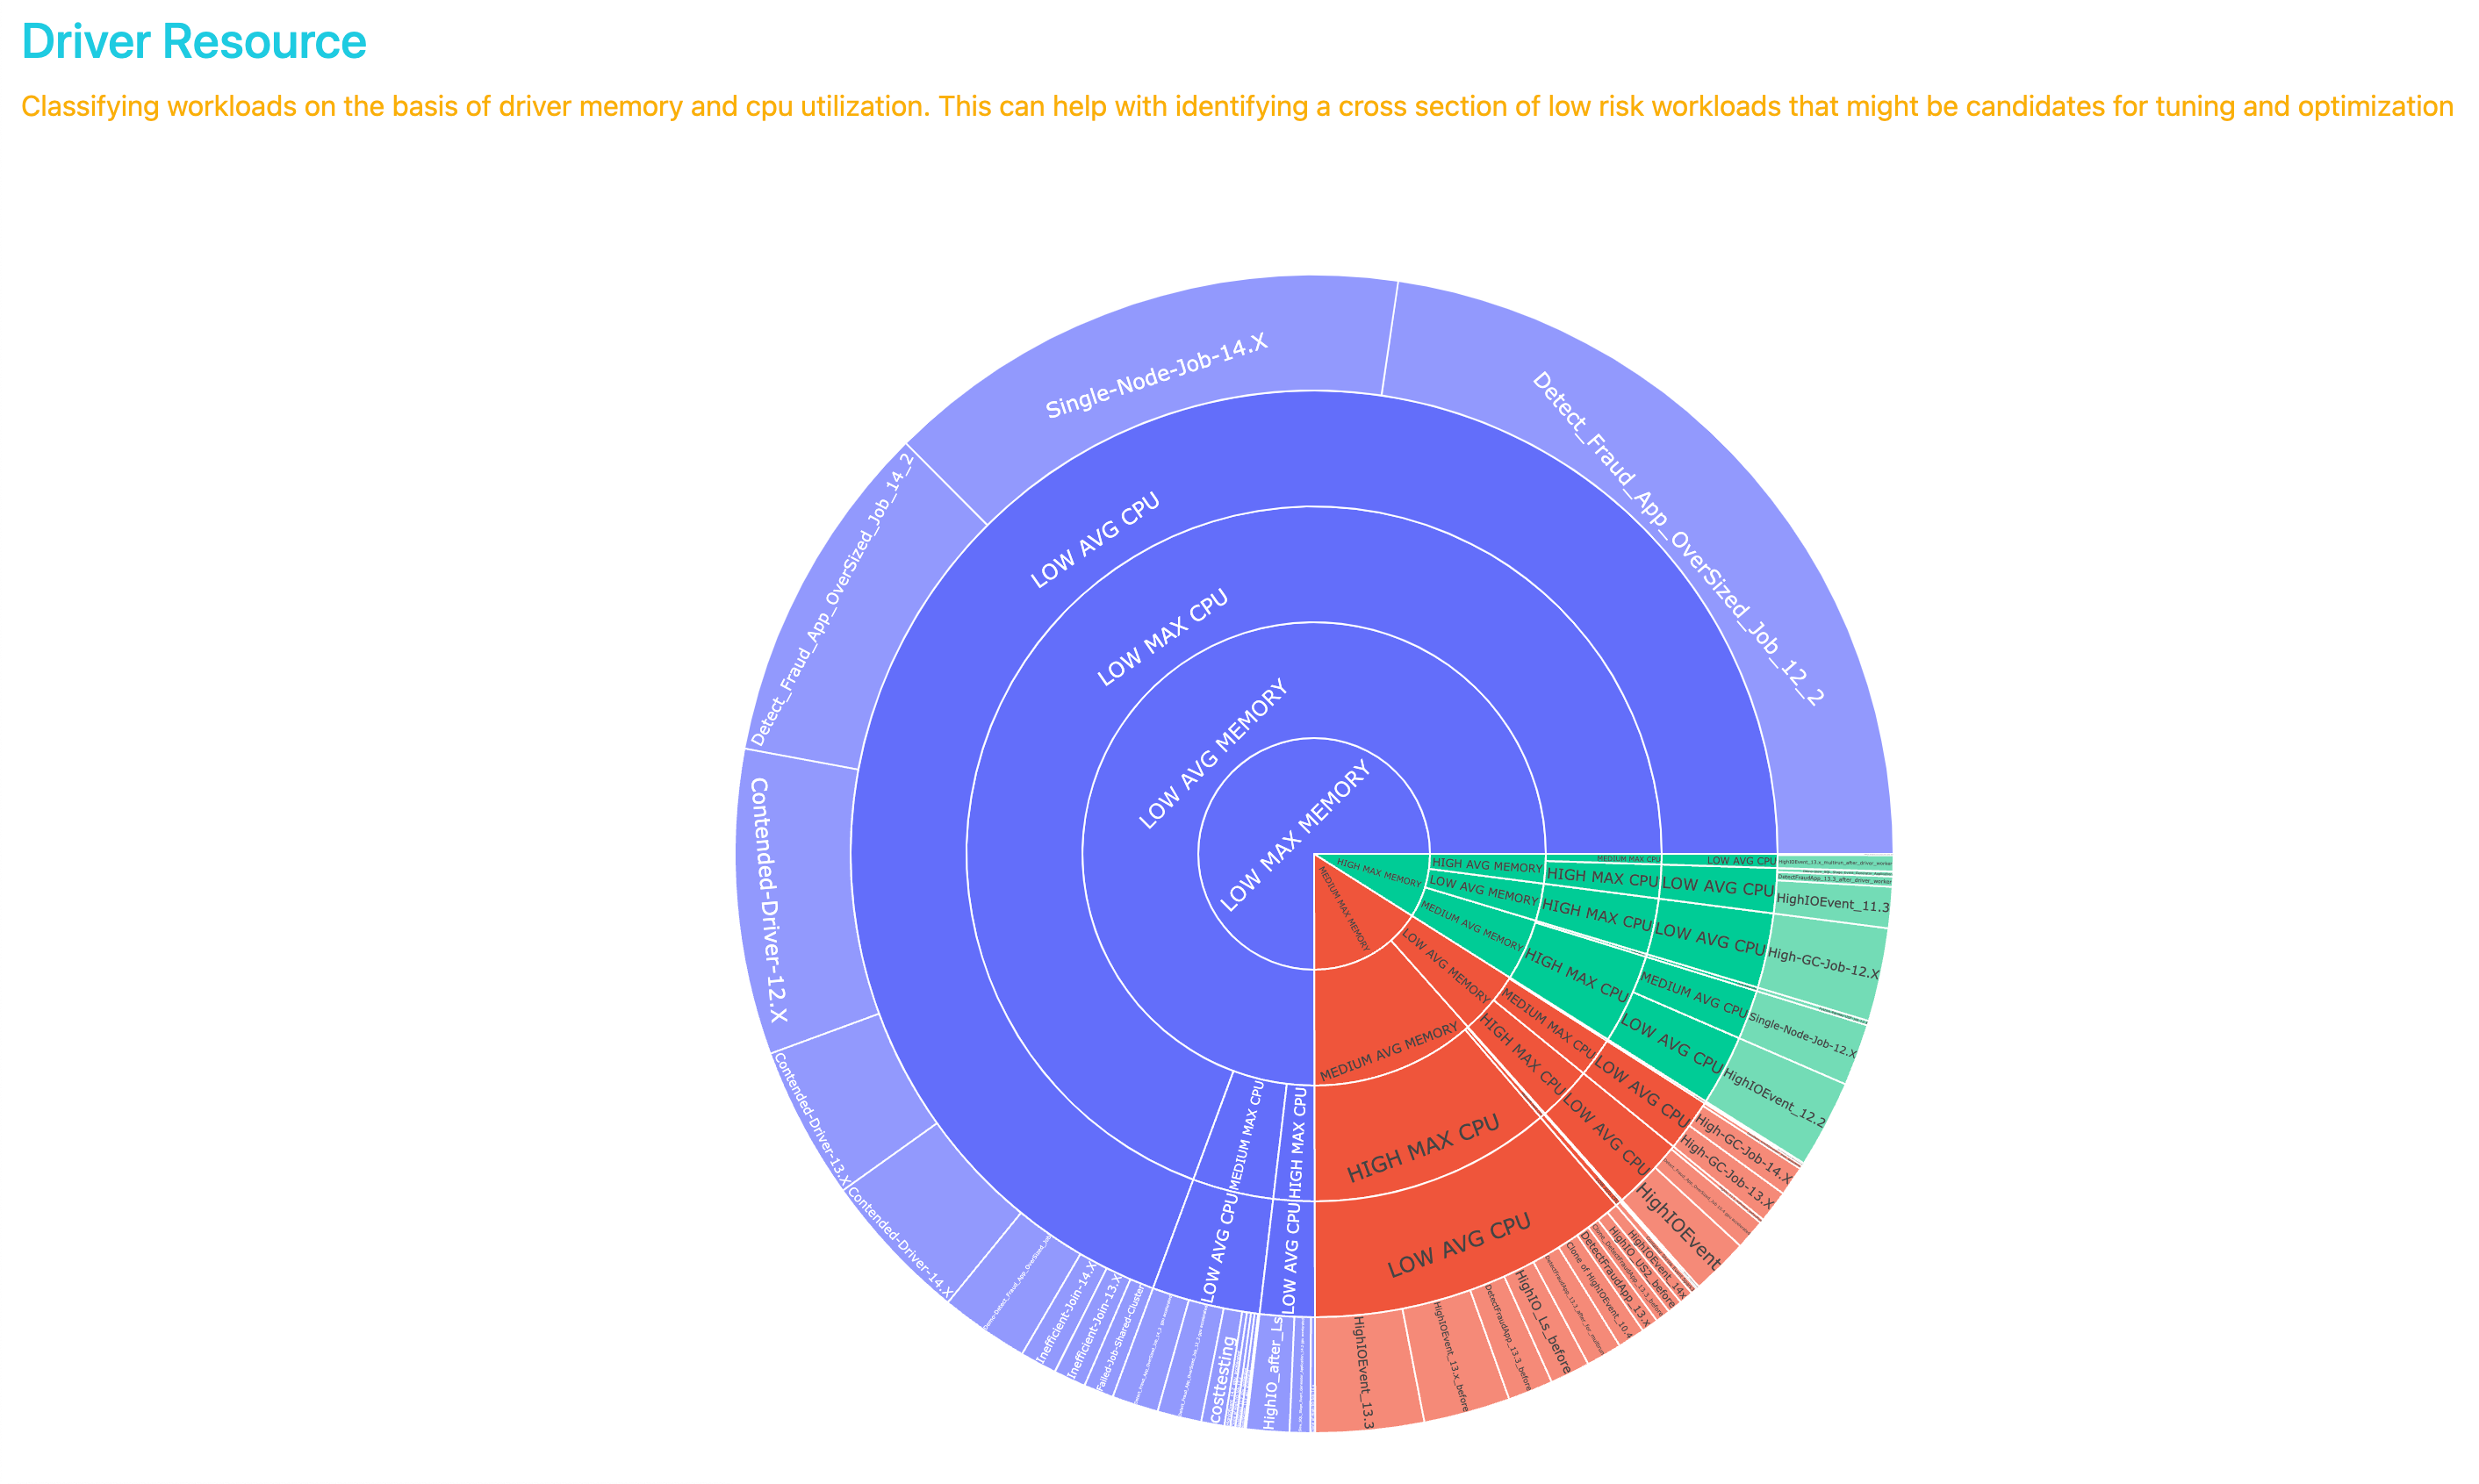
Driver Resource: View the categorization of workloads based on driver memory and CPU utilization. This aids in identifying a range of low-risk workloads that could be potential candidates for tuning and optimization.
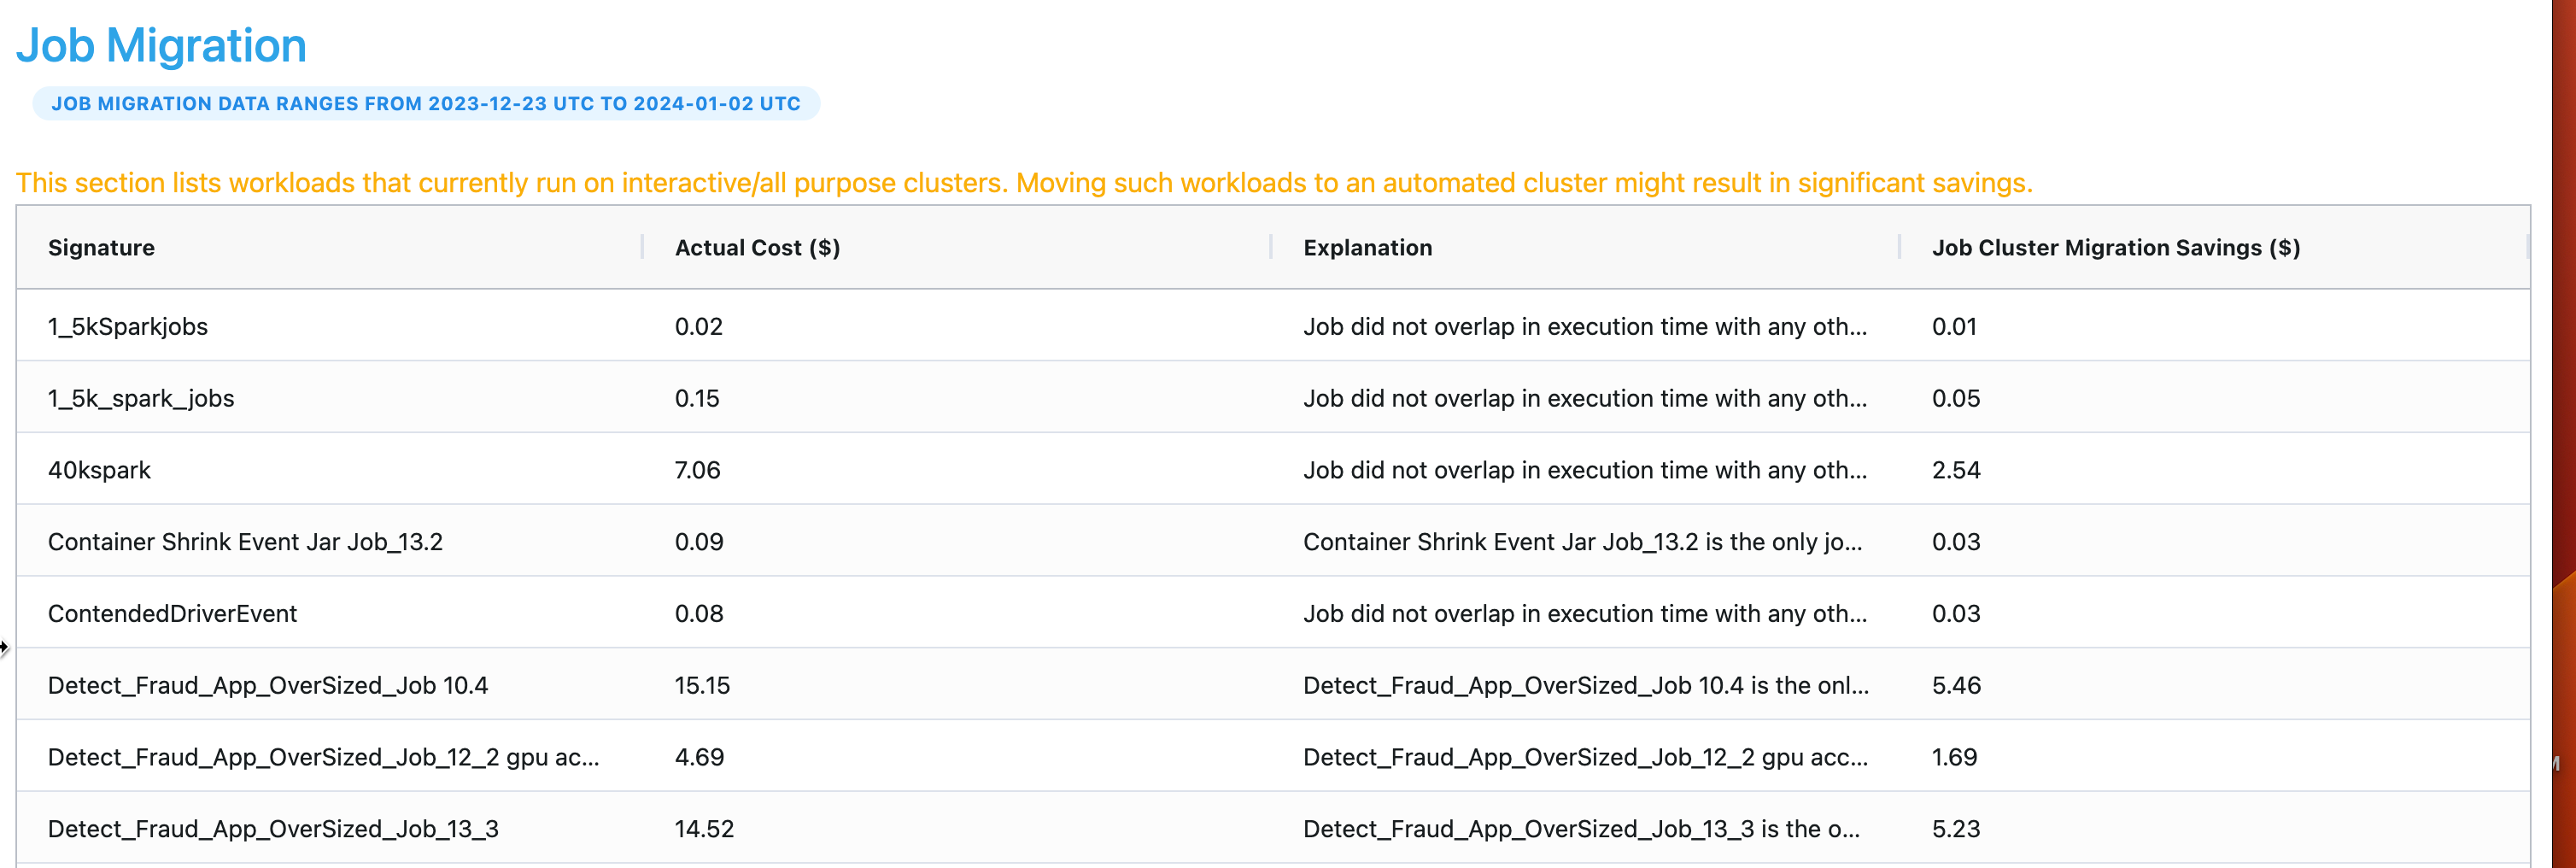
Explore workloads currently operating on interactive/all-purpose clusters in this tab. Transferring these workloads to an automated cluster has the potential to yield significant cost savings.
Analyzing the Interactive clusters
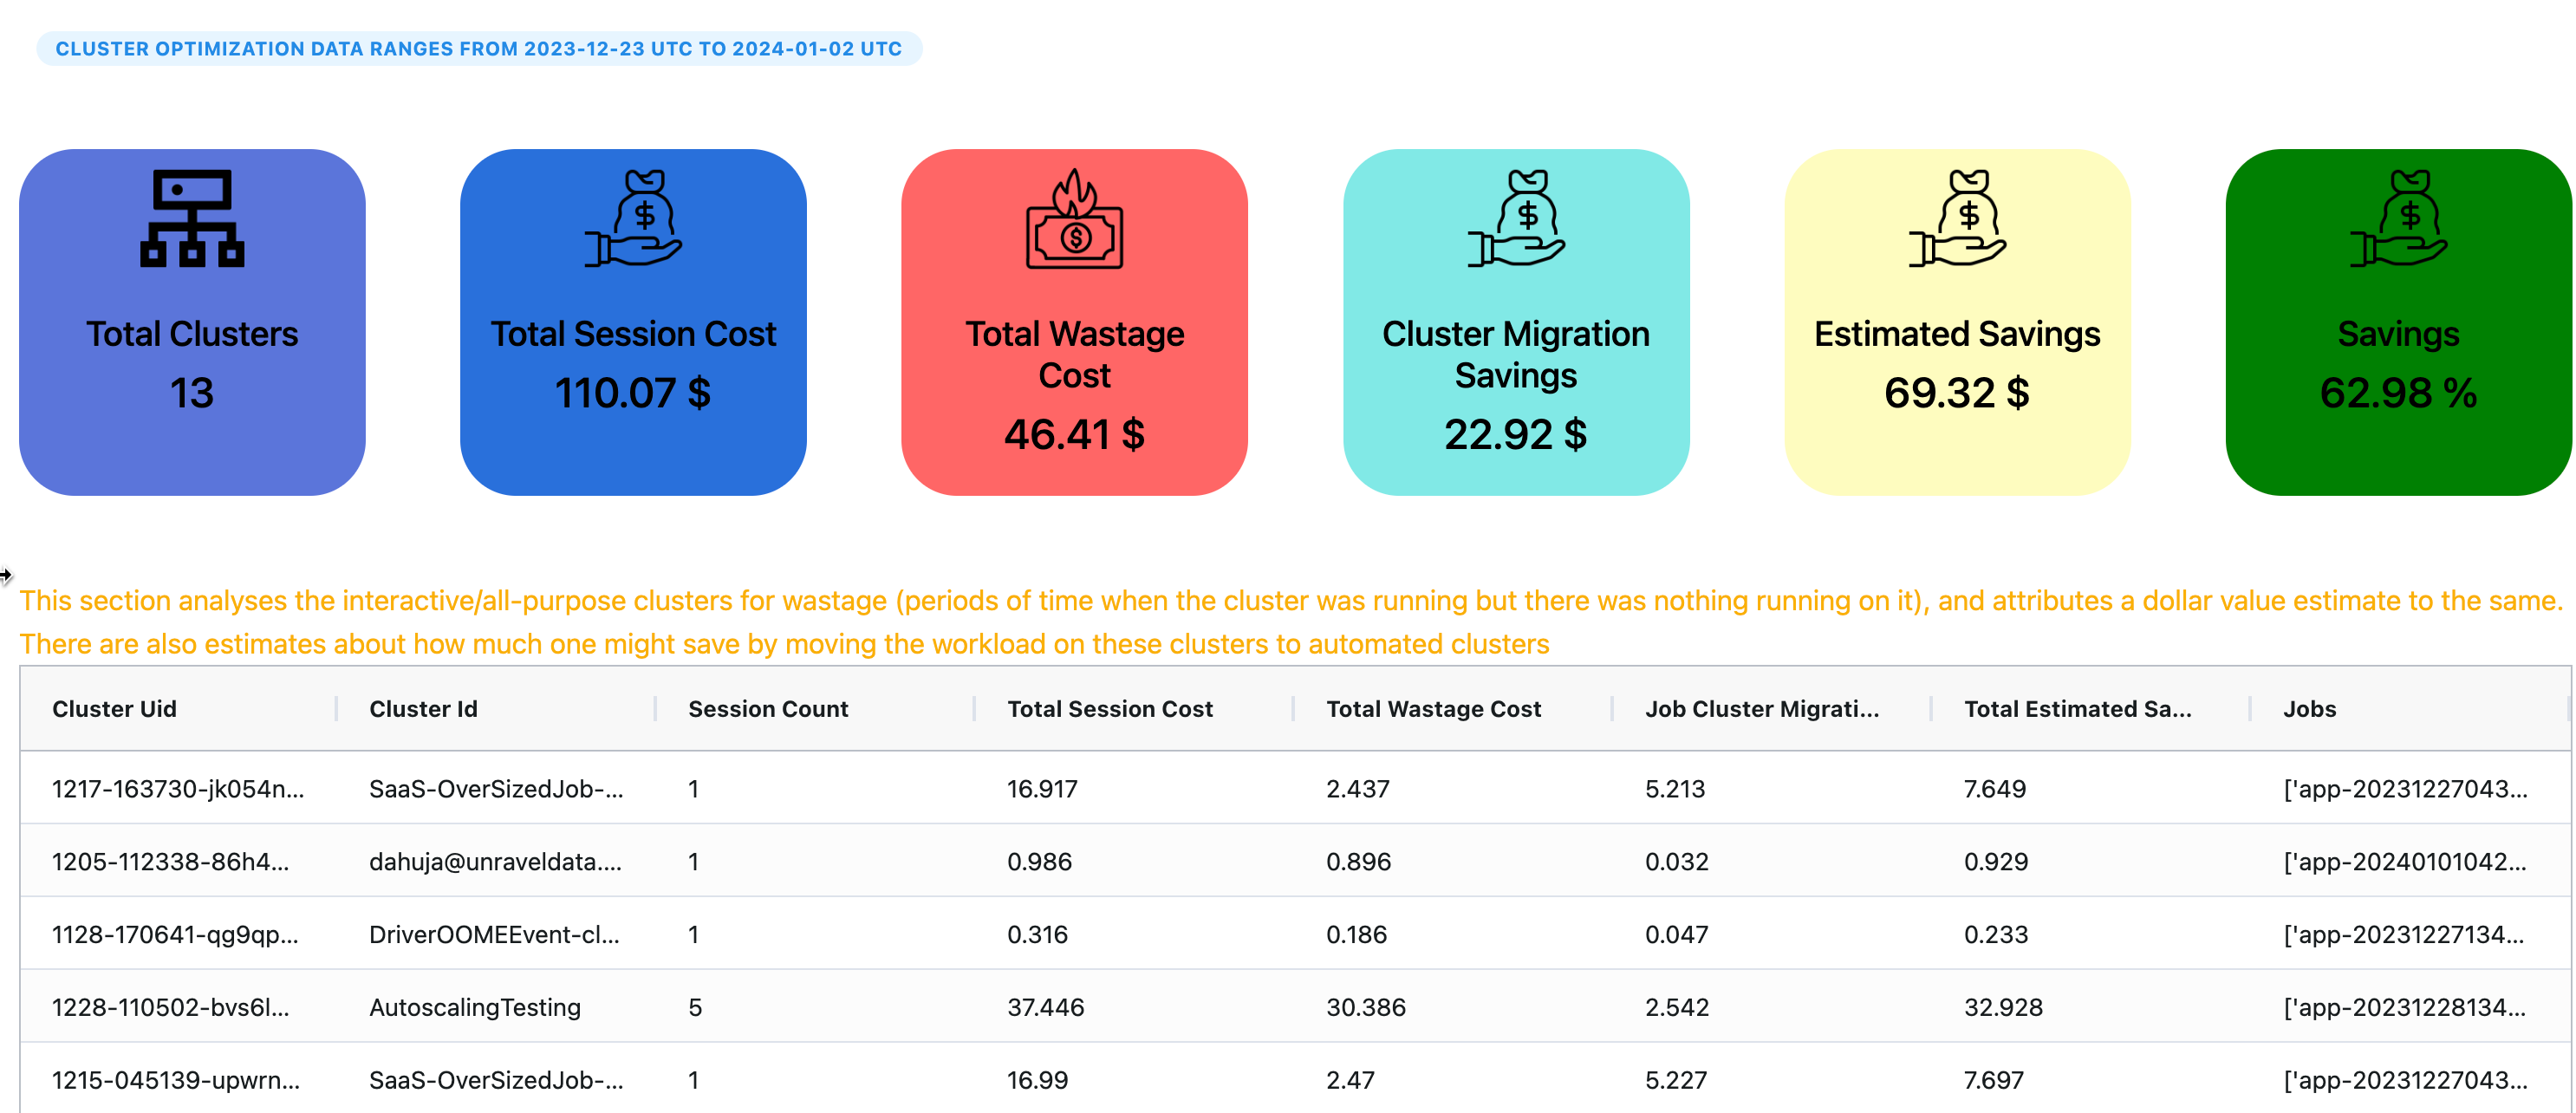
This tab allows you to analyze the interactive/all-purpose clusters for wastage, identify periods when the cluster was active without running processes, and assign a corresponding dollar value estimate. Additionally, find estimates indicating potential savings achievable by transitioning workloads from these clusters to automated alternatives.
Open the Healthcheck ROI app.
Click the Clusters tab. The Clusters page is displayed.
You can view the following information in this tab:
Total Clusters: View the total number of clusters.
Total Session Cost: Analyze total costs associated with cluster sessions.
Total Wastage Cost: Identify costs associated with the wastage periods.
Cluster Migration Savings: Estimate potential savings by migrating workloads to automated clusters.
Estimated Savings: Receive an estimate of potential cost savings.
Savings: Receive an estimate of potential cost savings in percentage.
