Pipeline Comparison report
The Pipeline Comparison report identifies a dataset of baseline and target pipelines and compares KPIs across them. For example, analyzing which pipeline's performance improved or degraded over time. It is used to analyze data where pipelines are used to run applications.
Click Generate Reports > New button.
In the New Report dialog box, enter the following details.
Items
Description
General
Name
Name of the report.
Environment
Select your platform. The reports corresponding to the selected platform are only listed in the Report type. If you select the All option, all the reports are listed.
Report type
Type of report. Select Recommended Workflow Report.
Schedule
Select the checkbox to schedule the report to run daily, hourly, weekly, or monthly. You can also set the schedule can using a cron expression. You can expand the Example drop-down and select the corresponding options. The next four sample run times are displayed for reference.
Retention
The number of days to retain the report files. All the reports are stored in the
unity-one/src/assets/reports/jobsdirectory. After completion of the retention period, the report files are automatically purged.Parameters
Improvement Thresholds
The minimum percentage of performance increment to consider if a pipeline is improved. For example, if the duration of the pipeline is increased by 25% it is considered an improved pipeline.
Duration Threshold
The default value is 25%.
IO threshold
The default value is 5%.
VcoreSeconds threshold
The default value is 5%.
MemorySeconds threshold
The default value is 5%.
Degradation Threshold
The minimum percentage of performance increment to consider if a pipeline is degraded.
Duration threshold
The default value is 25%.
IO threshold
The default value is 5%.
VcoreSeconds threshold
The default value is 5%.
MemorySeconds threshold
The default value is 5%.
Baseline / Target
Specify the following details for the base pipeline and the target pipeline for comparison.
Look Back
The period ranges in days when applications can be selected for report generation for the base pipeline. A notification is displayed above this option that informs about the duration when data is available for the report.
Use Exact Date-Time
Check this option and select the from and to dates to schedule the report for the exact time range specified. The only anomaly with this option is that the same report will be scheduled to be generated repeatedly.
Pipelines
Select the pipeline that you want to be included in the report. You can select multiple pipelines. If none are selected, all pipelines detected will be included in the report.
Notifications
Email to
Email ID to send the notification when the report is generated. You can specify multiple email IDs with comma separation. You can also select the Attach Files to Email checkbox to receive the reports as an attachment.
Advance Options
Profile Memory
Select this option if you want to generate logs that help to troubleshoot scenarios where the report takes excessive time to generate or fails to generate.
Caution
The option will increase the report run time excessively.
Click OK. The generated reports will be listed under Reports on the App UI.
Select the generated report and then click Run. After the report is successfully run, the details of the report runs are listed in the Run box on the right.
Click the following:
HTML files link to view the report details.
Input parameters link to view the parameters you chose to run the report.
Log file link to view the logs of the report.
The following reports are generated:
Pipeline Comparison Detailed report
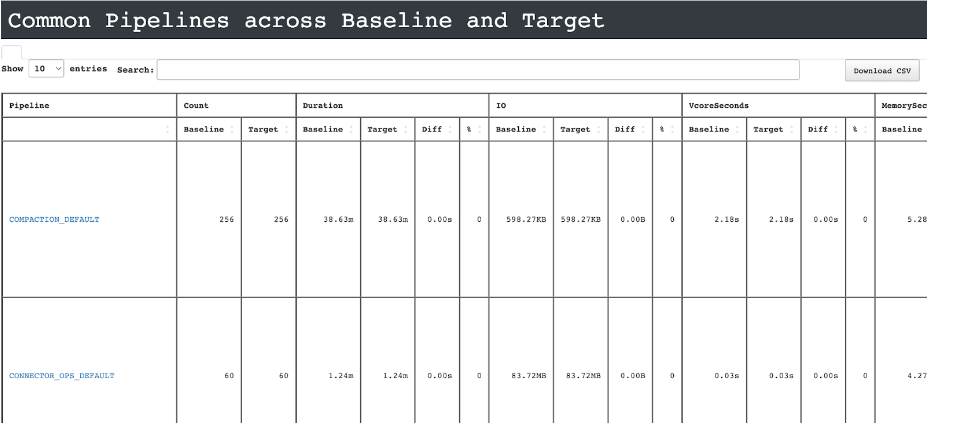
Contains the pipeline’s resource utilization and other information. It is divided into the following sections:
Common pipelines across baseline and target
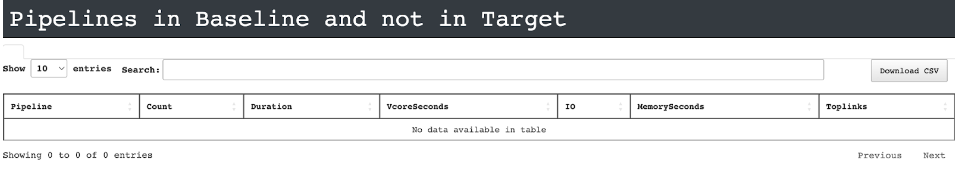
Pipelines in baseline and not in target
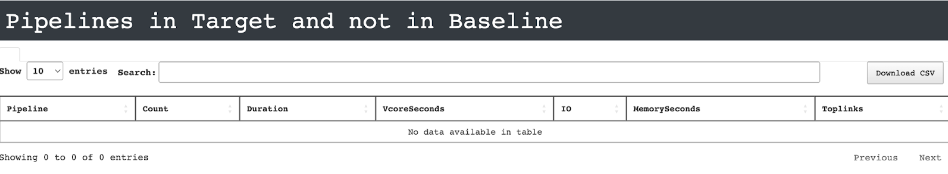
Pipelines in target and not in baseline
Pipeline Comparison Summary report
The report is divided into the following sections:
Insights - contains a sunburst chart depicting Improved, Degraded, and Acceptable pipelines.
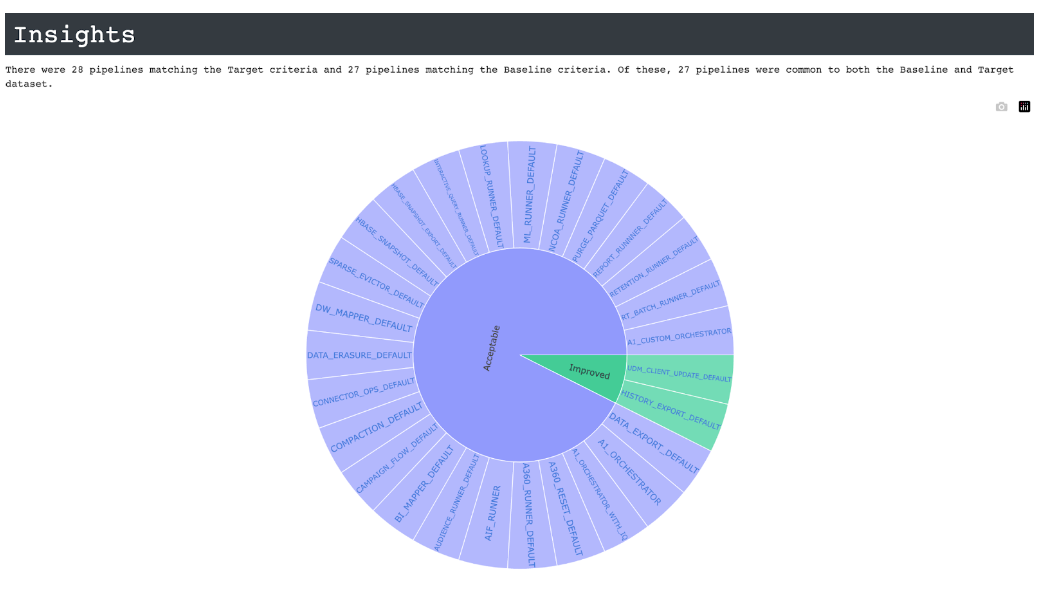
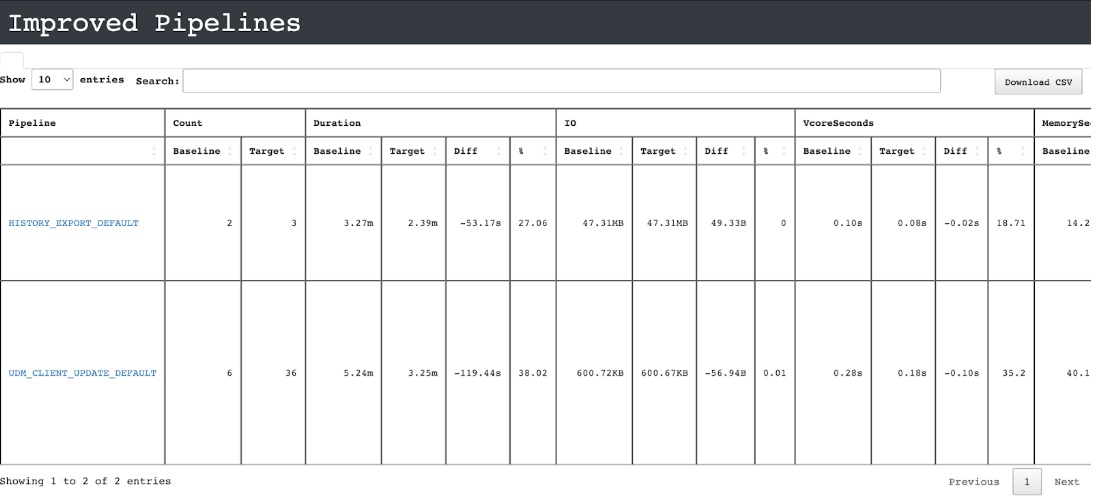
Improved Pipelines - A table of all the improved pipelines with the respective KPIs aggregated across all runs of the pipeline
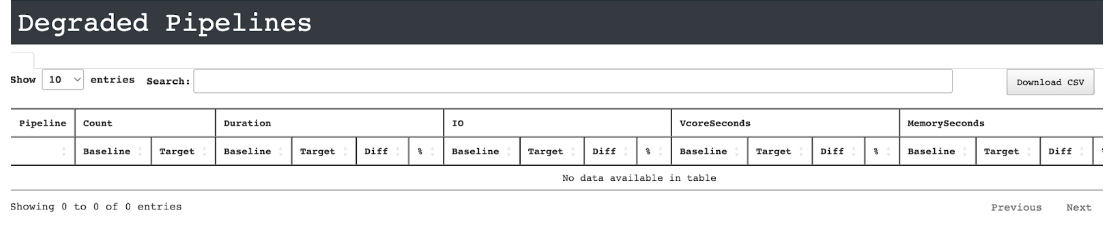
Degraded pipelines - table of all the degraded pipelines
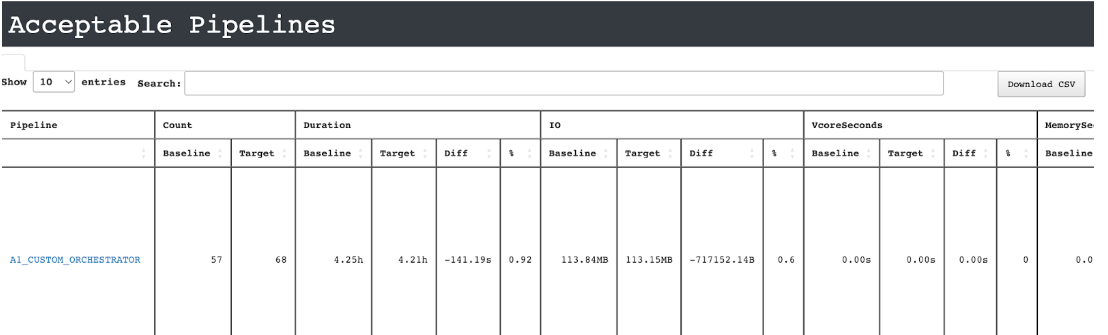
Acceptable pipelines - table of all the pipelines that are neither improved nor degraded.
Viewing metrics and insights
Open the report and click any app link from the Signature column.
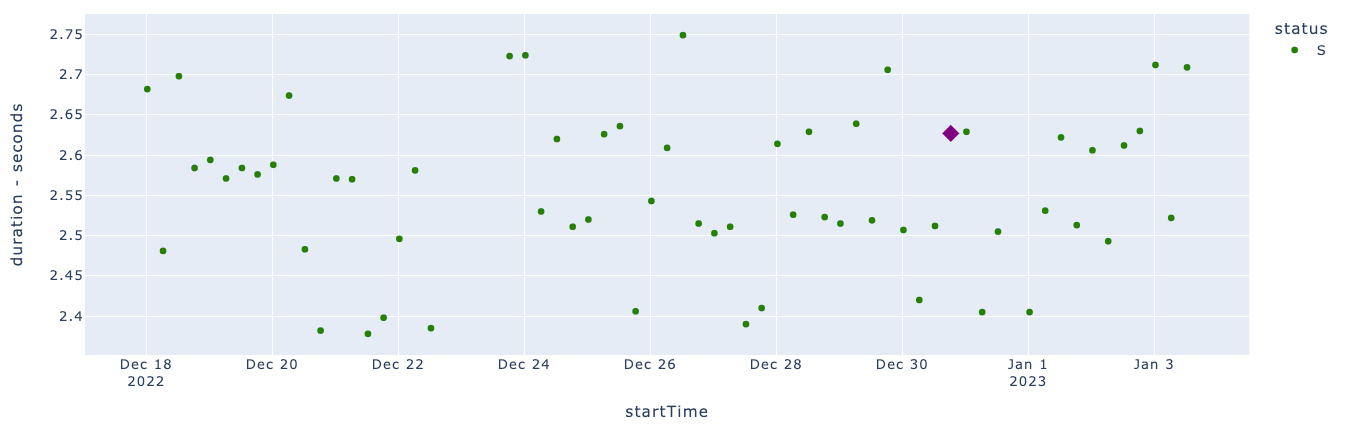
The Metrics tab displays the trend charts for the Duration, IO, MemorySeconds, and CPU metrics. The dots plotted on the trend charts are the app runs. The app info is provided in the right panel.
You can select any of the following features to view the metric trends:
status
cluster id
cluster UID
Click any dot on any of the Metric trend charts. This becomes the app target run. The details of the app target run appear in the App Run info panel on the right.
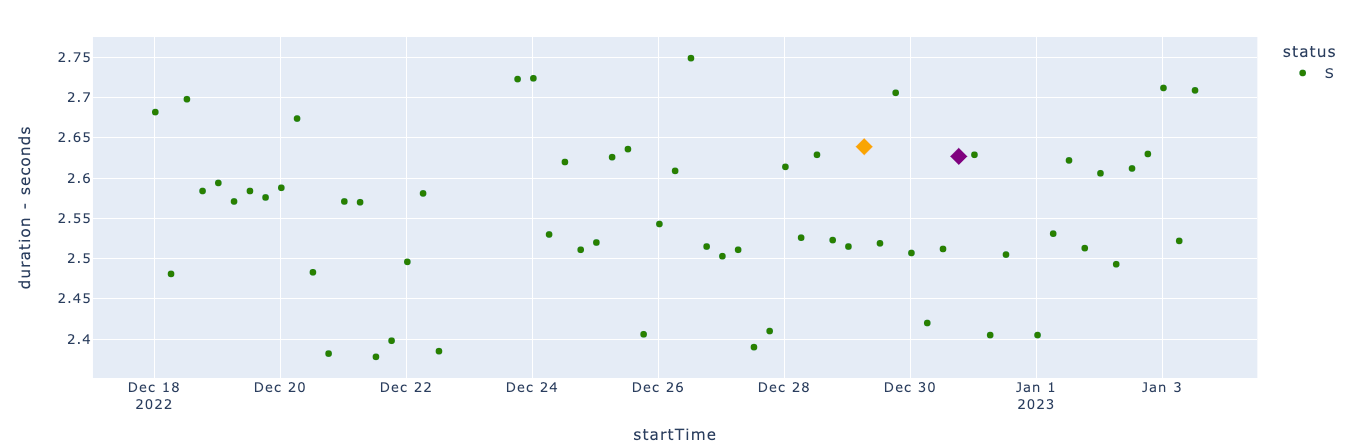
In the App Run info panel, click the ID link. This is the ID link of the app target run. The Metric tab is shown with the app target run you have chosen in a different color. The details of the app target run are displayed in the App Target Run panel on the right. Click the View in Unravel link to view the app's details in Unravel.
Select any dot (other than the dot for the app target run) on any of the Metric trend charts. This becomes the app baseline run. This is highlighted in a different color. The details of the app target run are displayed in the App Baseline Run panel on the right. Click the View in Unravel link to view the app's details in Unravel.
In the App Baseline Run panel, click Compare.
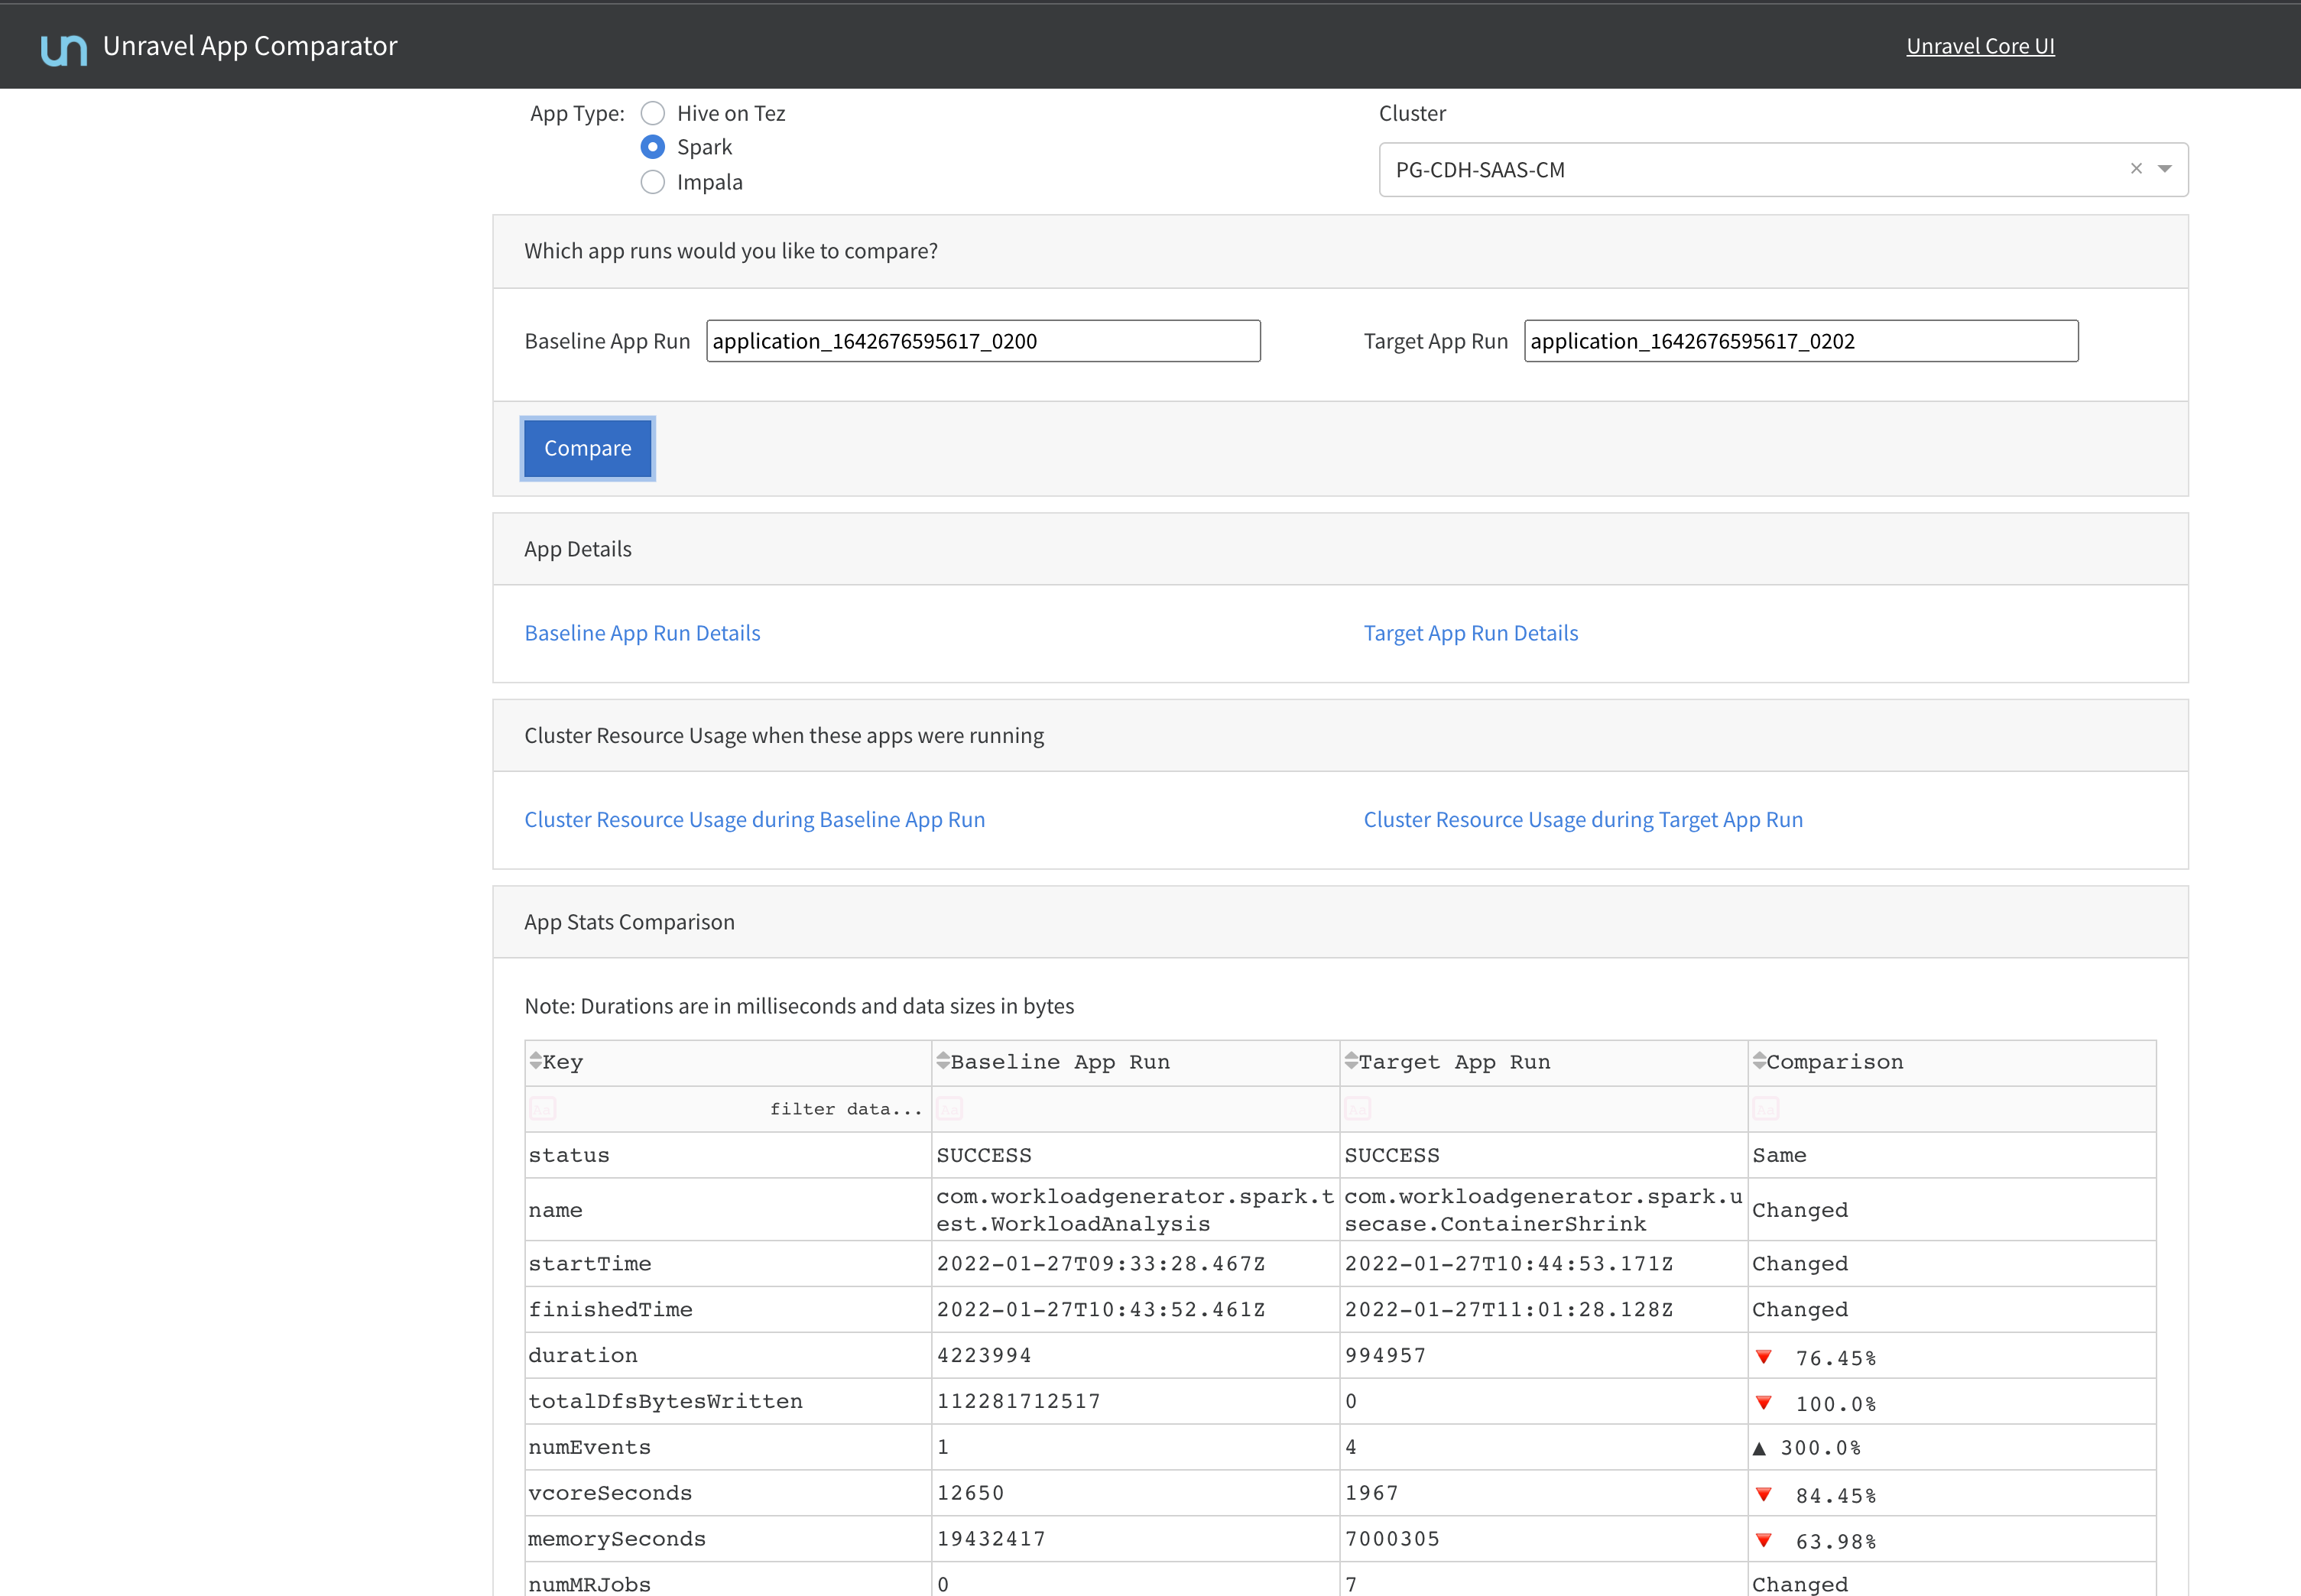
Select an app from the App Type options:
Hive on Tez
Spark
Impala
From the Cluster, select a cluster.
Specify the app runs that you want to compare.
Baseline App Run: Specify the ID of the baseline app.
Target App Run: Specify the ID of the target app with which you want to compare the baseline app.
Click Compare. The following app details are given for the baseline and target app run:
App details
Cluster resource usage when these apps were running
App statistics comparison details
App config comparison details
Query string comparison details
Query plan comparison details
In the App Baseline Run panel, click Refresh Insights. The insights are provided in the following sections.
Baseline comparison
The results of the comparison are displayed.
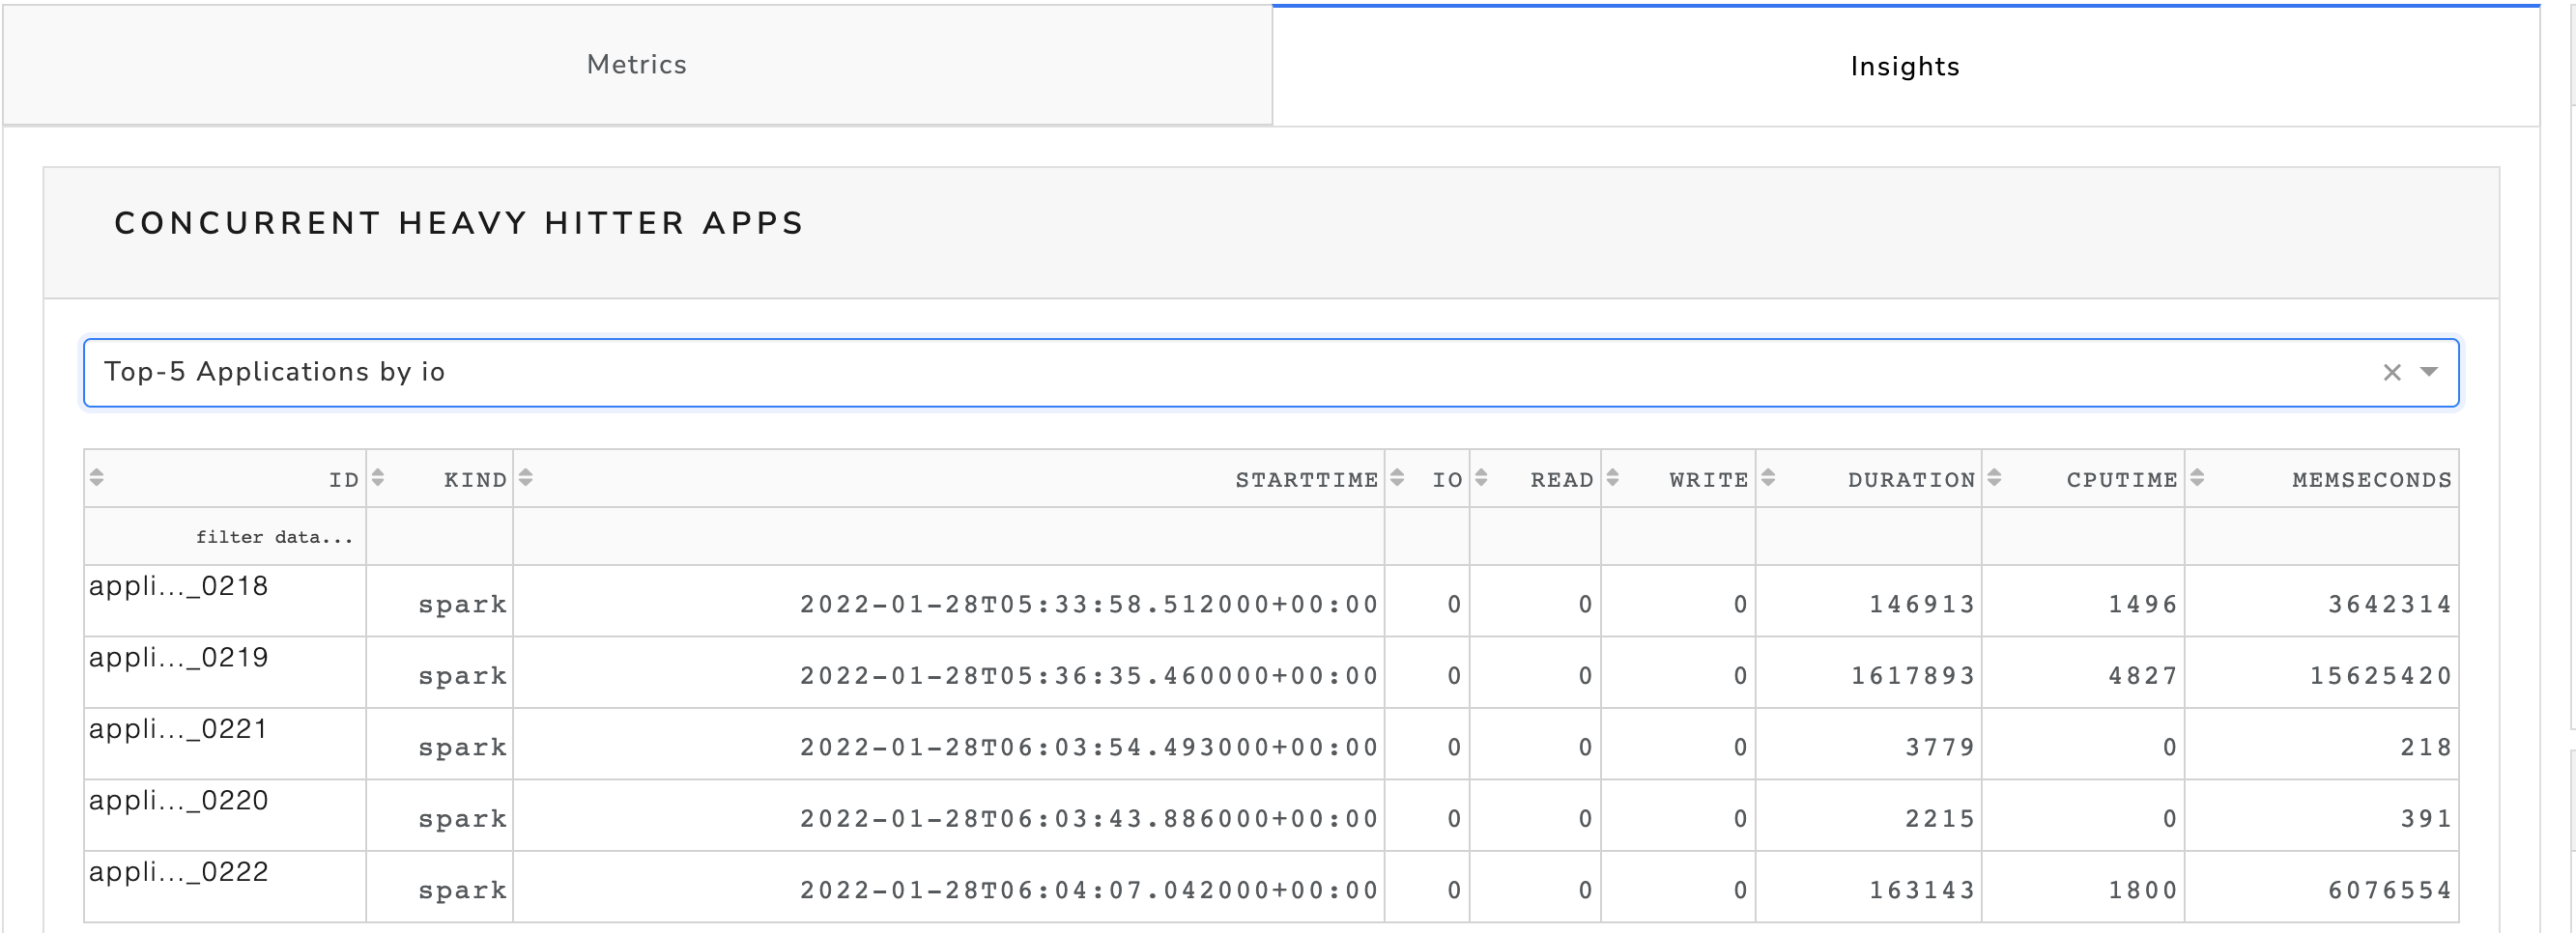
Concurrent heavy hitter apps
This section will show up only when the information is available.
Select this option to view the top five applications in a specific category.
Click the Concurrent heavy hitter apps option.
Select any option from the Top-5 Applications option.
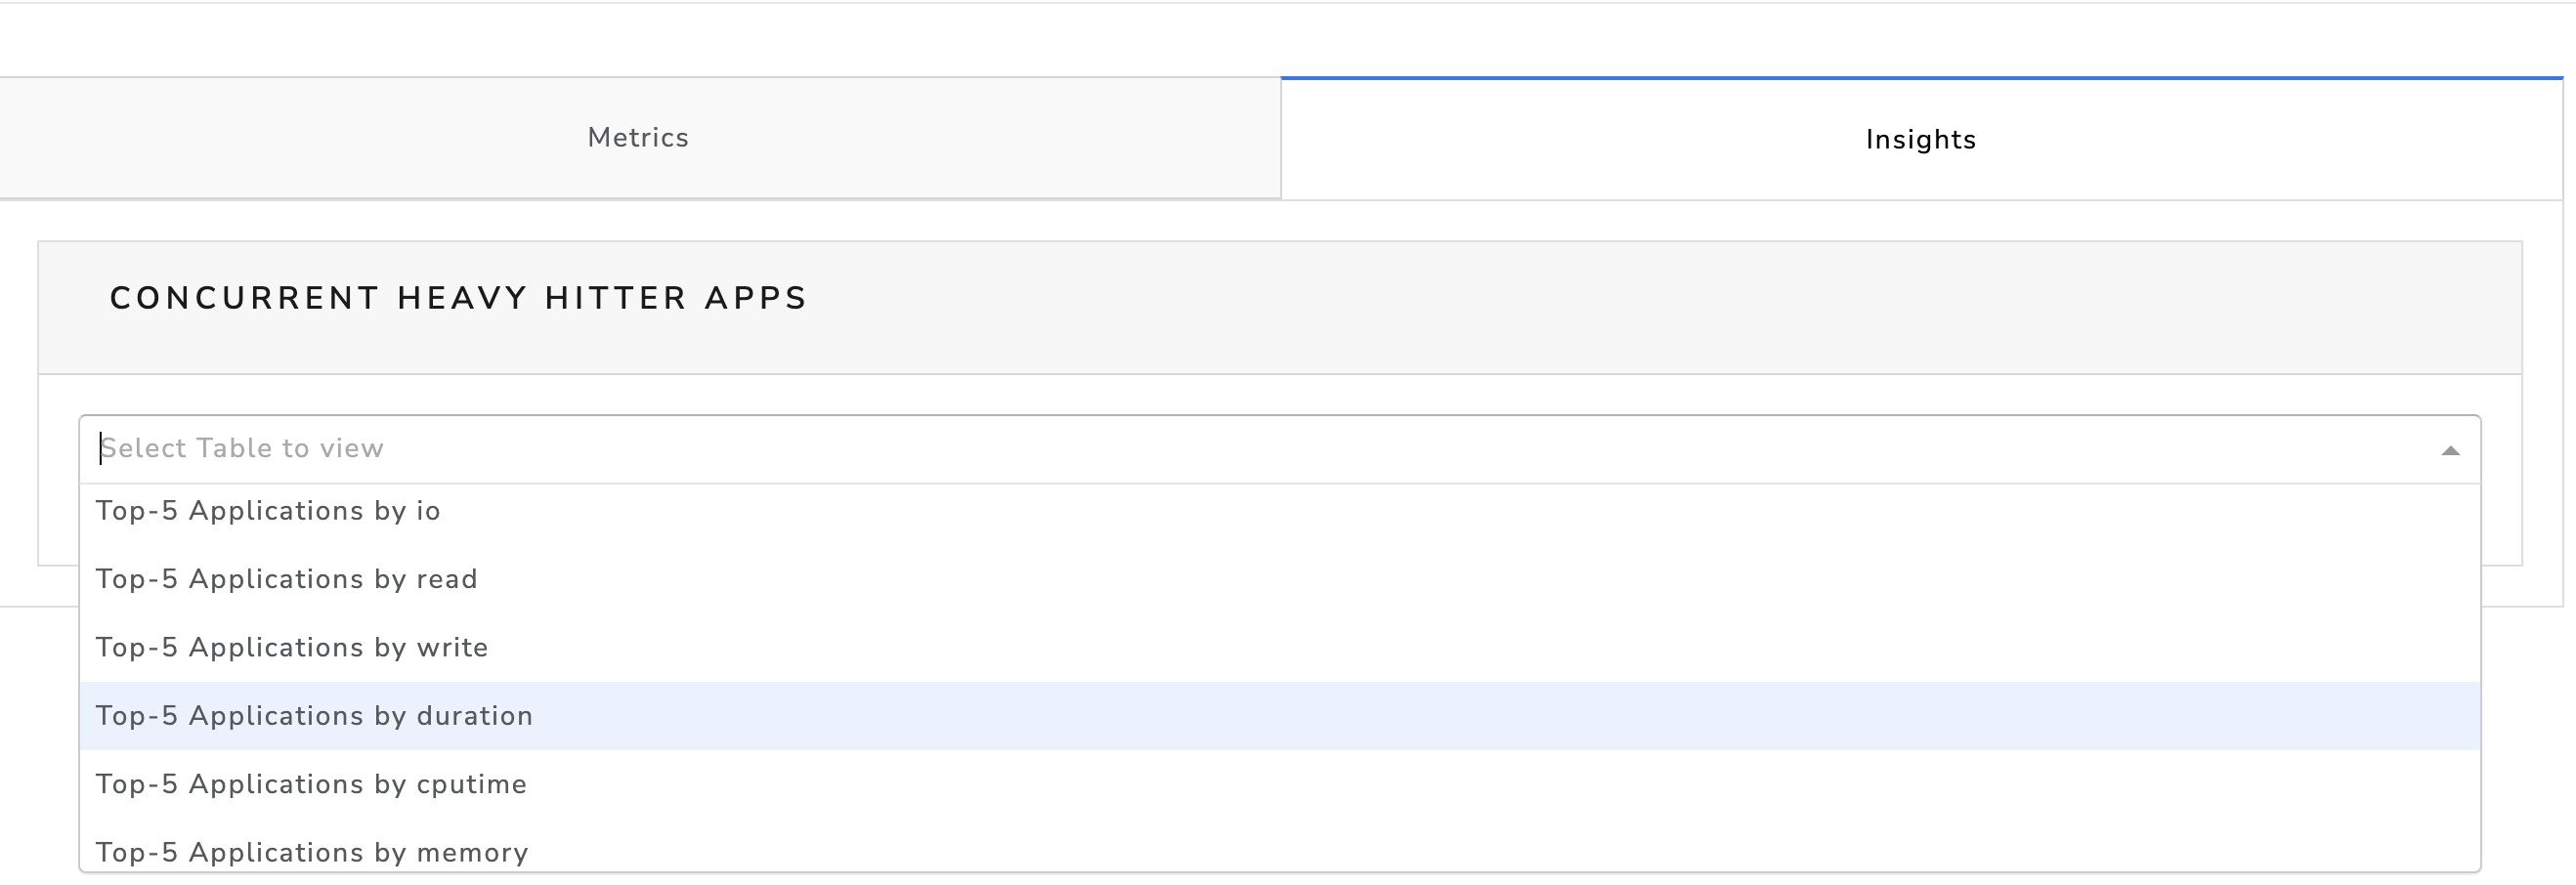
The corresponding details are displayed.