Virtual Warehouses
The Virtual Warehouse costs section summarizes your virtual warehouse expenses in Snowflake.
Note
Serverless feature costs managed globally, are not covered in this section.
This section allows you to:
Identify costly warehouses
Optimize resource allocation by gaining insights into how compute and cloud service costs are attributed to the virtual warehouses.
Monitor cost trends for your virtual warehouses and identify cost fluctuations over time.
Detect cost anomalies by helping you identify inefficiencies of potential issues with the virtual warehouses.
From the Unravel UI, click Cost > Cost 360.
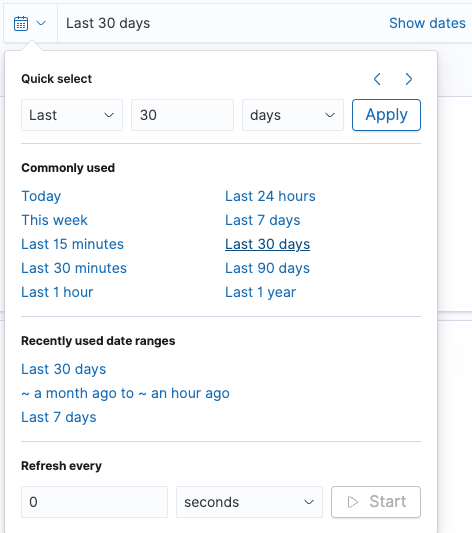
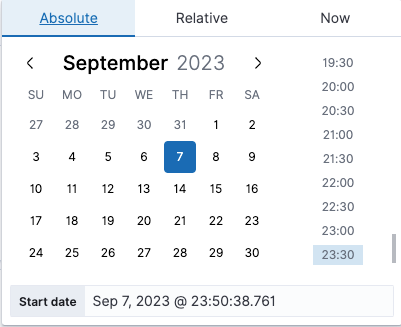
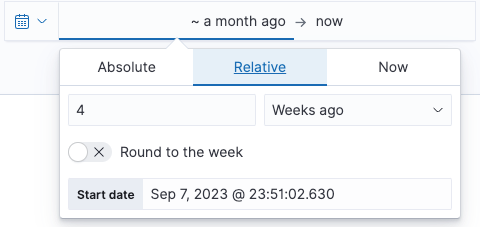
Filter the data using the date range or fields.
Scroll down to view the Virtual Warehouses Costs. You can identify the most expensive warehouses from the Most Expensive Warehouses table.
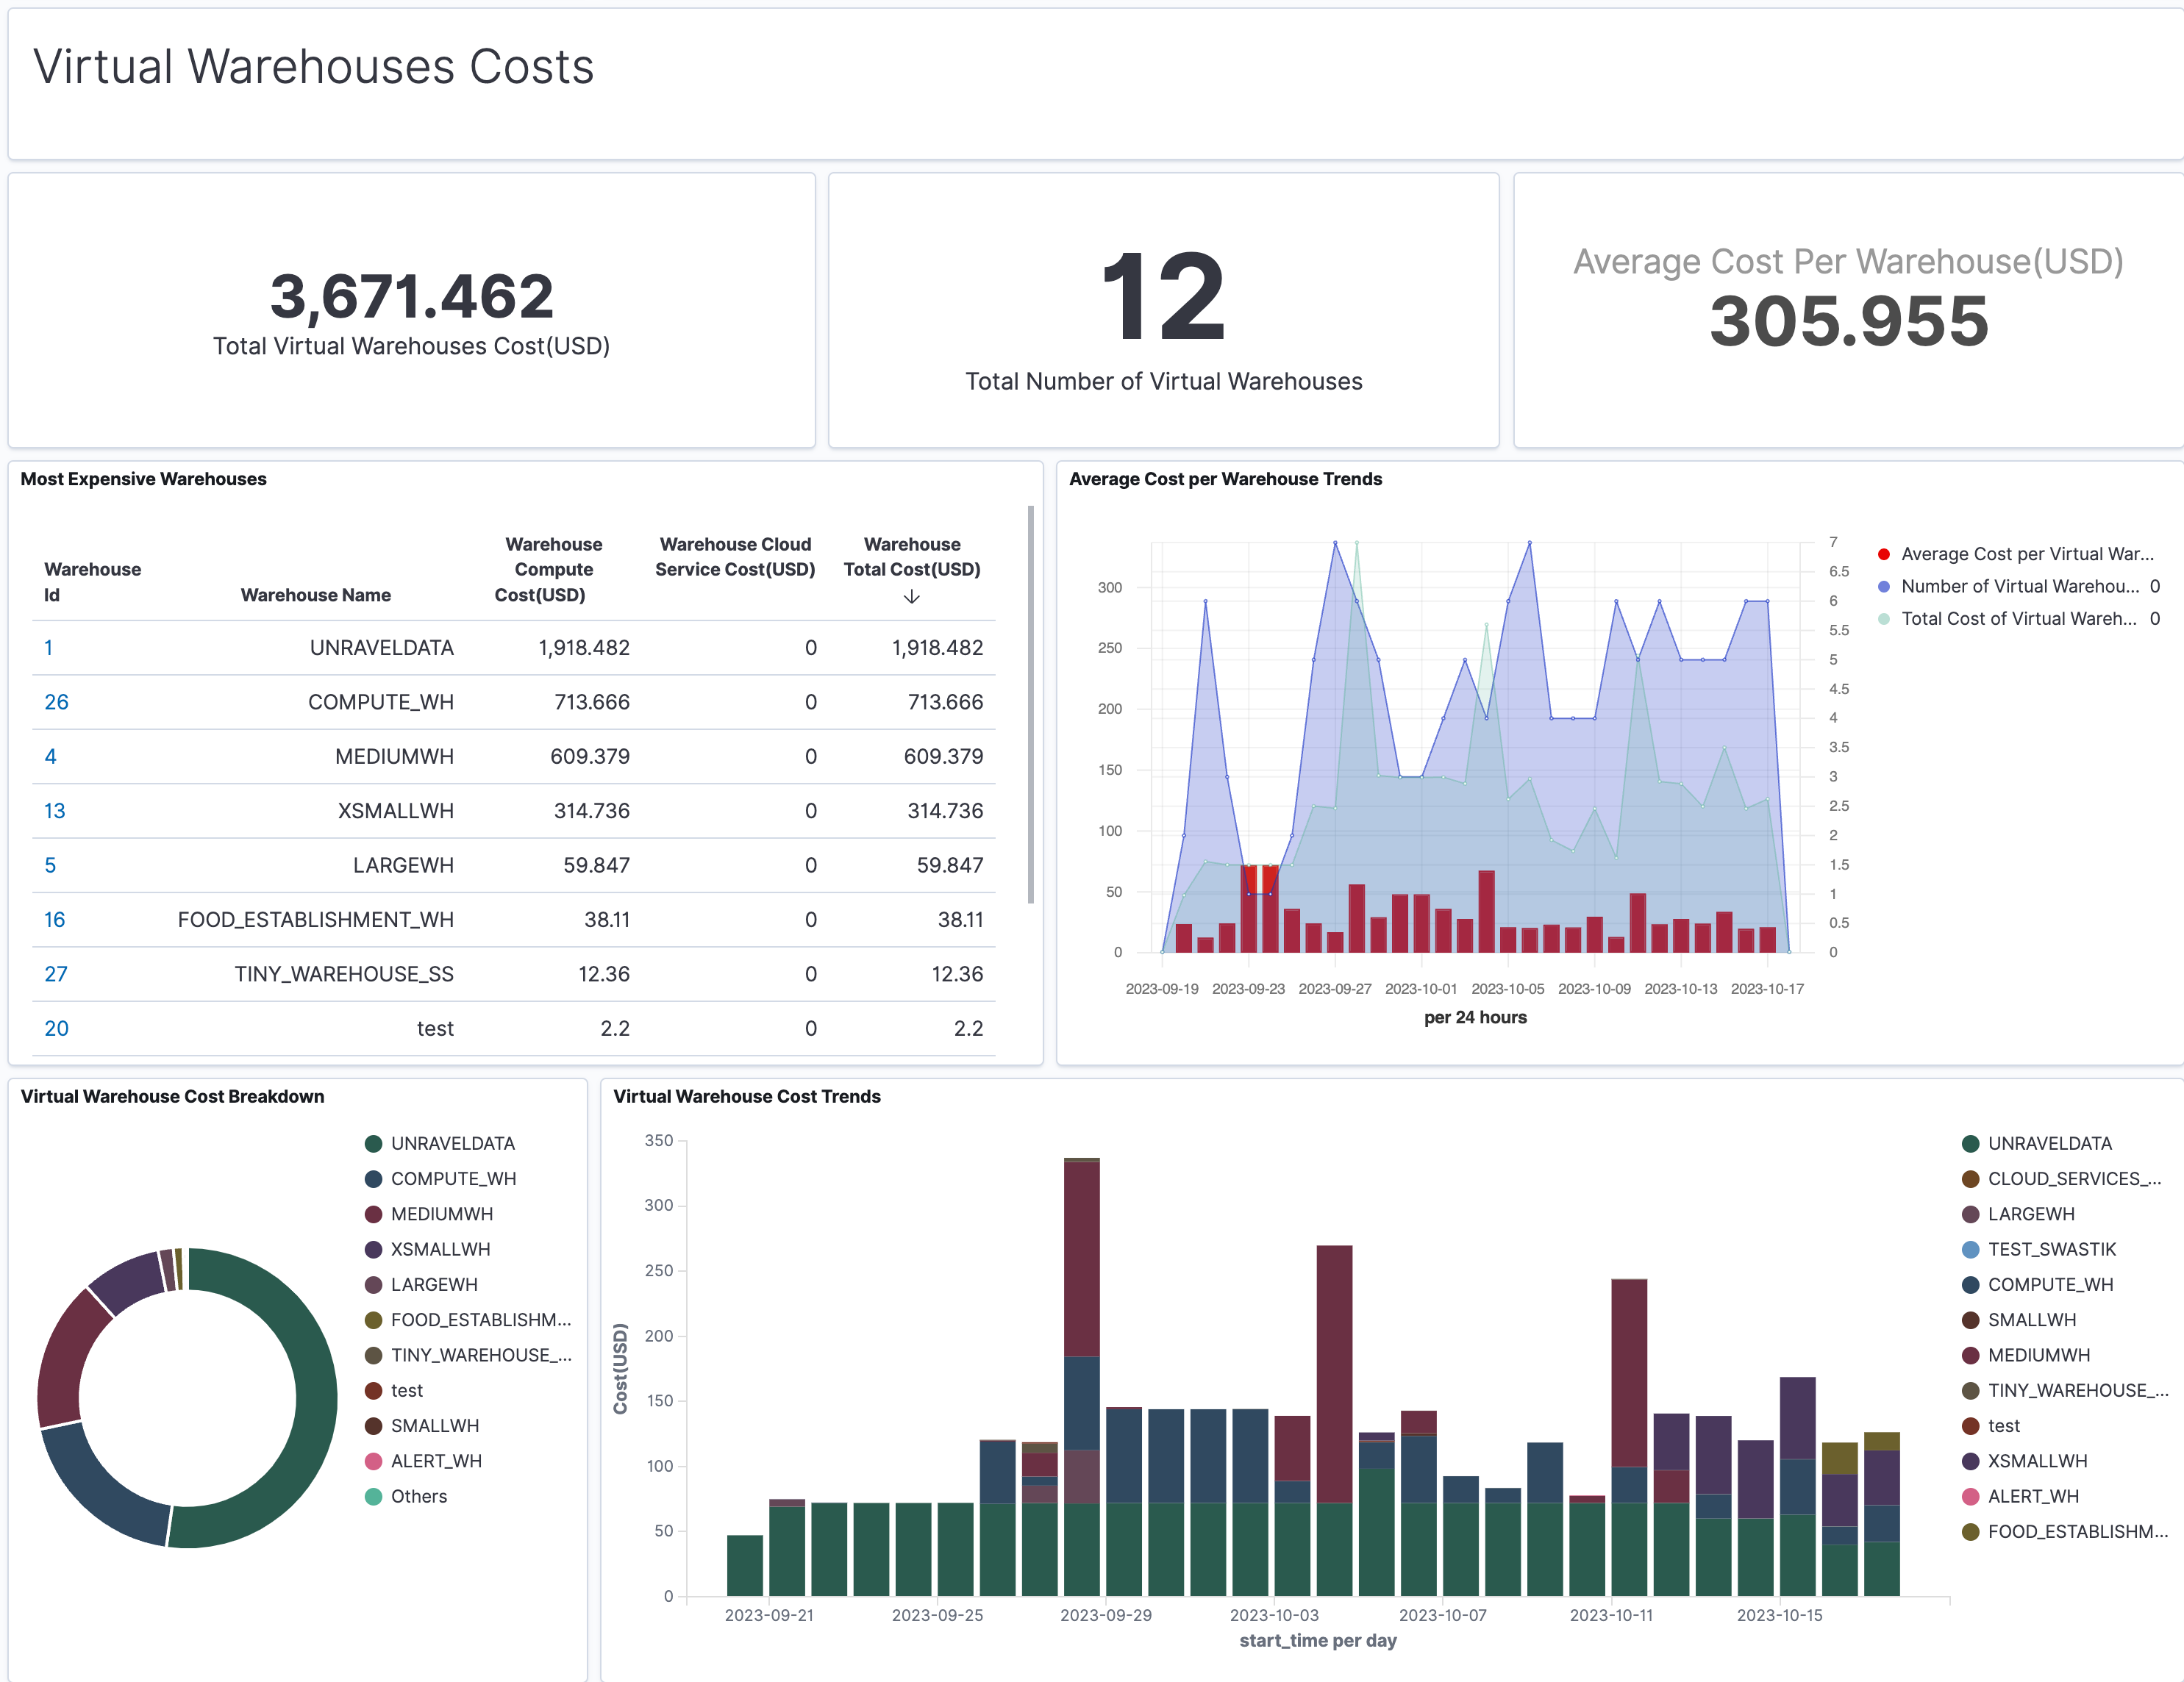
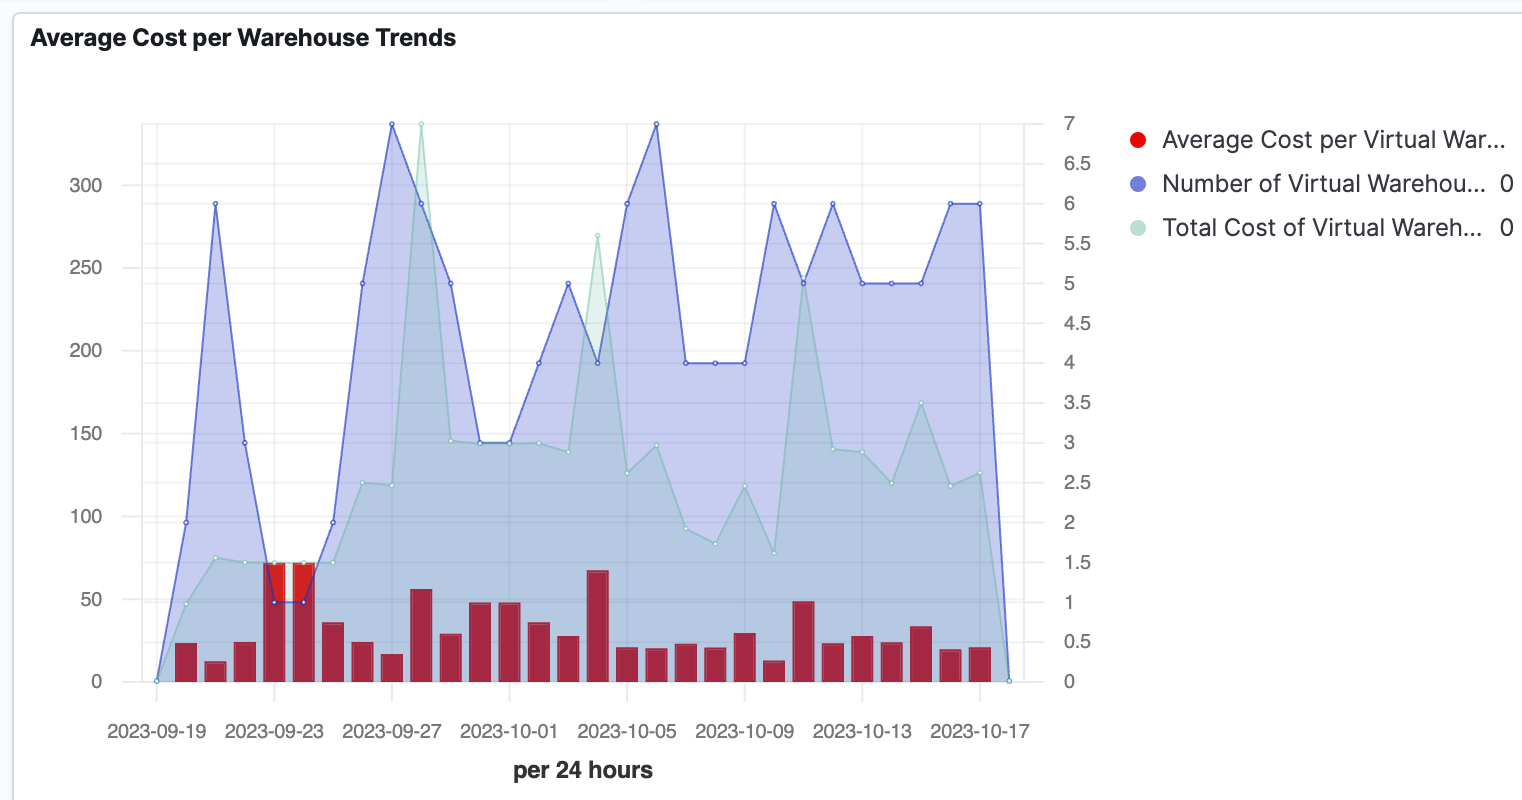
In the Average Cost per Warehouse Trends, you can filter for the average costs per virtual warehouse, the number of virtual warehouses, and the total cost. The x-axis, towards the left, represents the cost of the virtual warehouse. The x-axis, towards the right, represents the number of virtual warehouses. The y-axis, on the bottom of the graph, represents a duration of 24 hours on the specific date mentioned.
The Virtual Warehouse Cost Breakdown section shows a pie chart with the top ten most expensive virtual warehouses. You can view the Virtual Warehouses Cost Trends for all the warehouses in a bar graph next to the pie chart.

