Reports
Manages your reports. You can view and generate reports directly from these tabs.
Archived: All reports and attempts to generate a report, whether the reports were scheduled or run ad hoc.
Schedules: Lists all scheduled reports.
The following report types can be viewed and generated:
Archives
The archived list of all the available reports. The reports are listed in descending order by the report type name.
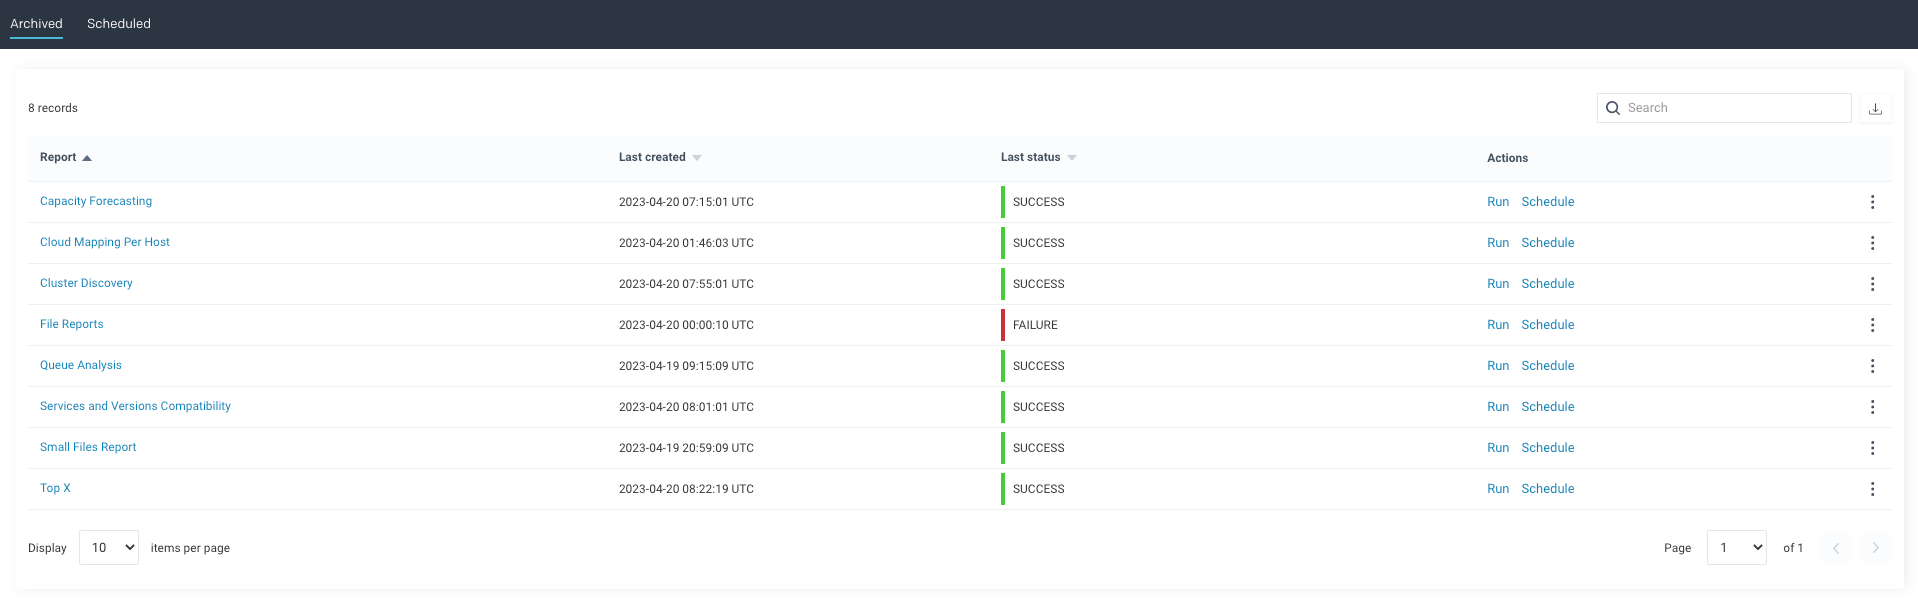
The following report types are listed along with their last created dates and statuses:
Capacity Forecasting
Cloud Mapping Per Host
Cluster Discovery
File Reports
Queue Analysis
Services and Versions Compatibility
Small Files Report
TopX
From the Archives page you can perform the following actions:
Icons/Links | Actions |
|---|---|
| Search for a specific report using its name. |
| Download the archives report list as a CSV file. |
Run link | Create a new report run of a report type. |
Schedule link | Schedule a report run for a report type. |
| Click this icon to do any of the following actions:
|

When you click the Name link of the report type, the corresponding report page is displayed from where you can view all the details of the report runs. From the Archives <Report type> page, you can perform the following actions:
Click
 and type the name of a report name partially or completely to find the report.
 View the list of report runs in the specified time period.
Click
 to download the selected archived report as a CSV file.
 Click Download link, to download the JSON file of the report run.
Click
 to do one of the following items:
Copy report URL.
Open the report run in a new tab.
Delete a report run.
Schedules
Lists all the currently scheduled reports with their corresponding details. Reports are sorted by their Name. The Report column lists the type of report, and Next Scheduled Run is the date and time of the report's scheduled to run.
From the Scheduled reports page, you can perform the following actions:
Click
and type the name of a report name partially or entirely to find the scheduled report. Click
to download the list of the scheduled reports as a CSV file. Click the Download link, to download the JSON file of the report run.
Click
to do one of the following items:Edit the report schedule
Delete the report schedule
Icons/Links | Actions |
|---|---|
| Search for a specific report using its name. |
| Download the archives report list as a CSV file. |
Run link | Create a new report run of a report type. |
Schedule link | Schedule a report run for a report type. |
| Click this icon to do any of the following actions:
|
Filtering a report schedule
On the Unravel UI, go to Reports, and from the Reports section on the left panel select the type of report.
From the Clusters section, on the left panel, you can optionally select the cluster to filter the schedule. The filtered results are displayed in the report list.
Queue Analysis
From this tab, you can generate a report of active queues for a specified cluster. The report analyzes queue activity by jobs and vCores, memory. As with all reports, they can be generated instantly or scheduled. The tab opens, displaying the last successfully generated report, if any. Reports are archived and can be accessed via the Reports > Archives tab.
Configuring the Queue Analysis report
By default, the queue analysis is enabled. You can configure the following optional settings:
Stop Unravel
<Unravel installation directory>/unravel/manager stop
Set the Queue Analysis report properties as follows:
<Installation directory>/manager config properties set
<KEY><VALUES>##For example: <Unravel installation directory>/manager config properties set com.unraveldata.report.queue.http.retries 2 <Unravel installation directory>/manager config properties set com.unraveldata.report.queue.http.timeout.msec 15000Refer to Queue Analysis properties for the complete list of properties.
Apply the changes.
<Unravel installation directory>/unravel/manager config apply
Start Unravel
<Unravel installation directory>/unravel/manager start
Generating Queue Analysis report
On the Unravel UI, go to Reports > Archived tab.
Click the Queue Analysis link.
A list of records in the Queue Analysis report is displayed.
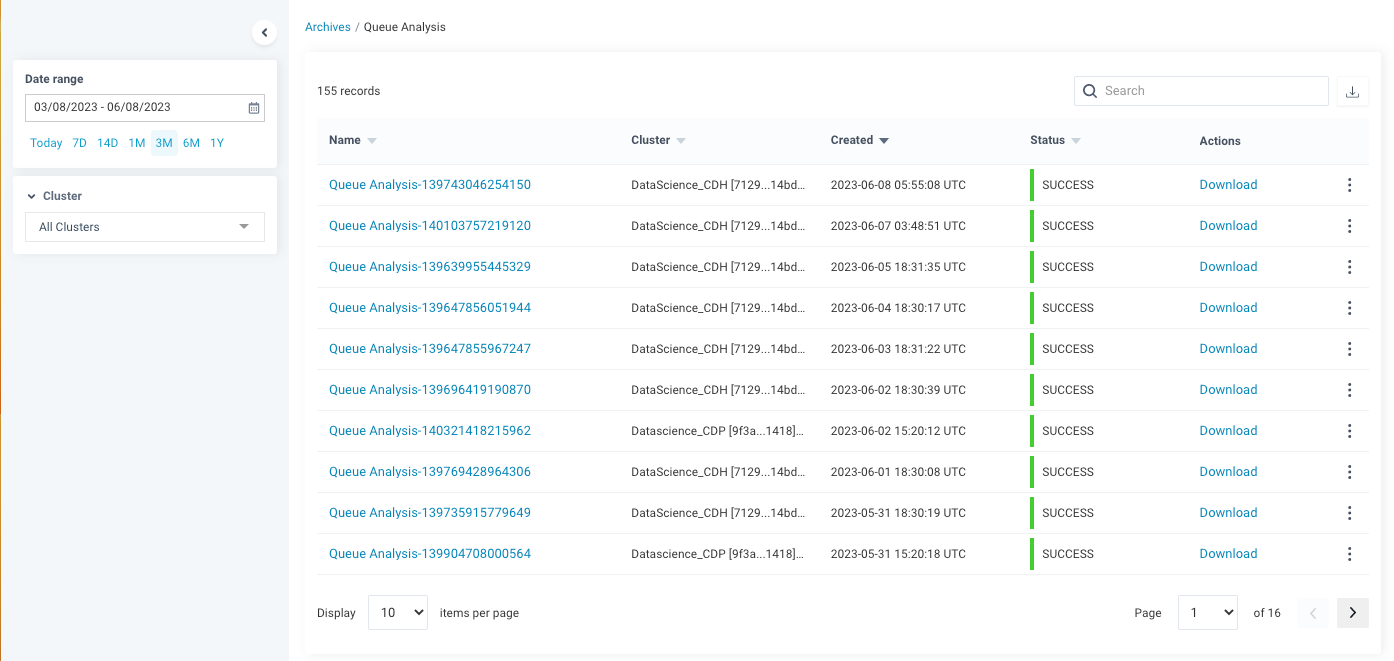
Enter the following parameters:
The corresponding reports are displayed. You can click a report name link to view the report.
Date Range: Select a period range.
Cluster: In a multi-cluster setup, you can select the cluster from where you want to generate the report.
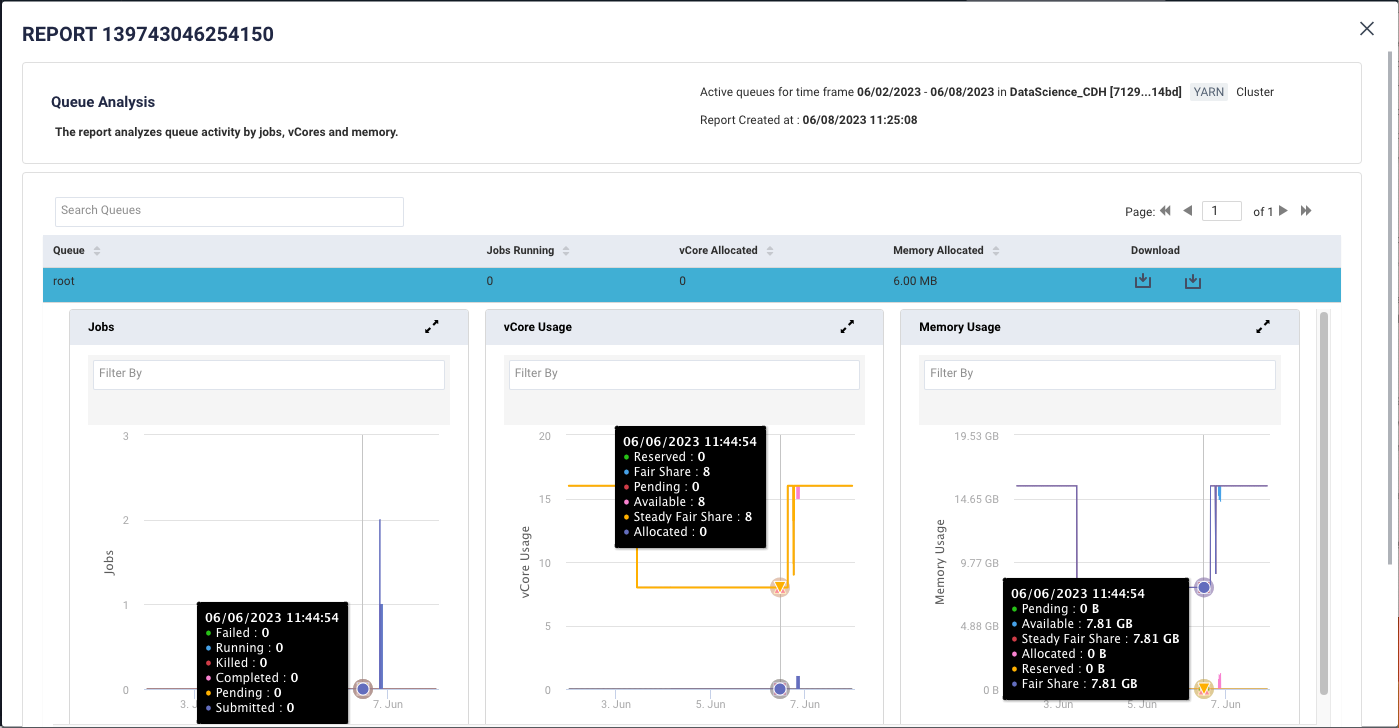
Queue Analysis report
On the Archives > Queue Analysis page, click the Queue Analysis report.
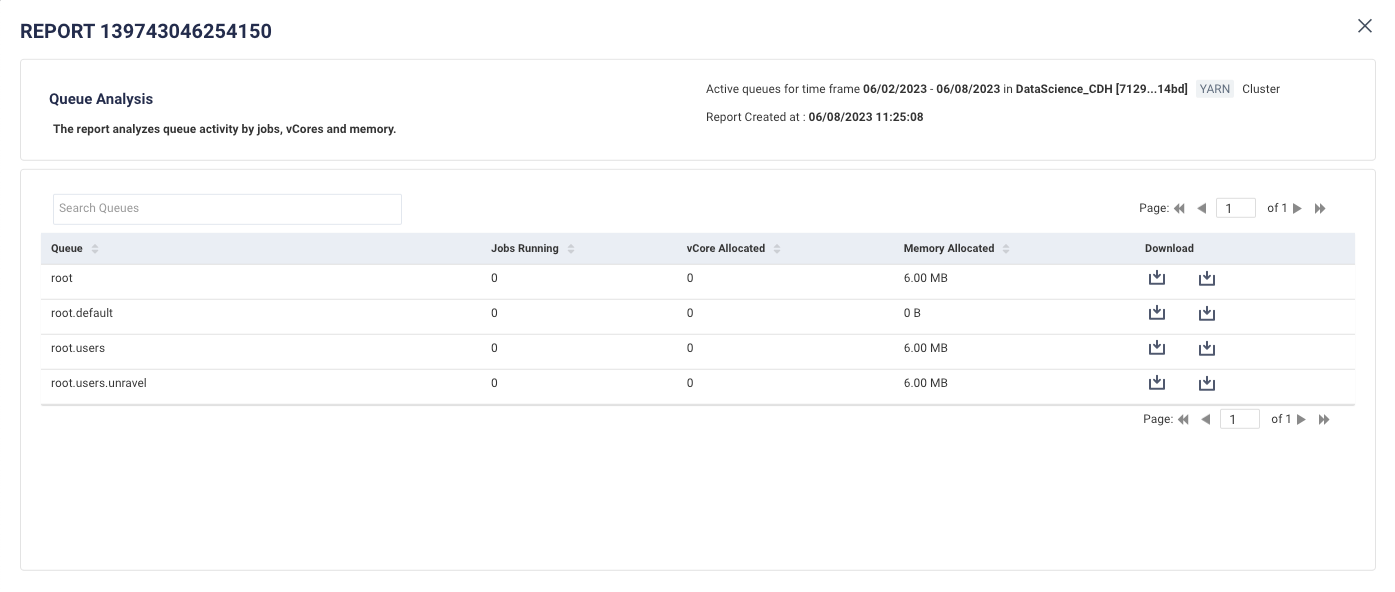
Click  to download the complete report of the selected queue in a CSV or JSON format.
The active queues, along with the following details, are listed:
Column | Description |
|---|---|
Queue | Name of the queue. |
Jobs running | The number of jobs running in the queue. These are average values over the selected Date Range everywhere. |
vCore Allocated | The number of vCores allocated for the queue. These are average values. |
Memory Allocated | Memory allocated for the queue. These are average values. |
Drilling down in a Queue Analysis report
Click a row in the active queue list, and the details of the running jobs, vCores usage, and memory usage are displayed in the following graphs:
Type the name of the queue in the Search Queues box to find a specific queue.
Click  to expand a graph.
In the Filter By list, select the filters. Each of the graphs can be filtered further.
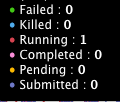
Jobs: This graph plots the number of jobs running along with their status, in the specified period. The status can be any of the following, which can be used to filter and change the trends shown in the graph. You can filter the graph view based on the status.
vCore: This graph plots the usage of the allocated vCore, along with the following metrics, for the selected queue, in the specified period. The metrics can be used to filter the graph further:
Reserved
Fair Share
Pending
Steady Fair Share
Available
Allocated
Memory Usage: This graph plots the memory usage, along with the following metrics, for the selected queue, in the specified period. The metrics can be used to filter the graph further:
Reserved
Fair Share
Pending
Steady Fair Share
Available
Allocated
Click any point in the graph, and the Resources page corresponding to the point of time clicking in the graph, for that queue is displayed.
Top X report
This topic provides information about the Top X applications. The Top X reports are enabled by default.
Generating TopX report
Click Reports > Archived. Click the Run link corresponding to Top X.
In the New Report dialog box, enter the following parameters:
History (Date Range): Use the date picker drop-down to specify the date range.
Top X: Enter a number for the top Hive, Spark, and Impala apps you want to view.
Cluster: In case of multi-cluster setup, you can select a cluster from where you want to generate the report.
Users: Users who submitted the app.
Real User: Users who submitted the app. For instance, the user might be a hive, but the real user is joanxyz@mycompany.com.
Queue: Select queues.
Tags: Select tags.
Click
 to generate the report.
The progress of the report generation is shown at the top of the page, and you are notified about the successful creation of the report. The latest successful report is shown on the Clusters > Top X page.
All reports (successful or failed attempts) are in the Reports > Archived section.
Scheduling TopX report
Click Reports > Archived. Click the Schedule link corresponding to Top X.
In the Schedule Report dialog box, provide the following details:
History (Date Range): Use the date picker drop-down to specify the date range.
Top X: Enter a number for the top Hive, Spark, and Impala apps you want to view.
Cluster: In case of a multi-cluster setup, select a cluster from where you want to generate the report.
Users: Users who submitted the app.
Real User: Users who submitted the app. For instance, the user might be a hive, but the real user is joanxyz@mycompany.com.
Queue: Select queues.
Tags: Select tags.
Schedule to Run: Select any of the following schedule options from the drop-down and set the time from the hours and minutes drop-down:
Daily
Select a day in the week. (Sun, Mon, Tue, Wed, Thu, Fri, Sat)
Every two weeks
Every month
Notification: Provide either a single or multiple email IDs to receive the notification of the reports generated.
Click
 .
.
Viewing TopX report
In the Reports > Archived, click the icon corresponding to Top X and select View the latest report for the selected date range. The TopX report is displayed.
The following sections are included in the TopX reports, which can be grouped by Hive, Spark, or Impala.
Input Parameters
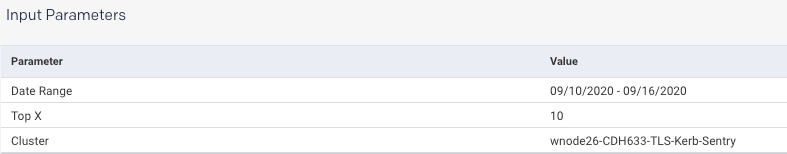
This section provides the basic information about the report, that is, the date range selected, the number of top results included in the TopX report, and the cluster from where the report is generated.
Applications
Select Hive, Spark, or Impala to view the respective applications section.
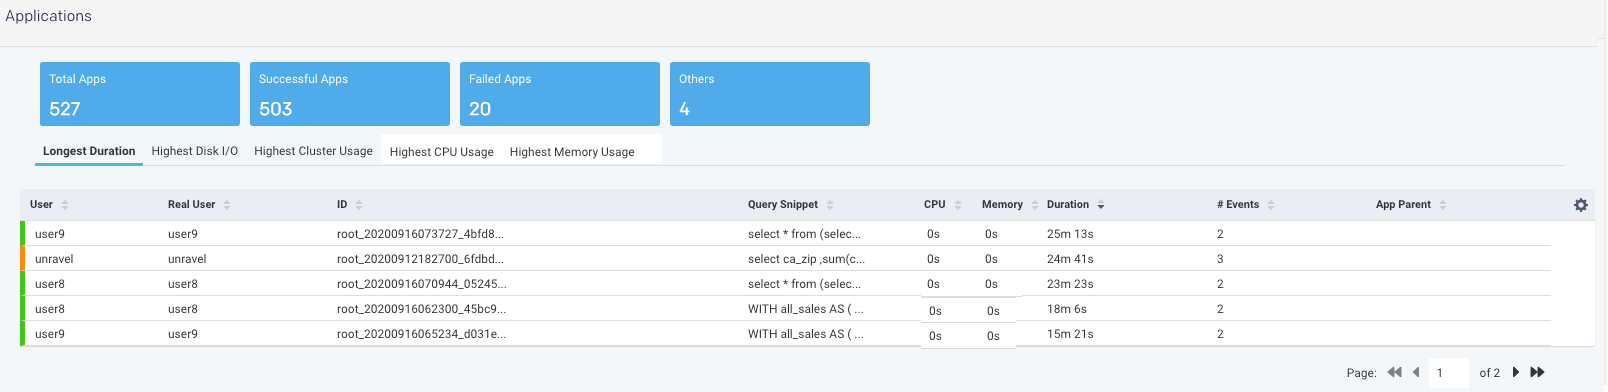
The Applications section shows the following app metrics for the generated TopX report:
Total Apps: Number of apps on the cluster.
Successful Apps: Number of apps that are completed successfully.
Failed Apps: Number of apps that have failed to complete.
Others: Number of apps killed or those in a pending, running, waiting, or unknown state.
Further, the detailed TopX report for applications is generated, which are grouped based on the following categories:
Longest Duration: The Top N number of applications ran for the longest duration.
Highest Disk I/O: The Top N number of applications that have the highest disk input/output operations.
Highest Cluster Usage: The Top N number of applications that have the highest cluster usage.
Highest CPU Usage: The Top N number of applications that have the highest CPU usage.
Highest Memory Usage: The Top N number of applications that have the highest memory usage.
Click  to download any of the category list in a CSV format.
Click any of the tabs to view further TopX details of the selected app.
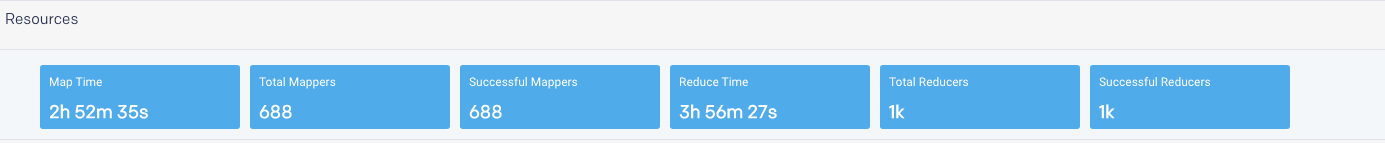
Resources
Resources breakdown the Map/reduce time for Hive apps. The information about total mappers, successful mappers, total reducers, and successful reducers is shown.
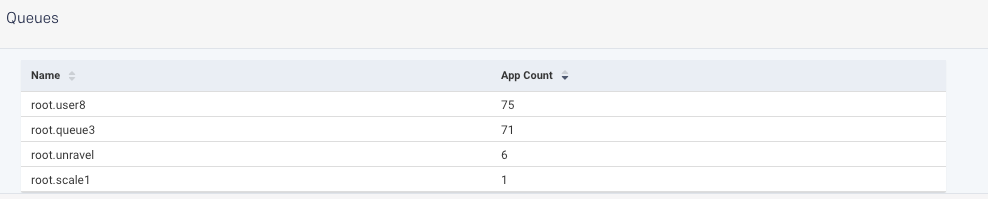
Queues
The Queues section shows the app count for the selected queue plus the other criteria which were selected for generating the report. Click to download the list in a CSV format.
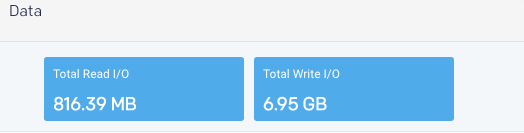
Data
The Data tile displays the cumulative total by Read and Write I/O