Chargeback
You can generate chargeback reports for your clusters' usage costs for Yarn and BigQuery jobs. Multi-cluster feature is supported for Chargeback reports. However, you can only view the report of a single cluster at a time.
If Yarn jobs or BigQuery jobs are not running on the selected cluster at the specified time, then chargeback reports are not shown.
Generate chargeback report
From the Chargeback Type drop-down, select either Yarn or BigQuery.
Select a cluster, if you have selected Yarn.
Form date picker pull-down menus select a date range.
In the VCore/Hour ($) , enter the estimated number of VCores used per hour, and in the Memory MB/Hour ($), enter the estimated memory used per hour. A quick estimation is displayed in the results table, in the CPU hours or Memory hours column of the corresponding group by the table.
Click in the Group By box and select an option. Select a maximum of two Group By options at a time. You can click
 next to the option to deselect an option if you have selected more than one option.
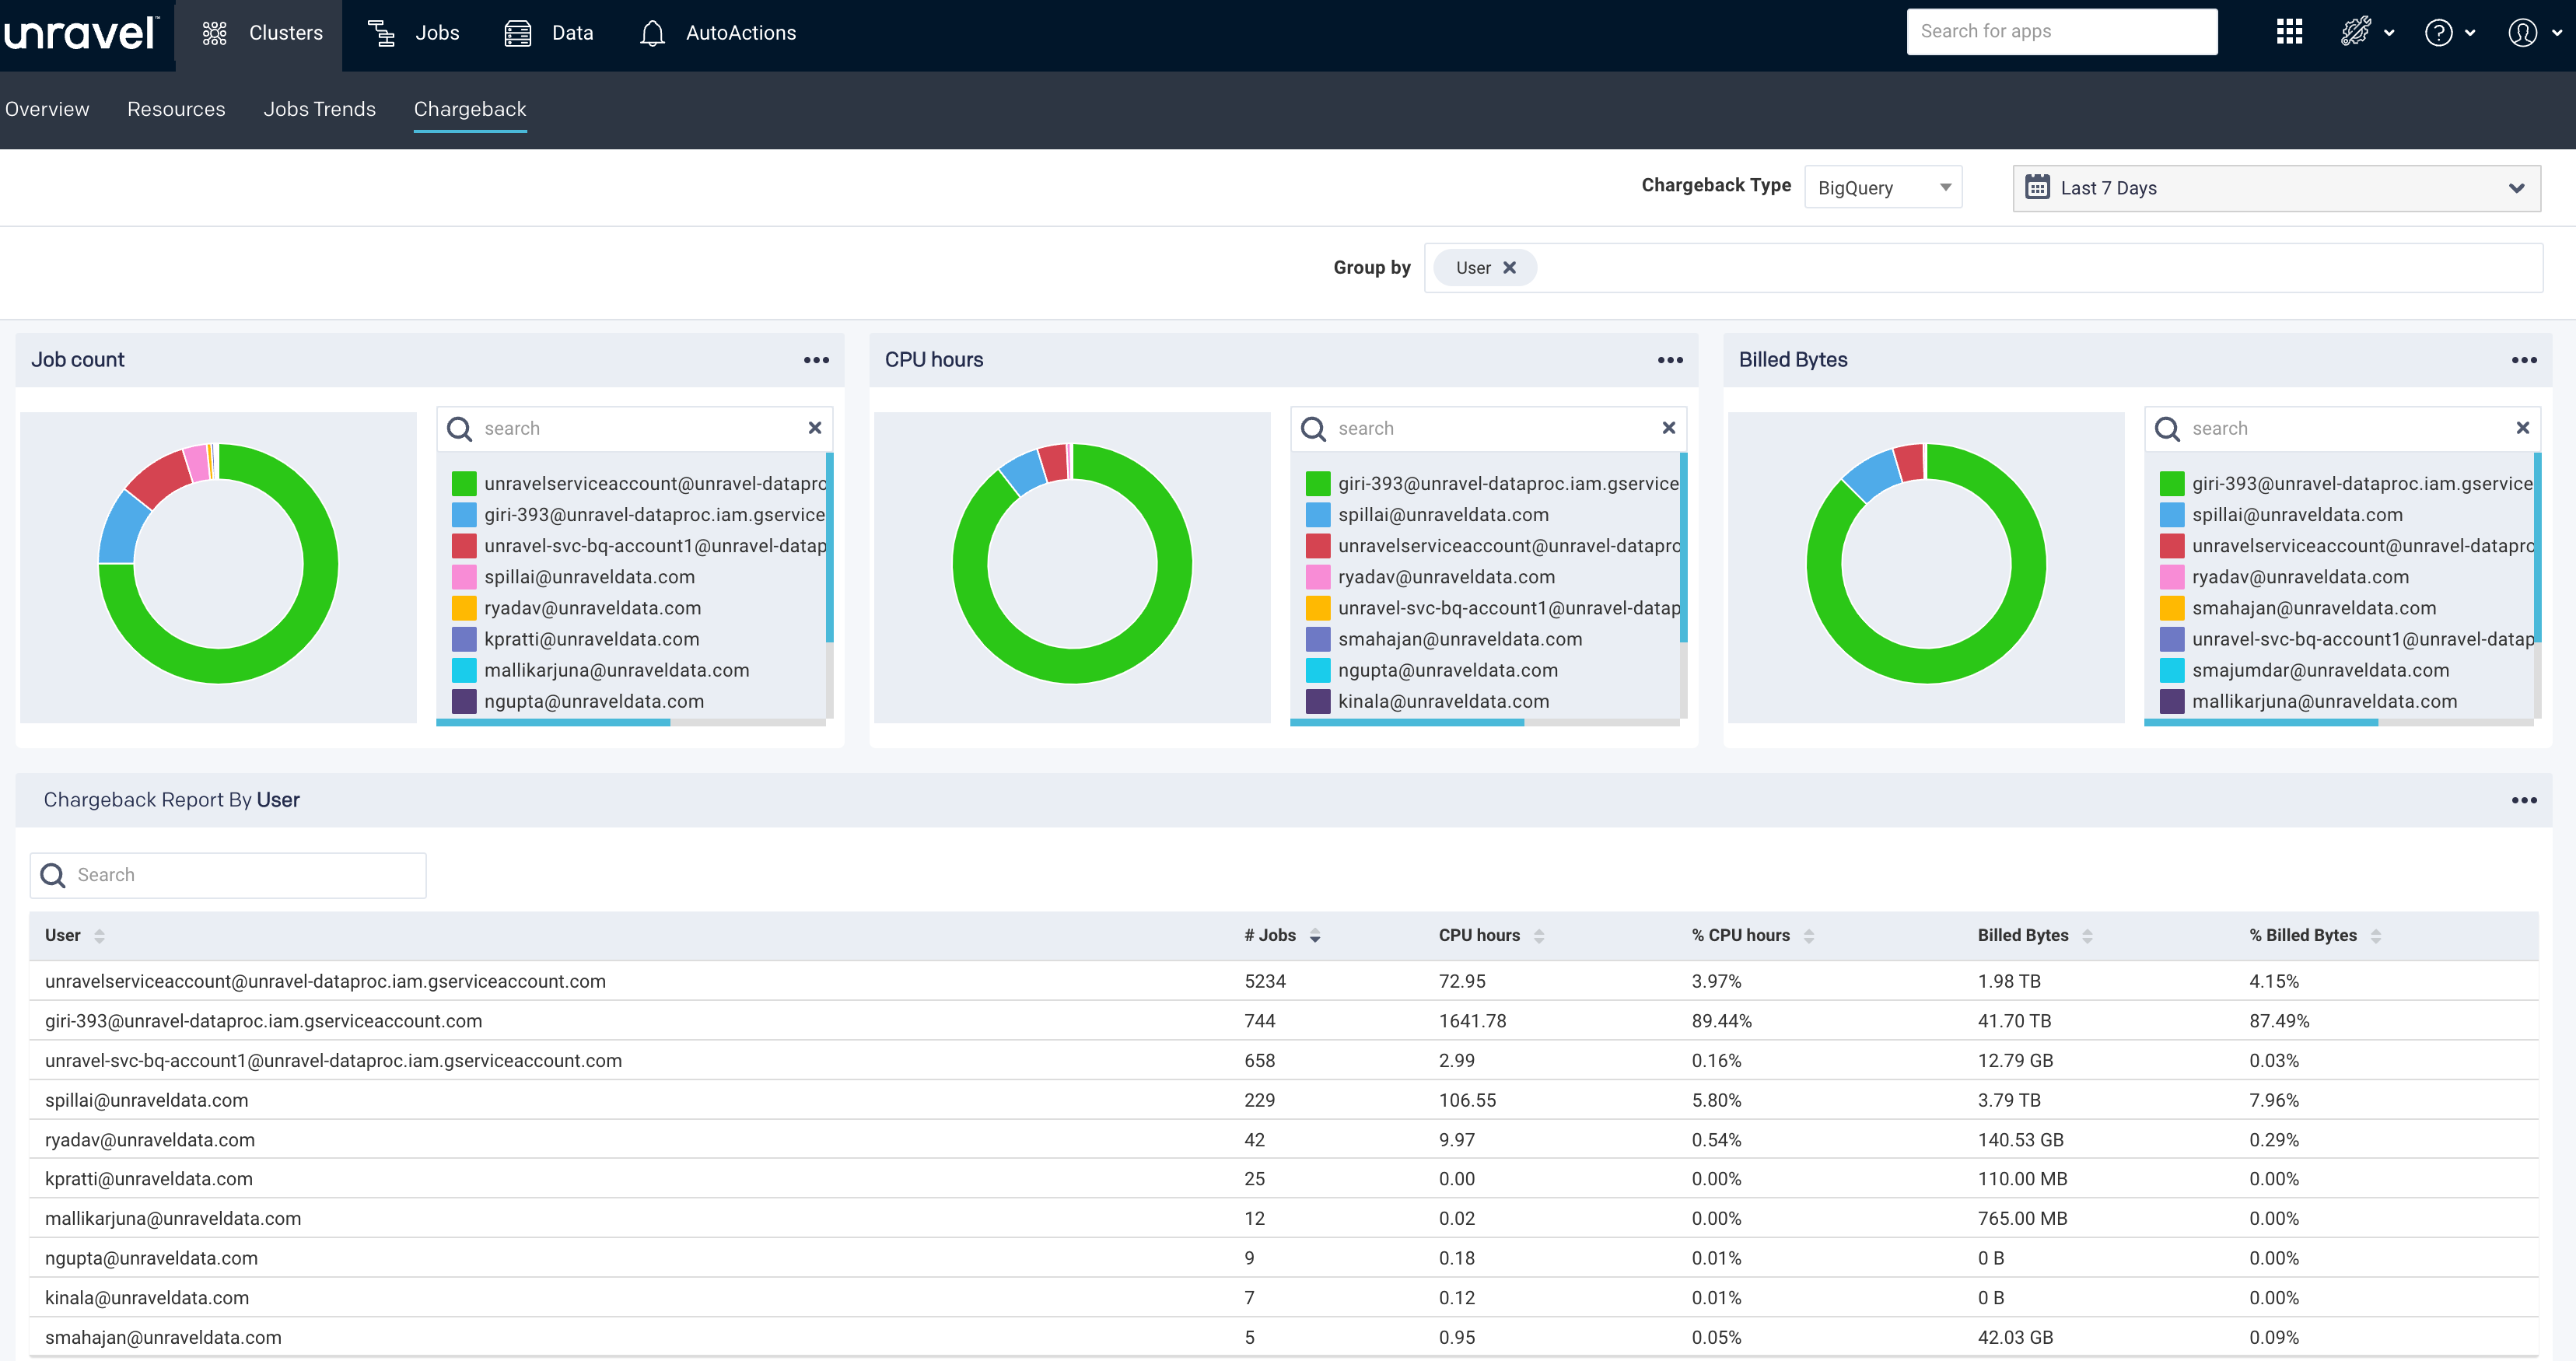
The chargeback report is generated. If you have selected two Group By options, the combined results are displayed in the donut charts (Job count, CPU hours, Billed Bytes) and the table below the donut charts. Refer to Drilling down the Chargeback results for more details.
Example: In the following image, the report is grouped by two tags, dept and project. (See What is tagging, if you are unfamiliar with the concept.)
There are times when a job cannot be grouped by the selected option. In such cases, NULL is listed in the Group By option column.
Hover over a donut section to see the slice name, the value, and the percentage of the whole.
The list of all the Yarn jobs/Impala jobs is provided in the tables. You can view 15 records at a time and download the list in a CSV format.
Click
 to download the chargeback report in CSV format.
Drilling down the Chargeback results
The chargeback results are displayed in the table.
Note
For BigQuery, if parent and child jobs are available, only the parent jobs are listed in the chargeback result because the parent job contains the aggregated metrics of child jobs.
Click any row to drill down to the next Group By option. If you click the row again, you can drill down further till all the associated Group By options are exhausted.
Use the navigation path corresponding to the Group by to move back to a previous option.
Estimating chargeback cost
From the Chargeback drop-down in the upper right corner, select one of the following options:
Yarn
BigQuery
Select a cluster.
Use date picker pull-down menu to select a date range.
Click in the Group By box and select an option. You can select a maximum of two Group By options only at a time. The Chargeback report is displayed.
The chargeback report is generated.
Enter the vCore/Hour or Memory MB/Hour and click Apply. A quick estimation is displayed in the results table, in the CPU hours or Memory hours column of the corresponding group by the table.