TopX
On the TopX page, you can view dashboards that highlight key insights and performance metrics within your cloud environment. These dashboards include information on
Wasted costs
Potential savings through job migration
Costliest clusters and jobs
Opportunities for savings with recurring jobs
Viewing the TopX page
On the Unravel UI, navigate to Home > TopX.
From the top right corner of the page, select the required period for the insights. The insights are displayed.
From the TopX drop down, select Top 5 or Top 10. The selected TopX dashboards are displayed for all the compute types.
You can filter for the required compute type from the drop down.
You can filter for most wasted, most savings, and most expensive dashboards.
Hover over the dashboards to view the duration, annualized cost, and savings for each cluster.
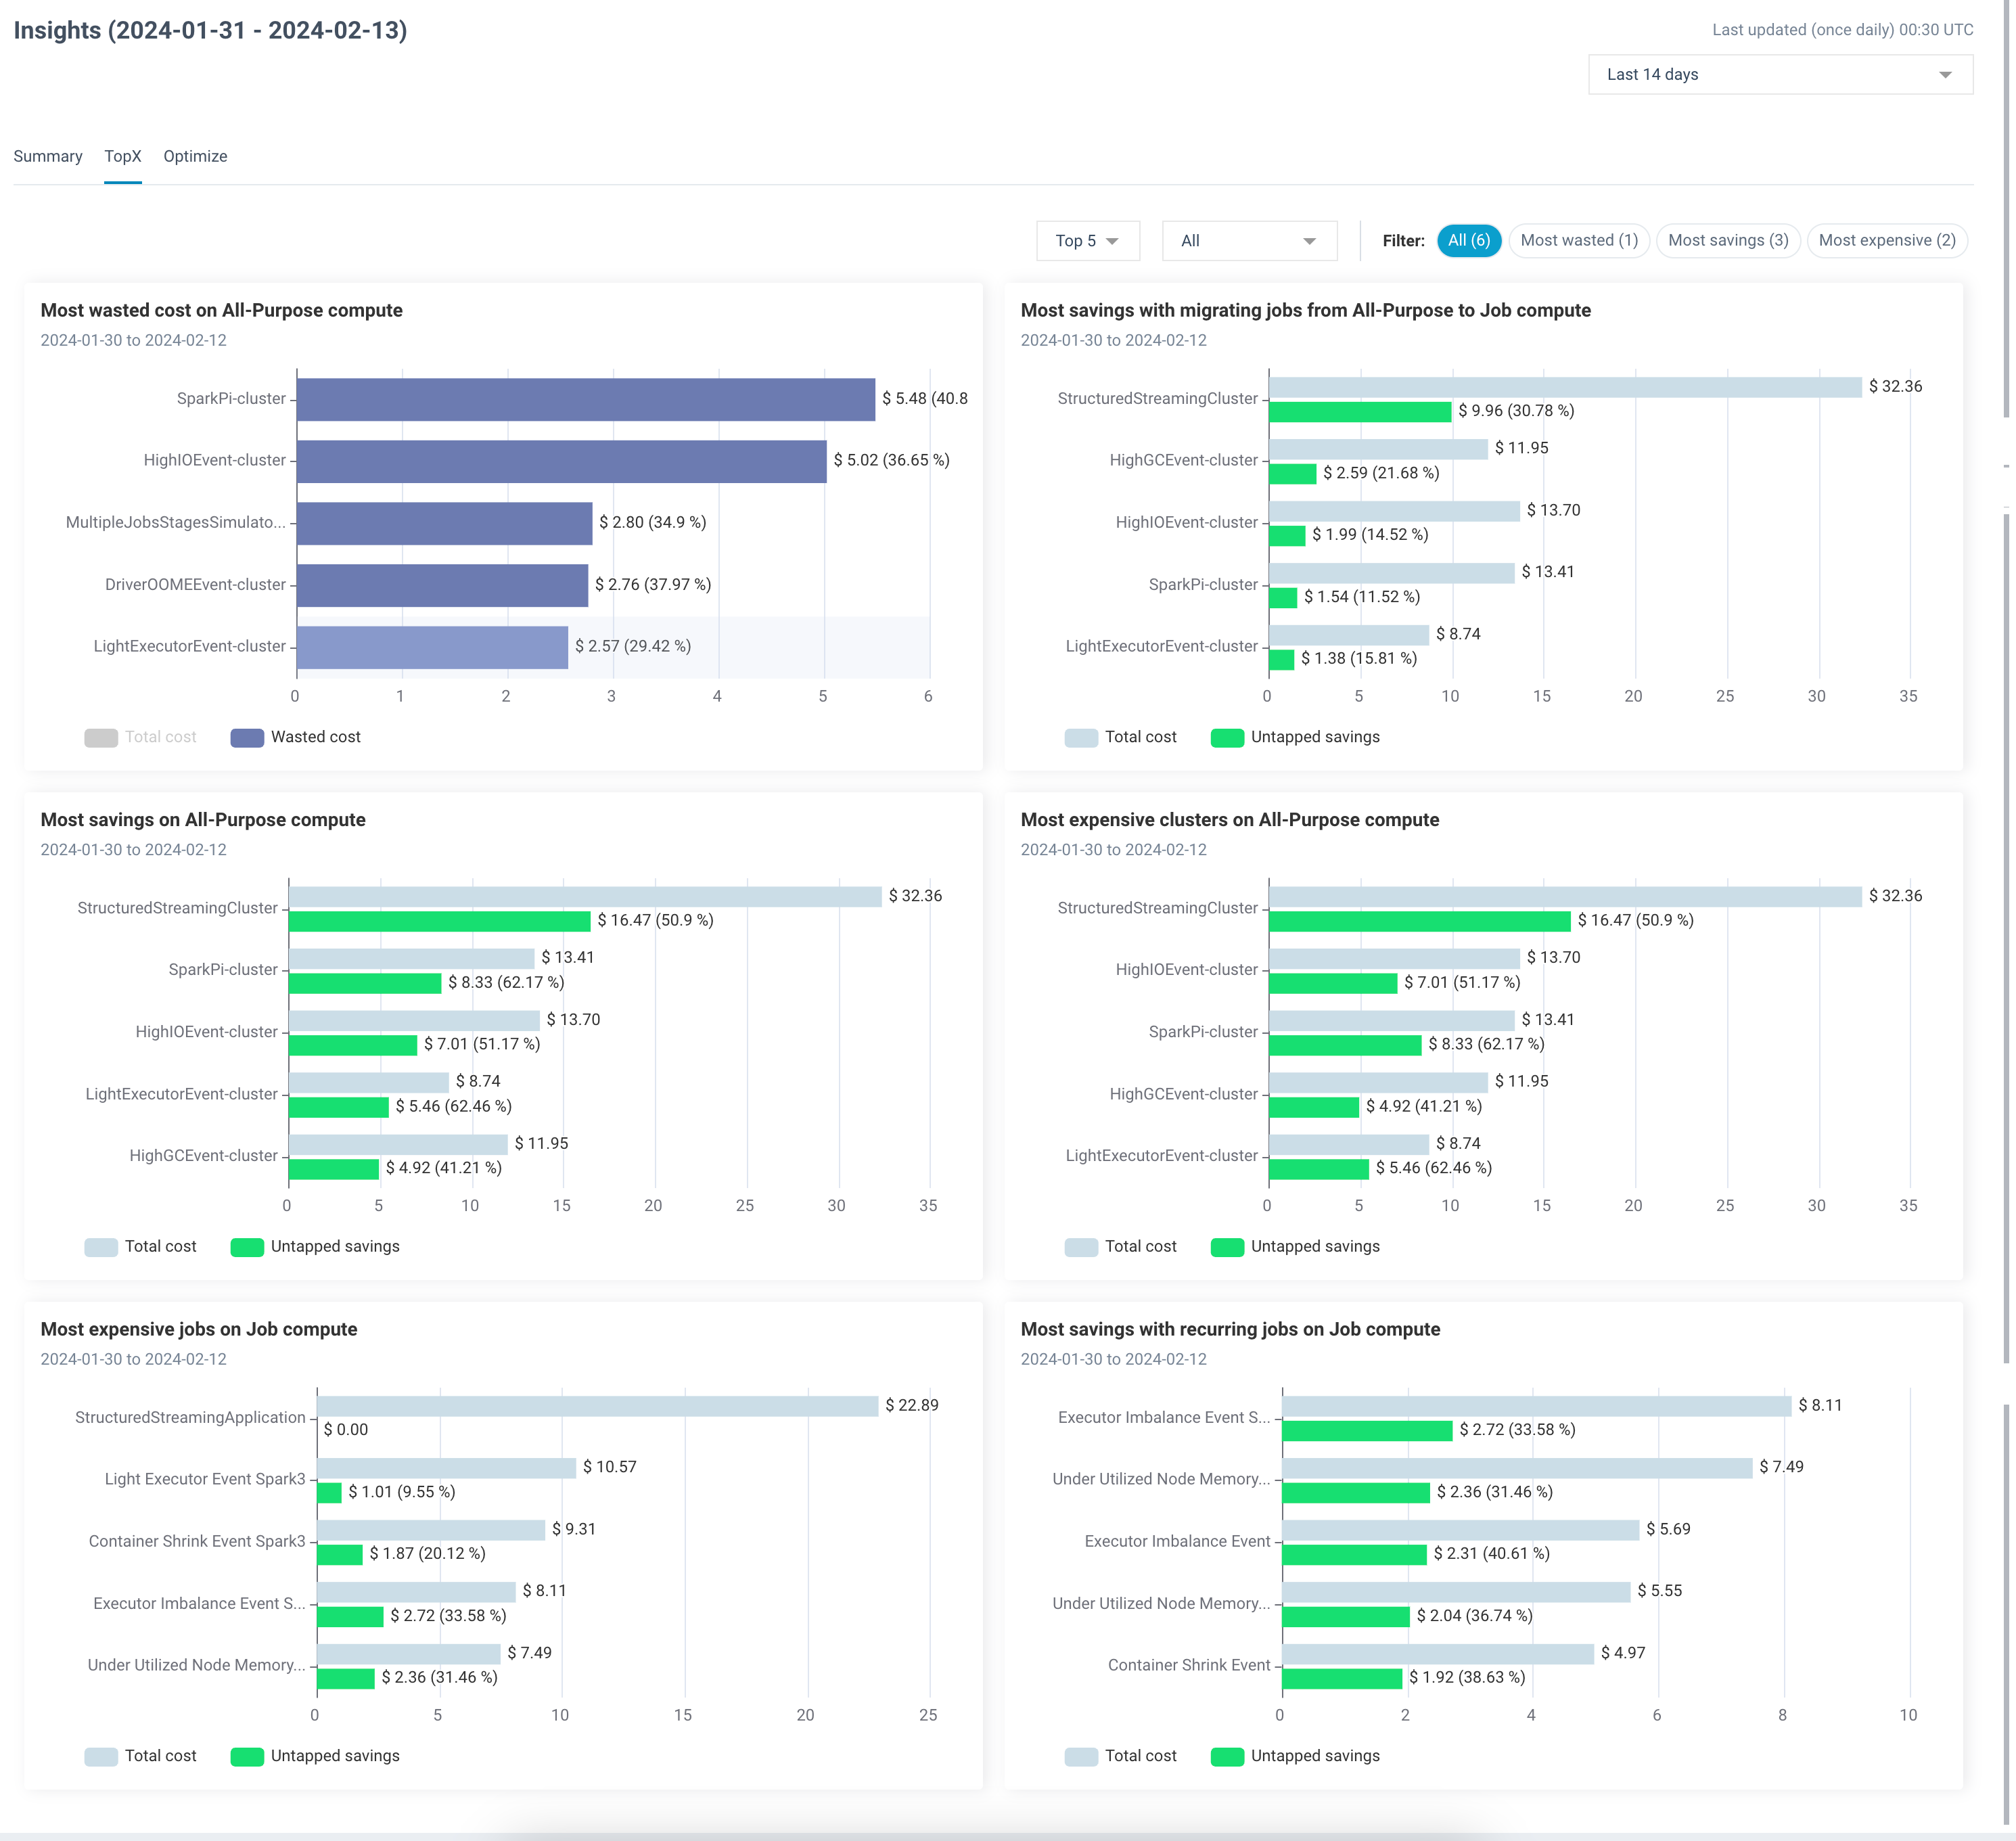
The following dashboards are available:
Dashboard
Description
Most Wasted Cost on All-Purpose Compute
Identify clusters and resources in the All-Purpose Compute category with the highest amount of wasted costs.
Most Savings with Migrating Jobs from All-Purpose to Job Compute
Discover potential cost savings by migrating jobs from All-Purpose Compute to Job Compute clusters.
Most Savings on All-Purpose Compute
Explore opportunities to achieve significant savings within the All-Purpose Compute category through optimization.
Most Expensive Clusters on All-Purpose Compute
Identify the clusters in the All-Purpose Compute category with the highest costs for analysis and optimization.
Most Expensive Jobs on Job Compute
Analyze the jobs running on Job Compute clusters with the highest costs for resource optimization.
Most Savings with Recurring Jobs on Job Compute
Explore potential savings by optimizing recurring jobs on Job Compute clusters to reduce costs and improve efficiency.