Optimize
The Optimize tab displays valuable insights on resource efficiency savings, migration strategies, and cost optimization techniques to optimize your cloud resources effectively. Gain deeper visibility into your optimization efforts with metrics such as total ROI and productivity boost.
Viewing the Optimize page
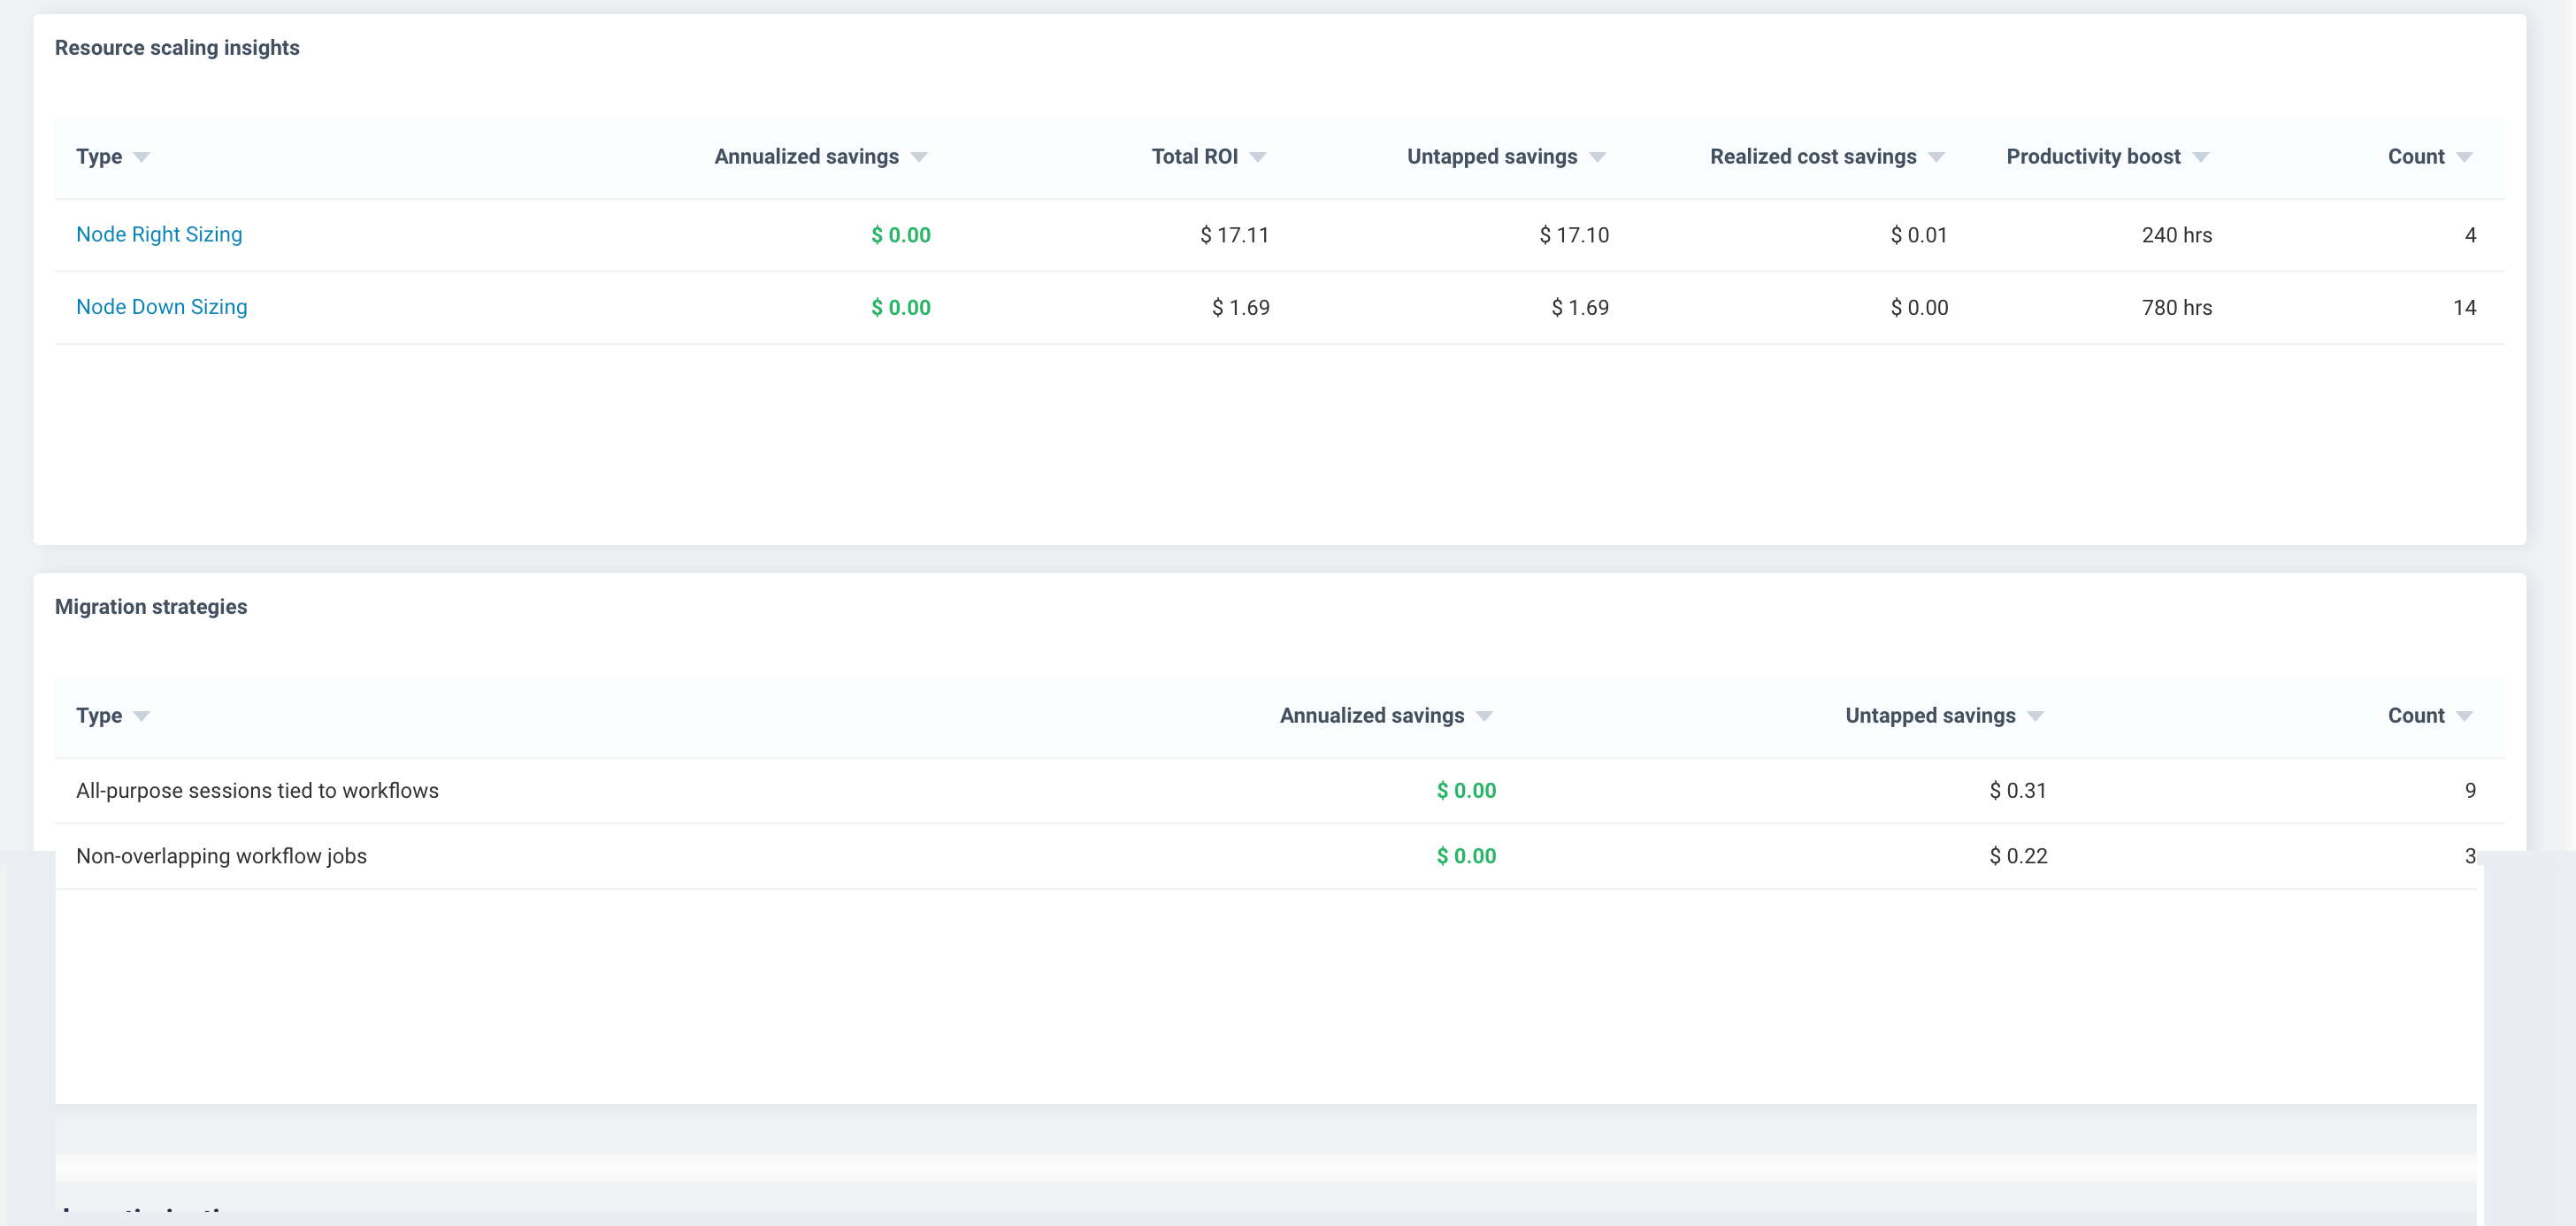
The details for the resource scaling insights and migration strategies are displayed in the form of tables. The table gives information on the savings, type, and count. Hover over the type of resource scaling insight or migration strategy to know more about the insight or migration strategy.
On the Unravel UI, navigate to Home > Optimize.
From the top of the page, select the required period for the insights. The available opportunities for optimization are displayed.
At the top of the page the total ROI and productivity boost metrics are displayed.
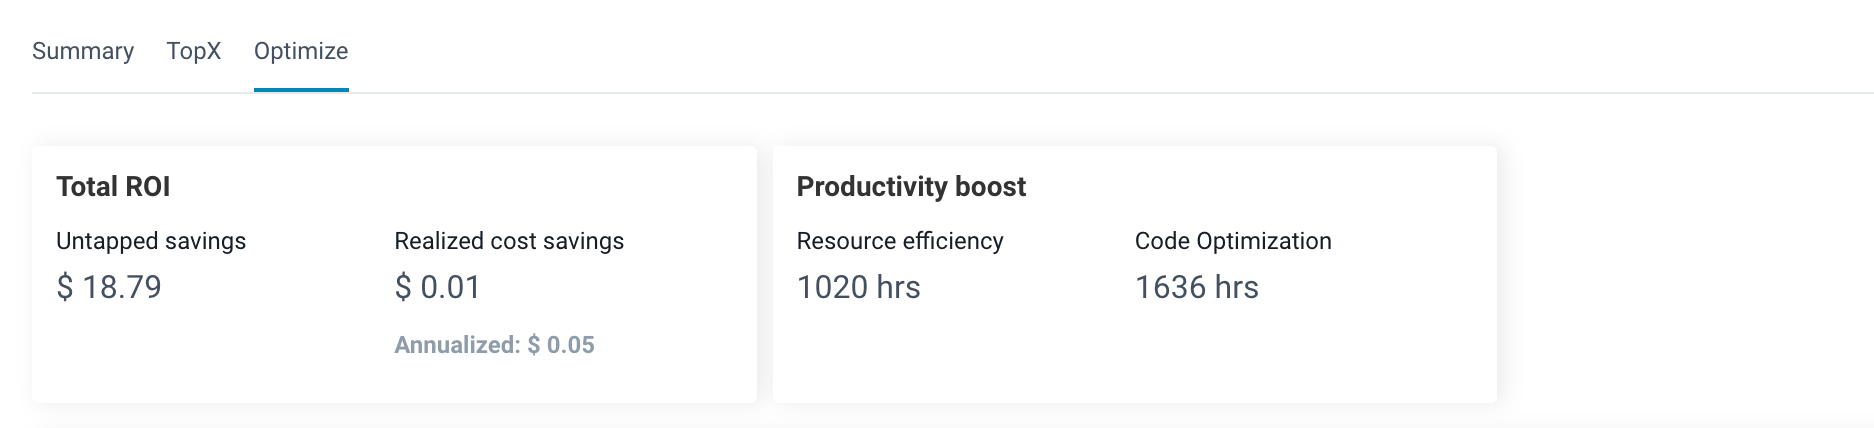
Total ROI: This provides insights into the total ROI potential by implementing the resource efficiency recommendations. Untapped savings offers information on the amount of potential cost savings that can be achieved with the optimization. Realized cost savings gives information on the amount that is saved during the selected period after implementing the recommendations. Annualized cost gives an approximation of the realized savings for a period of one year. With these metrics you can understand the potential for optimization.
Productivity boost: This indicates the number of hours of increased productivity achievable through resource efficiency and code optimization.
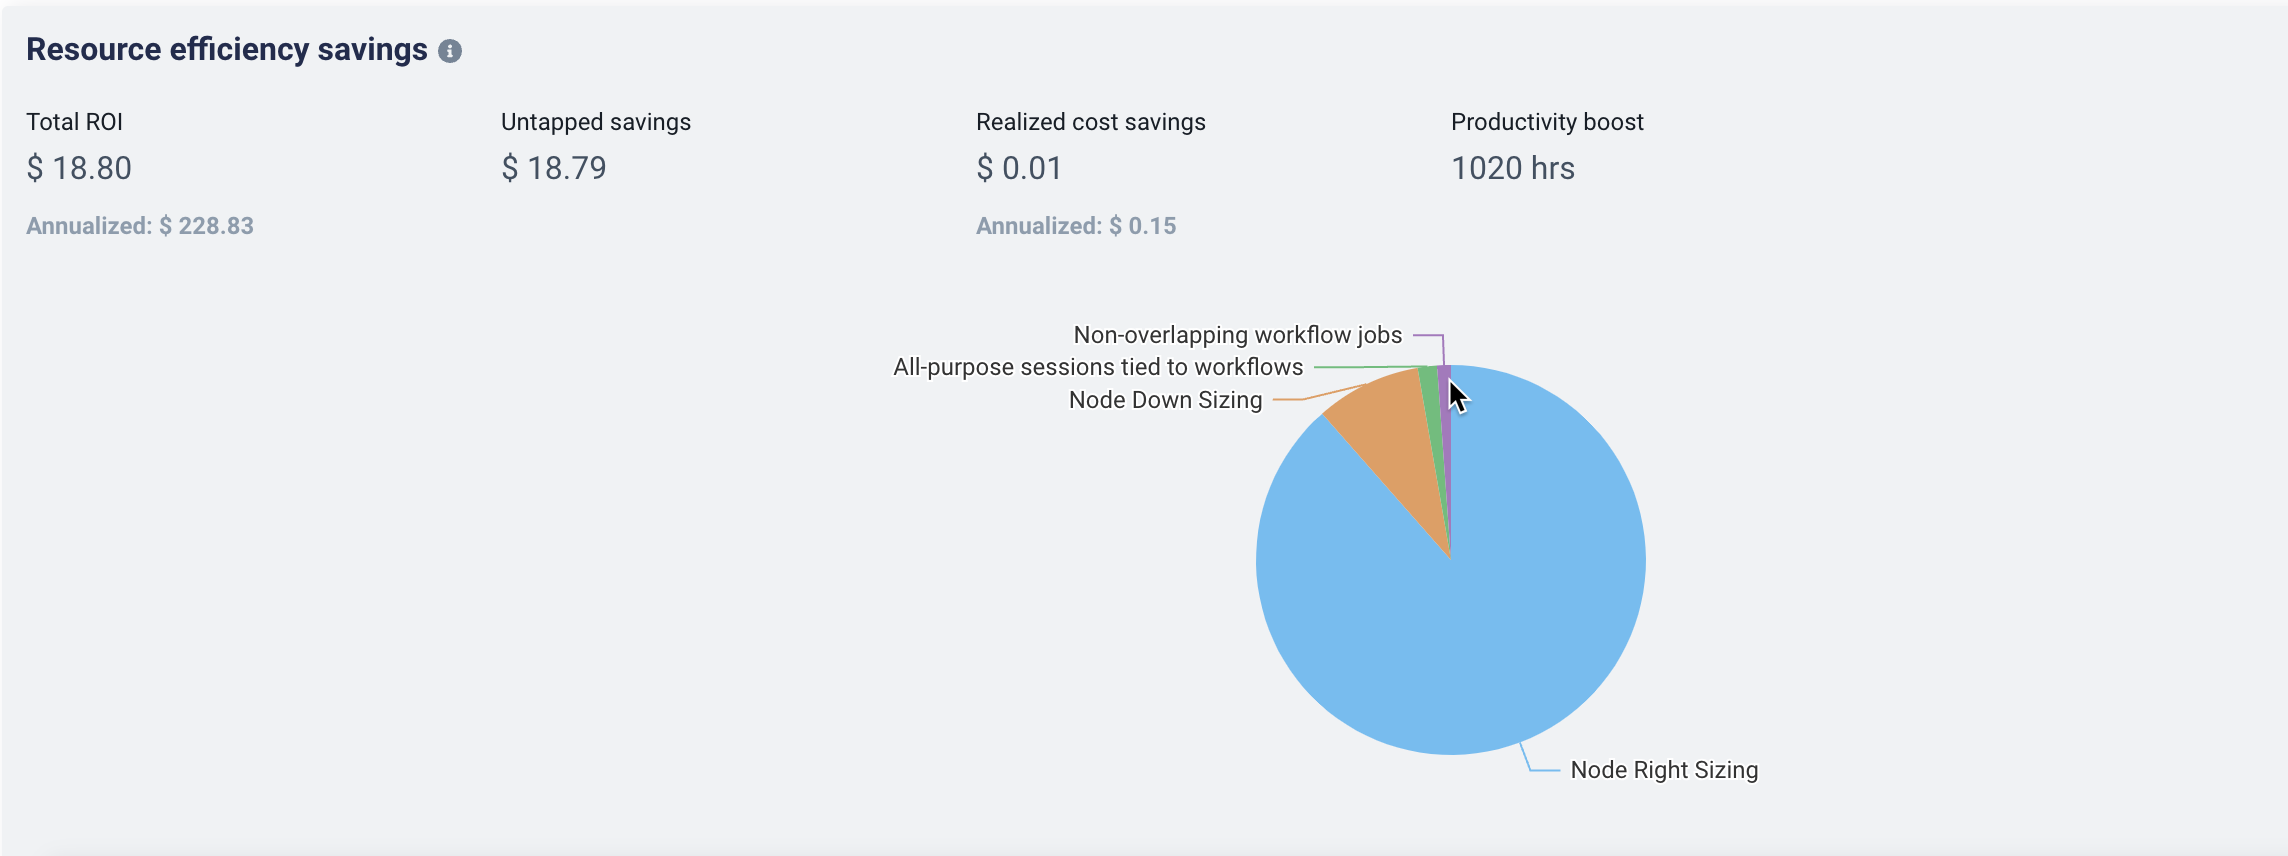
Scroll down to view the resource efficiency savings in the form of a visual representation. This chart gives you information of your potential savings, highlighting the contributions from resource scaling insights and migration strategies. At the top, you will find details on total ROI, annualized ROI, untapped savings, realized cost savings, annualized realized cost savings, and productivity boost hours with potential estimates based on action taken on the resource efficiency recommendations. For interactive or streaming jobs, the analysis considers the last 5 runs, while for automated jobs, it looks at data from the past 10 days.
Hover over the chart to view the potential savings and the percentage of savings for each of the recommendations.
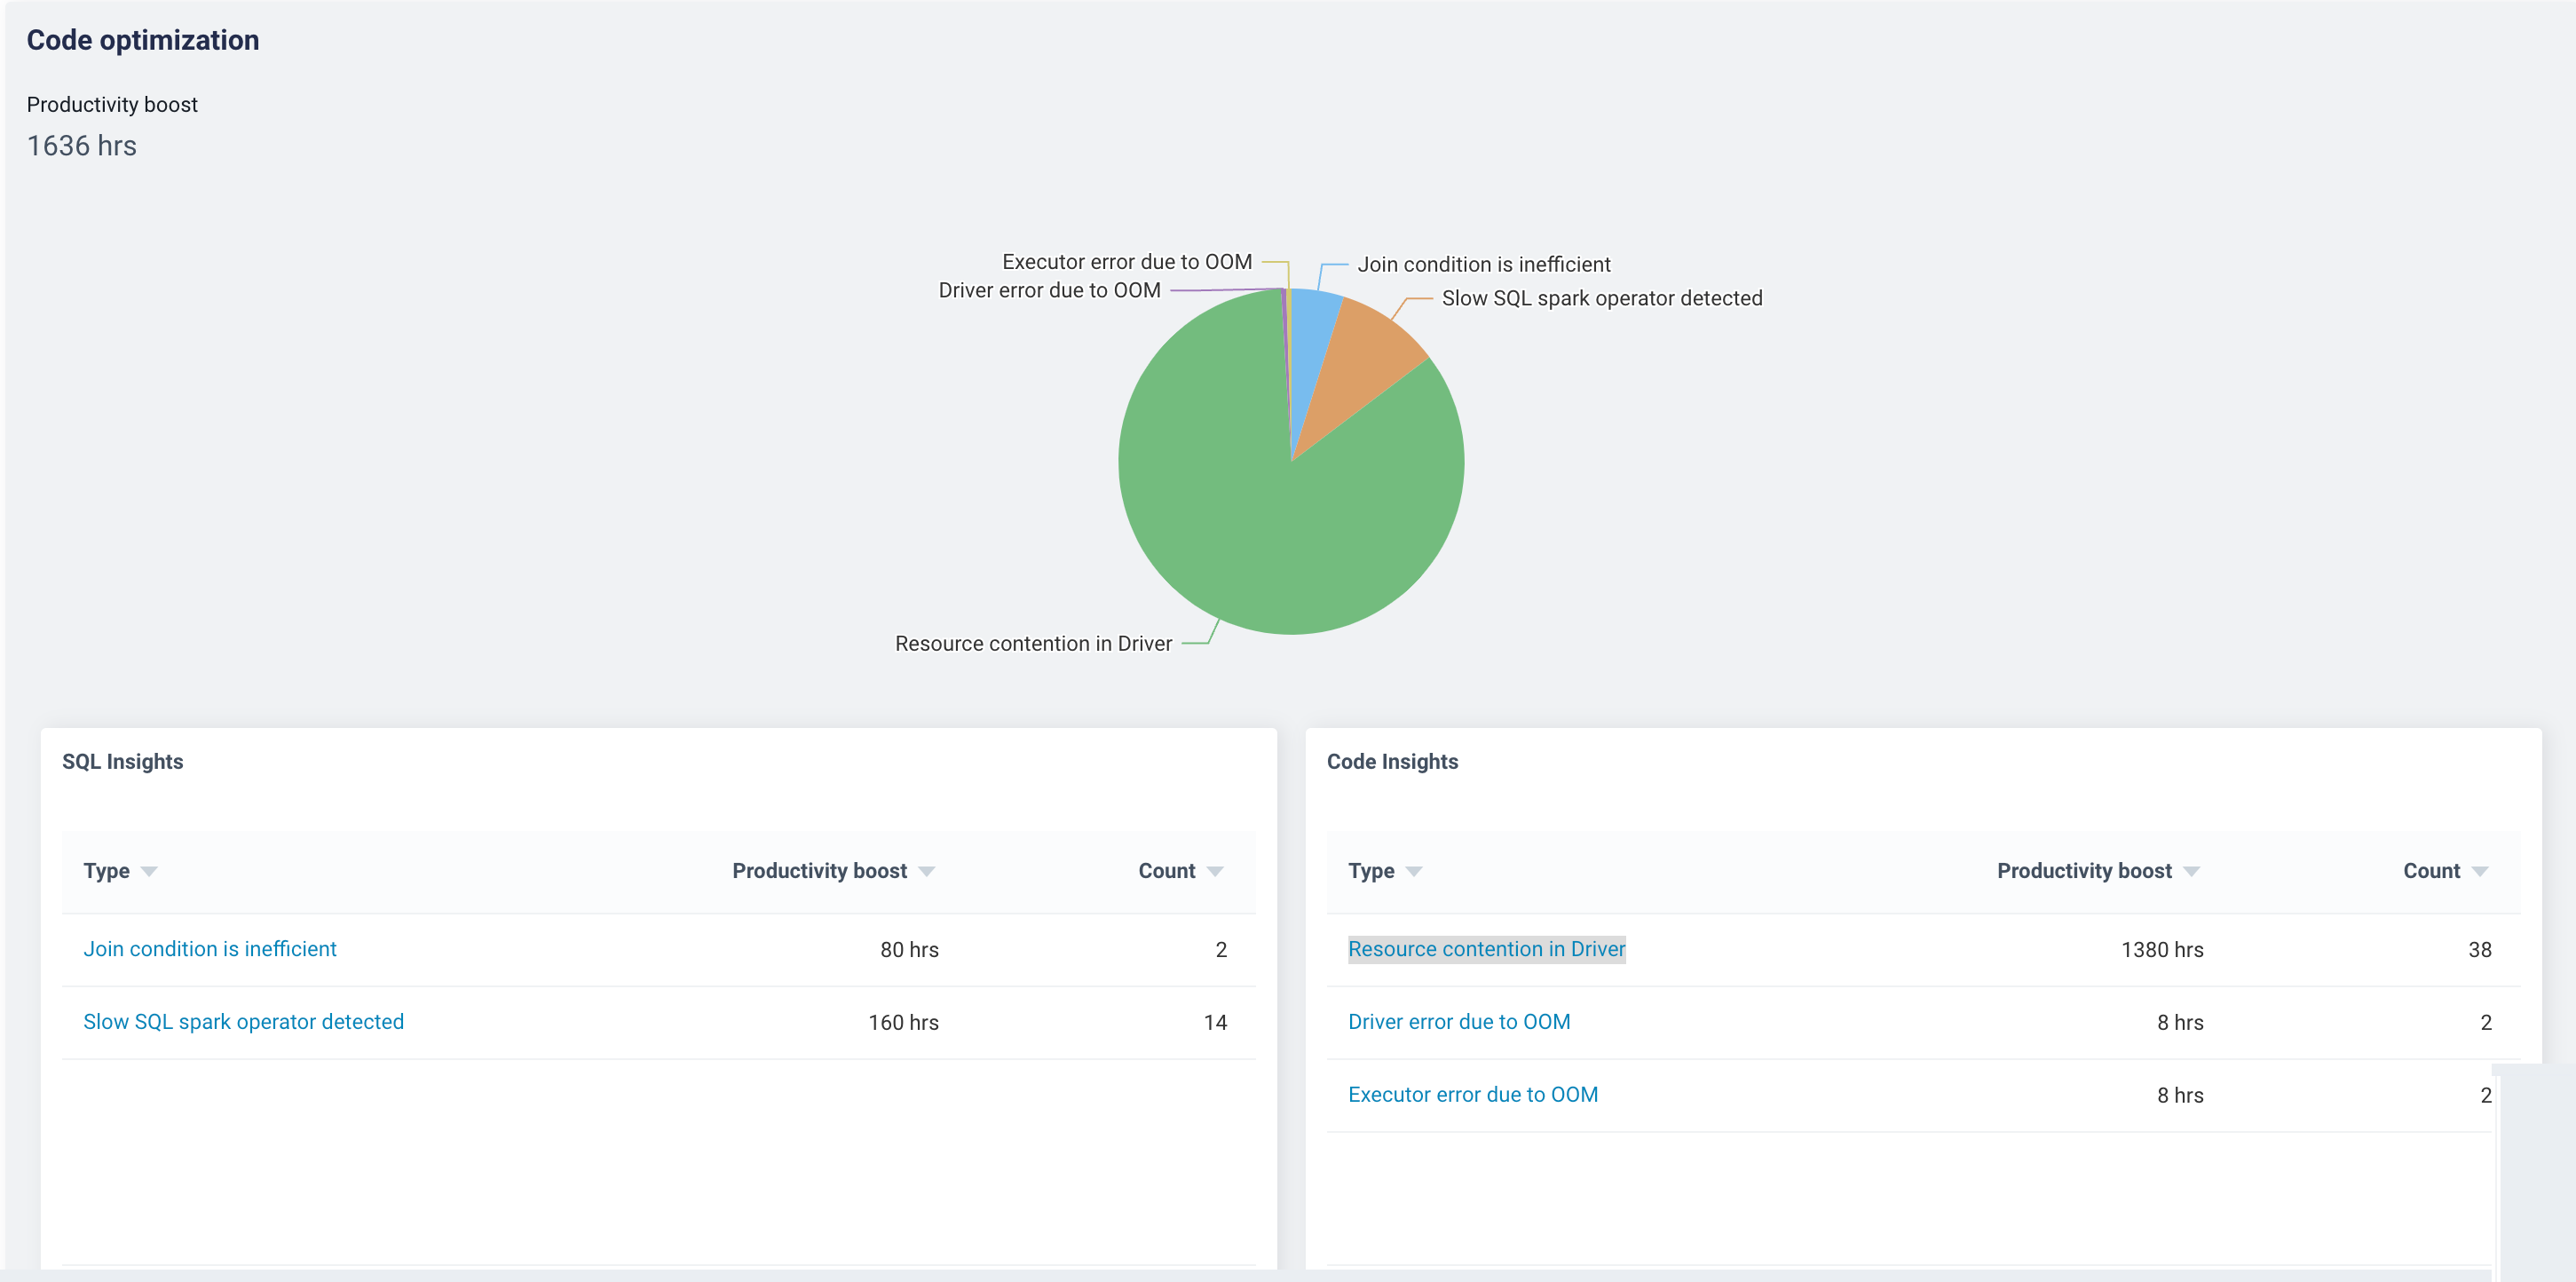
Scroll down further to view the Code Optimization details in the form of a visual representation. This chart gives information on the potential productivity boost in hours that can be achieved with code optimization based on the SQL insights and Code insights. Hover over the chart to view the potential productivity boost in hours and in percentage for each of the recommendations. The SQL insights and Code insights are also displayed in the form of a table. below the chart.