Chargeback (EMR) Preview
Notice
The Chargeback Preview tab is shown only for Amazon EMR clusters. You must provide your AWS accounts details in Unravel to view chargeback details. Refer to Add AWS account details in Unravel for EMR chargeback data and cluster insights.
Unravel provides Chargeback details for the EMR clusters. A detailed cost breakdown is provided for EMR, EC2, and EBS volume for each configured AWS account. In addition, cost-saving recommendations and suggestions are provided. To get a complete view into the EMR cluster costs, do the following:
On the Unravel UI, click Clusters > Chargeback.
Click the date picker
 on the right and select a period range.
Click in the Group By box and select a tag option. The chargeback report is generated, and the trends and chargeback details are displayed in the donut charts and tables.
Chargeback details in the table
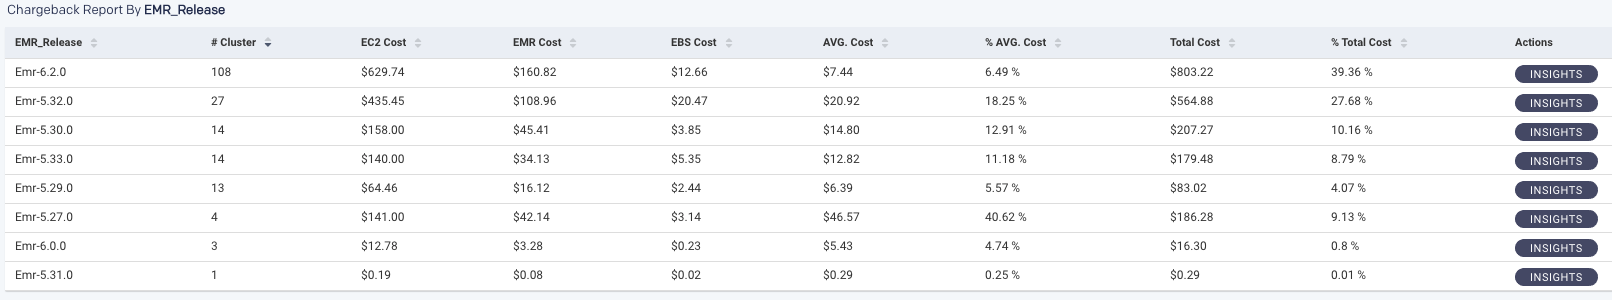
The chargeback report is also shown in a table:
Columns
Description
Group by option
Selected Group by option. The Group by option indicates the cluster tag.
# Cluster
Count of clusters in each of the selected cluster tags.
EC2 Cost
The cost incurred in USD for clusters on EC2.
EMR Cost
The cost incurred in USD for clusters computing on EMR.
EBS Cost
The cost incurred in USD for storage on EBS.
AVG. Cost
Average cost per cluster within each of the selected cluster tags.
% AVG. Cost
Percentage of average cost per cluster within each of the selected cluster tags.
Total Cost
The total cost incurred for each of the selected cluster tags.
% Total Cost
Percentage of the total cost incurred for each of the selected cluster tags.
Actions
Click Insights to view the EMR Insights page for a specific cluster tag where recommendations and suggestions are provided to reduce the costs for running jobs.
Click any row in this table, and the details of the clusters in the selected group by option are displayed.
Columns
Description
Purpose
Selected Group by option.
# Cluster
Count of clusters in each of the selected cluster tags.
EC2 Cost
The cost incurred in USD for clusters on EC2.
EMR Cost
The cost incurred in USD for clusters computing on EMR.
EBS Cost
The cost incurred in USD for storage on EBS.
Avg Costs/Cluster
Average cost per cluster within each group by option.
% Avg Costs/Cluster
Percentage of average cost per cluster within each group by option.
Total Cost
The total cost incurred for each group by option.
% Total Cost
Percentage of the total cost incurred for each group by option.
Actions
Click Insights
 to view the EMR Insights page for the specific group by option, where recommendations and suggestions are provided to reduce the costs for running jobs.
Click any row in this table, and the details of the clusters in the selected group by option are displayed.
Column
Description
Cluster ID
Unique ID of the cluster.
Cluster Name
Name of the cluster.
Created On
Date when the cluster was created.
State
Status of the cluster.
Cost Type
Type of cost
EC2 Cost
The total cost incurred for EC2 instances in a cluster.
EMR Cost
The total cost of EMR instances in a cluster.
EBS Cost
The total cost of EBS volumes in a cluster.
Total Cost
Total cost.
Actions
Click Jobs, which takes you to the Jobs > Applications page, where the details of all the jobs in a cluster are shown.
Trends in Donut chart
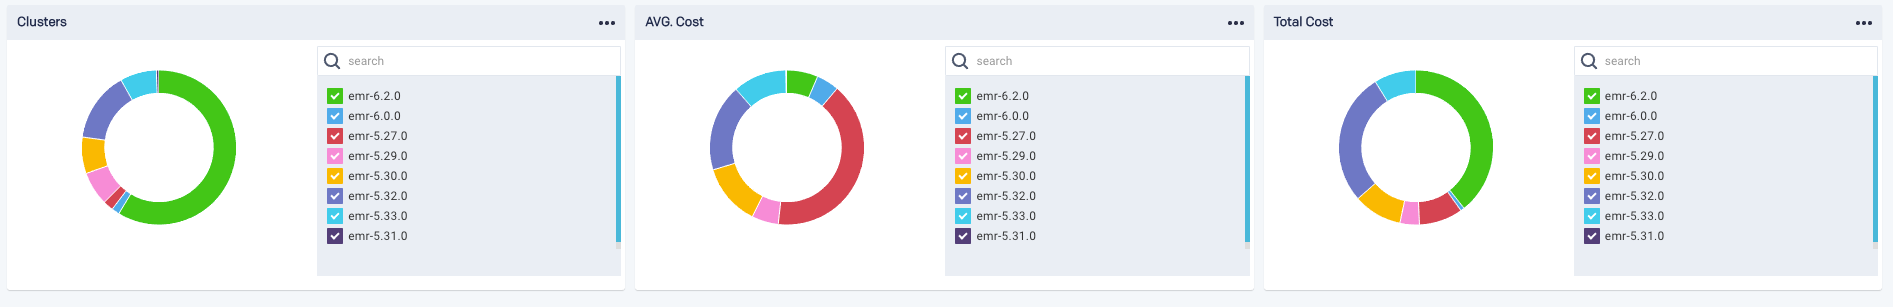
In the donut chart, the results are displayed for the following trends:
Cluster Count
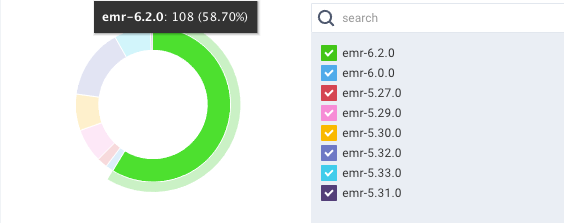
The cluster count trends, in percentage, for each group by tags are displayed in color-coded slices.
Avg. Cost/Cluster
The trending average cost per cluster for each group by tags is displayed in color-coded slices.
Total Cost
The total cost trends, in percentage, for each of the groups by tags are displayed in color-coded slices.
You can click any of the tag options on the right of the chart and toggle the display on the donut chart. Hover over any slice of the donut chart to view the details.
Note
Null is listed against those clusters that do not have any associated tags or which have tags but with empty tag values.