Chargeback (Databricks)
Note
This tab is visible only for Databricks clusters.
From this tab, you can create and view the Chargeback reports for Databricks clusters and job runs.
Generate chargeback report for Databricks clusters
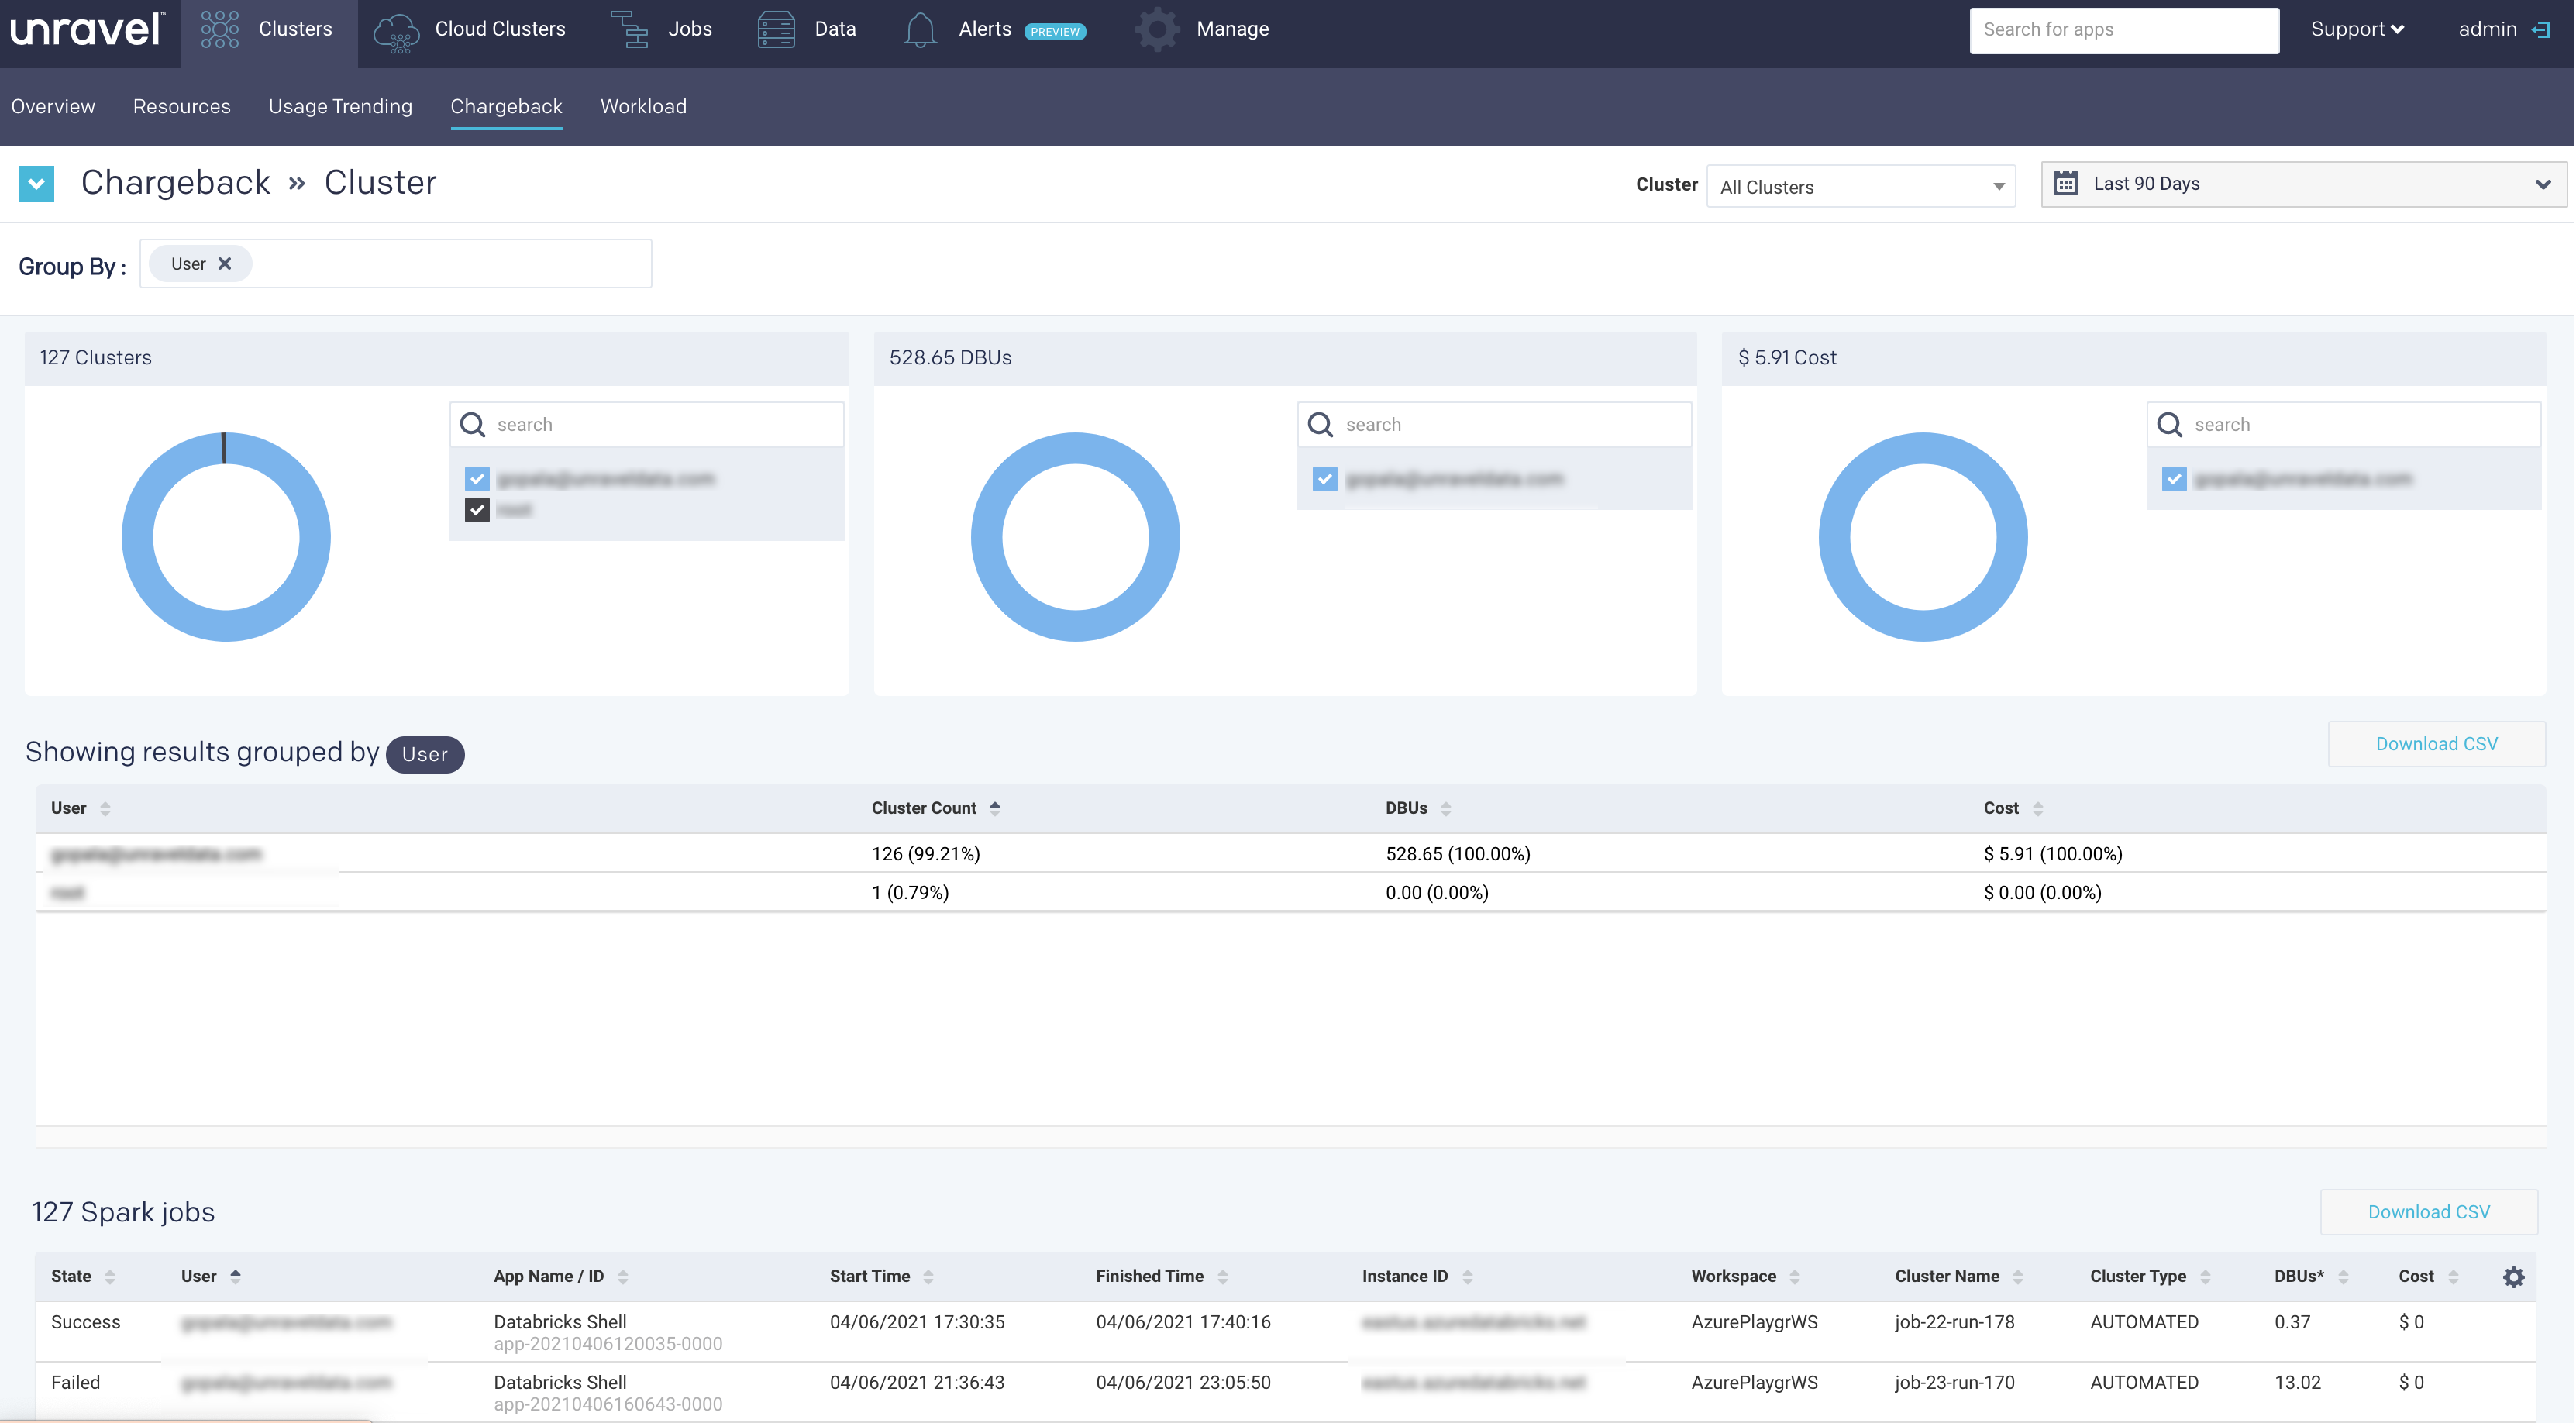
From the Chargeback drop-down on the upper left corner, select Cluster.
Use the Cluster and date picker pull-down menus to select a specific cluster or change the date range.
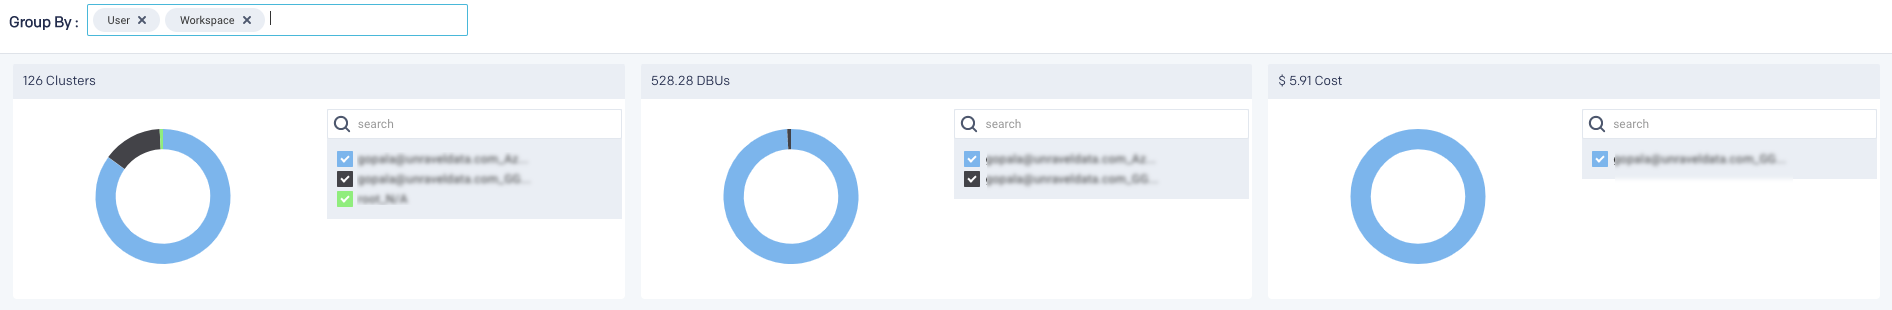
Click in the Group By box and select an option; User or Workspace or both. You can click
 next to the option to deselect an option. The details of the Cluster chargeback report are displayed in the following formats:
Donut charts: The donut charts show the top results of the users and workspaces for Clusters, DBUs, and Cost.
Hover over a donut section to see the slice name, the value, and the percentage of the whole.
Note
There are times when a job run cannot be grouped by the selected option. In such cases, they are listed as NA.
Tables: The chargeback report details are displayed in a table based on the selected options; workspace or user.
Columns
Description
User/Workspace
The selected Group by option.
Cluster count
The total active cluster count for the selected Group by option in units and percentage.
DBUs
Total DBU consumed by the selected Group by option in units and percentage.
Cost
Cost calculated based on the estimated run durations of the underlying instances, DBUs, and VM price components only. Storage costs are not included. The actual cost may differ.
Click any user or workspace in the list and you can further drill down into the details of the selected user or workspace in the Job table. The following table provides a description of the columns in the Job table:
Columns
Description
Status
color-coded status of the application.
User
The username that submitted the job run.
App Name/ ID
Name or ID of the app where the job was run.
Start Time
Start time of the job run.
Finished Time
End time of the job run.
Instance ID
Name of the Databricks instance.
Workspace
Workspace of the job run.
Cluster Name
Name of the cluster.
Cluster Type
Type of the cluster. Automated / Interactive
DBUs
Units consumed in a specified time.
Cost
Cost calculated based on the estimated run durations of the underlying instances, DBUs, and VM price components only. Storage costs are not included. The actual cost may differ.
Generate chargeback report for Databricks job runs
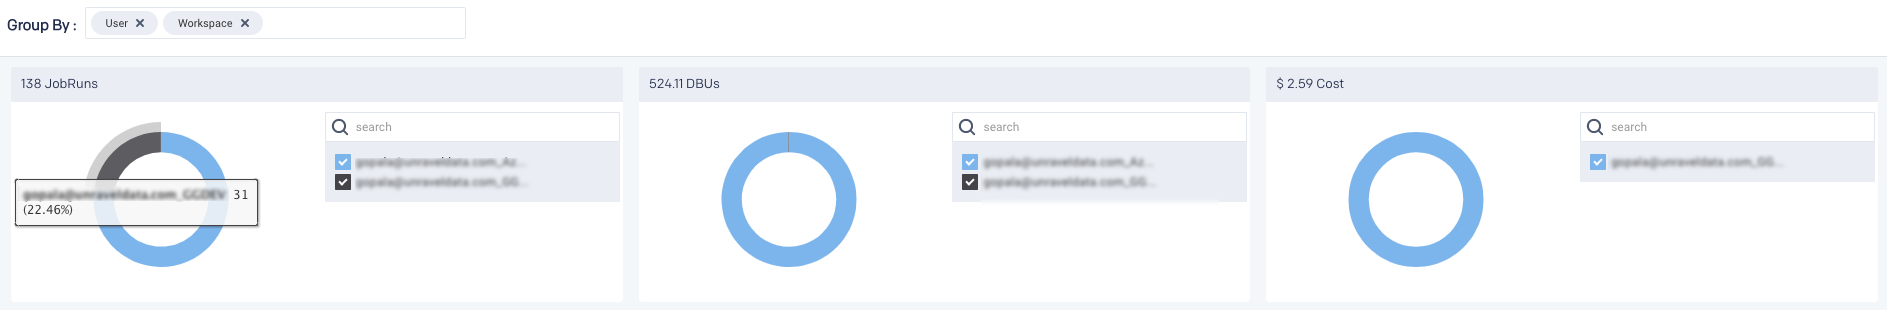
From the Chargeback drop-down on the upper left corner, select JobRun.
Use the Cluster and date picker pull-down menus to select a specific cluster or change the date range.
Click in the Group By box and select an option; either User or Workspace. You can click
next to the option to deselect an option. The details of the chargeback report are displayed in the following formats:Donut charts: The donut charts show the top results of the users and workspaces for JobRuns, DBUs, and Cost.
Hover over a donut section to see the slice name, the value, and the percentage of the whole.
Note
There are times when a job run cannot be grouped by the selected option. In such cases they are listed as NA.
Tables: The chargeback report details are displayed in a table based on the selected options; workspace or user.
Columns
Description
User/Workspace
The selected Group by option.
JobRun count
The total job runs for the selected Group by option in units and percentage.
DBUs
Total DBU consumed by the selected Group by option in units and percentage.
Cost
Cost calculated based on the estimated run durations of the underlying instances, DBUs, and VM price components only. Storage costs are not included. The actual cost may differ.
Click any user or workspace in the list and you can further drill down into the details of the selected user or workspace in the JobRuns table. The following table provides a description of the columns in the JobRuns table:
Columns
Description
Status
color-coded status of the application.
User
The username that submitted the job run.
App Name/ ID
Name or ID of the app where job was run.
Start Time
Start time of the job run.
Finished Time
End time of the job run.
Instance ID
Name of the Databricks instance.
Workspace
Workspace of the job run.
Cluster Name
Name of the cluster.
Cluster Type
Type of the cluster. Automated / Interactive
DBUs
Units consumed in a specified time.
Cost
Cost calculated based on the estimated run durations of the underlying instances, DBUs, and VM price components only. Storage costs are not included. The actual cost may differ.