Overview
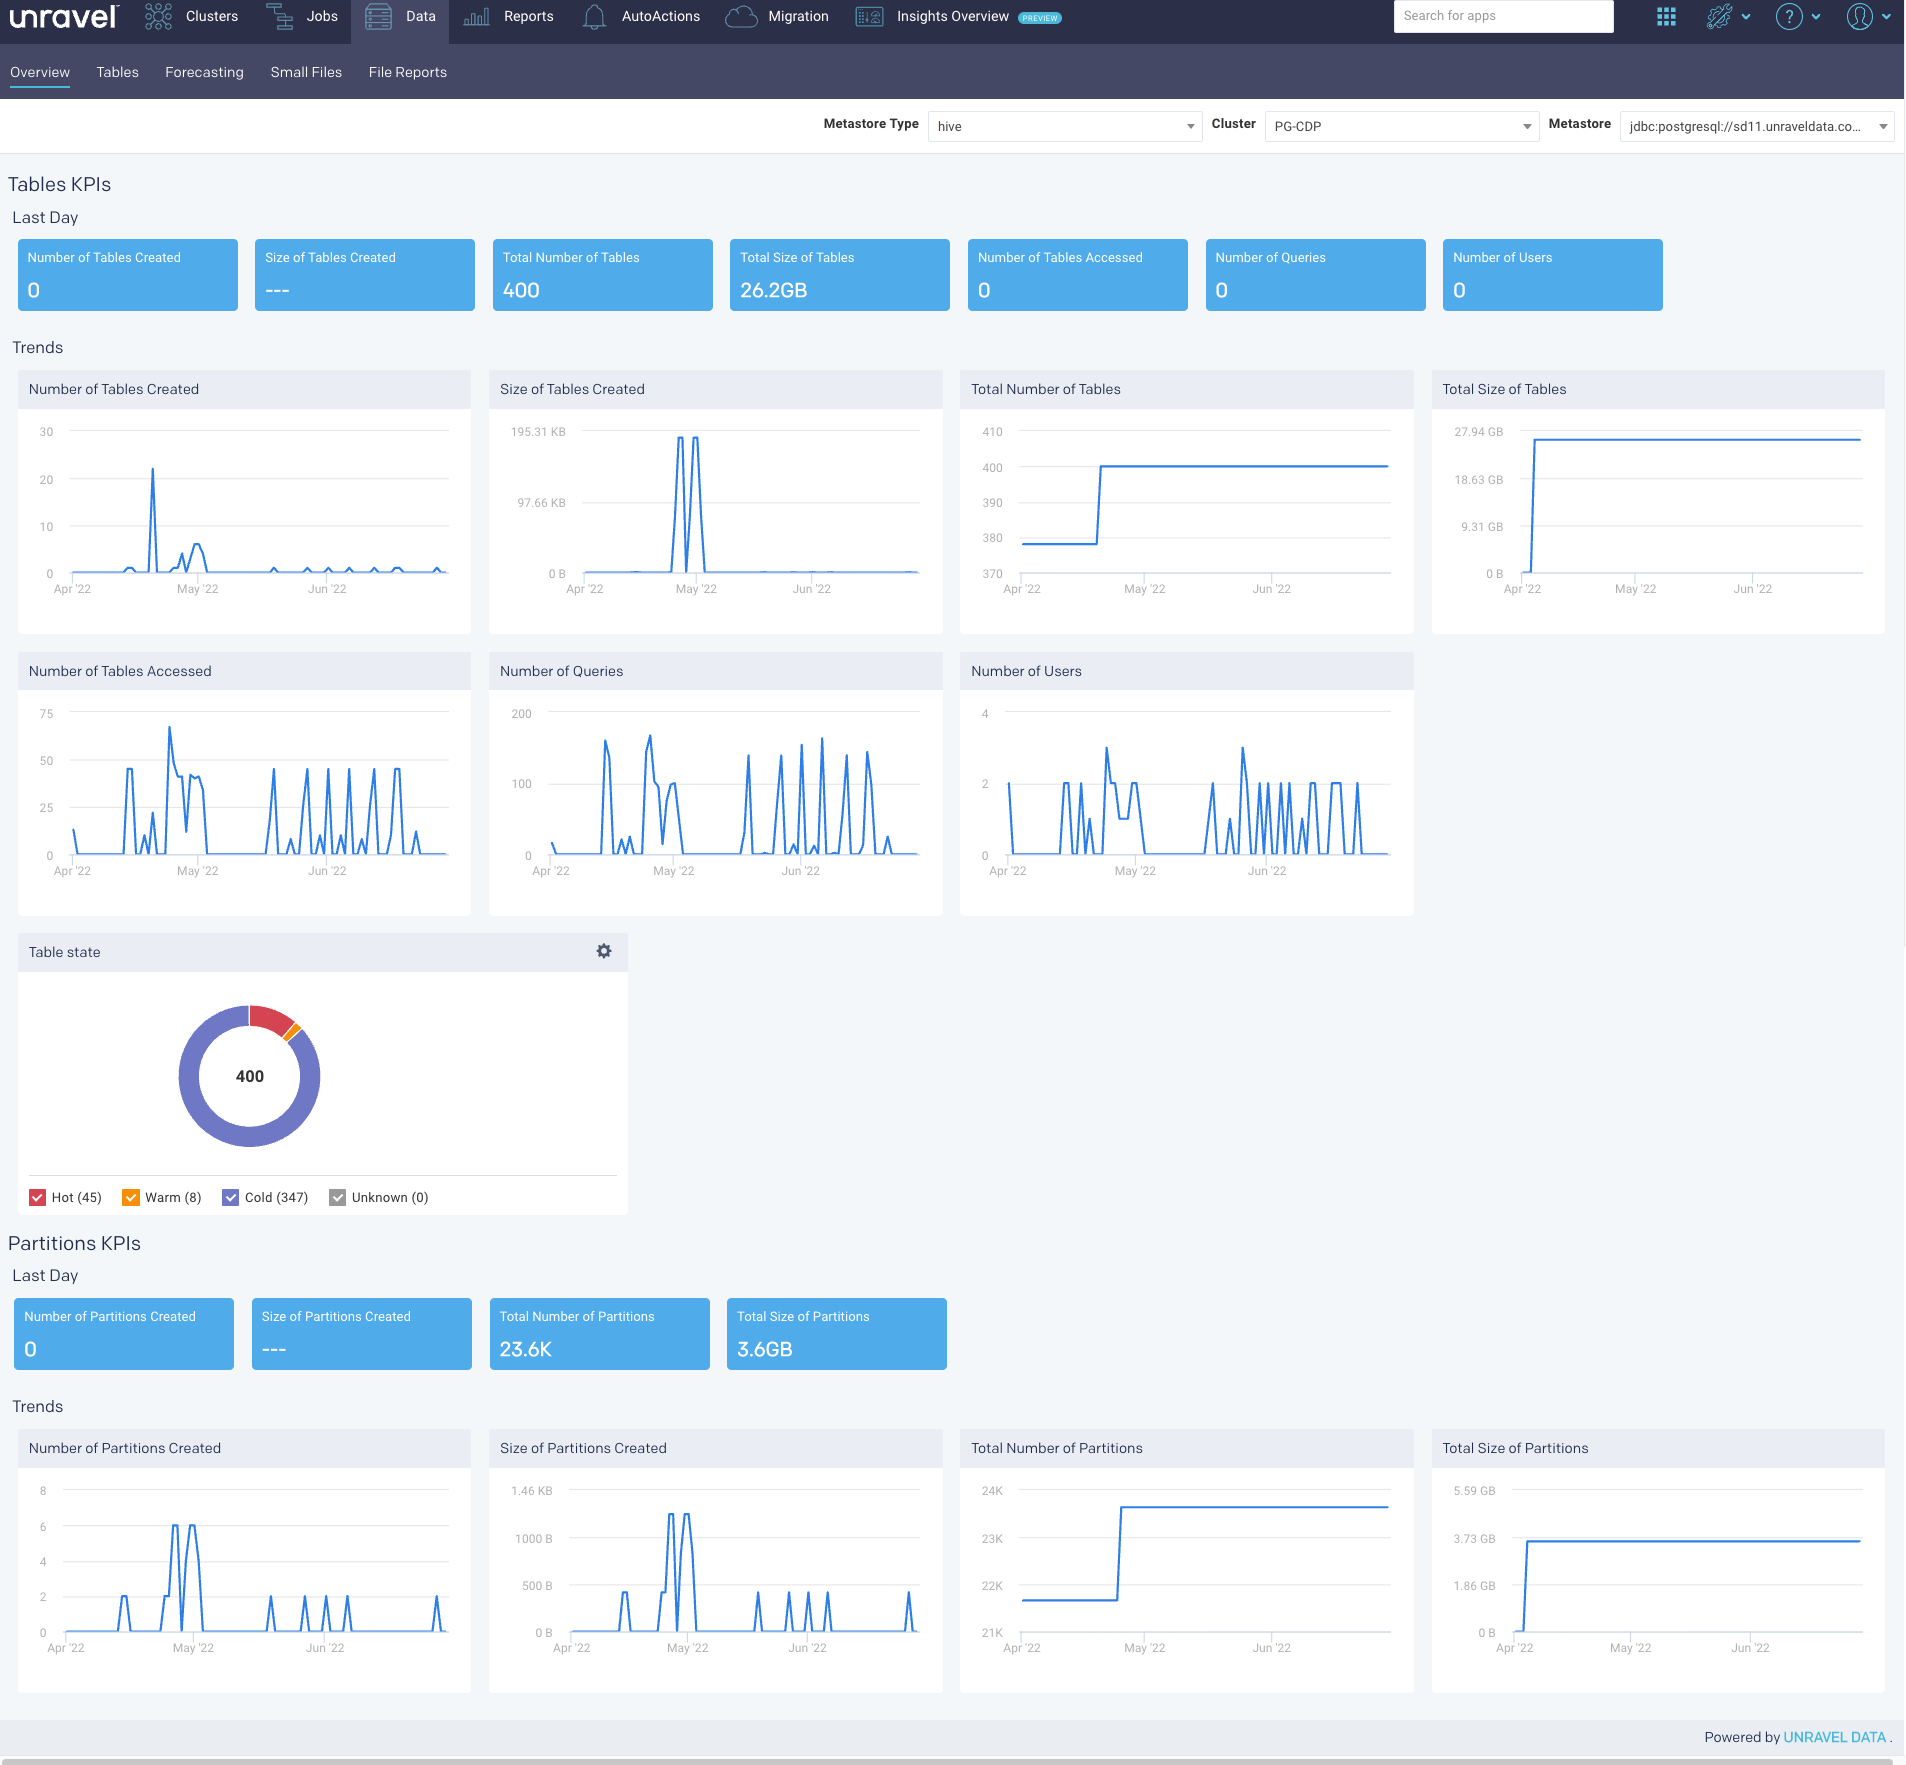
The Overview tab provides a quick view of the tables' and partitions' sizes, usage, and KPIs with corresponding graphs. The following sections are included in this tab:
Selecting a cluster in Datapage overview
Go to the Data > Overview tab.
From the Cluster drop-down, select a cluster. By default, the first cluster on the drop-down cluster list is selected. To access a different cluster, select a different one from the drop-down list. For a given cluster, the corresponding metastore is automatically selected.
Tables KPIs and Trends
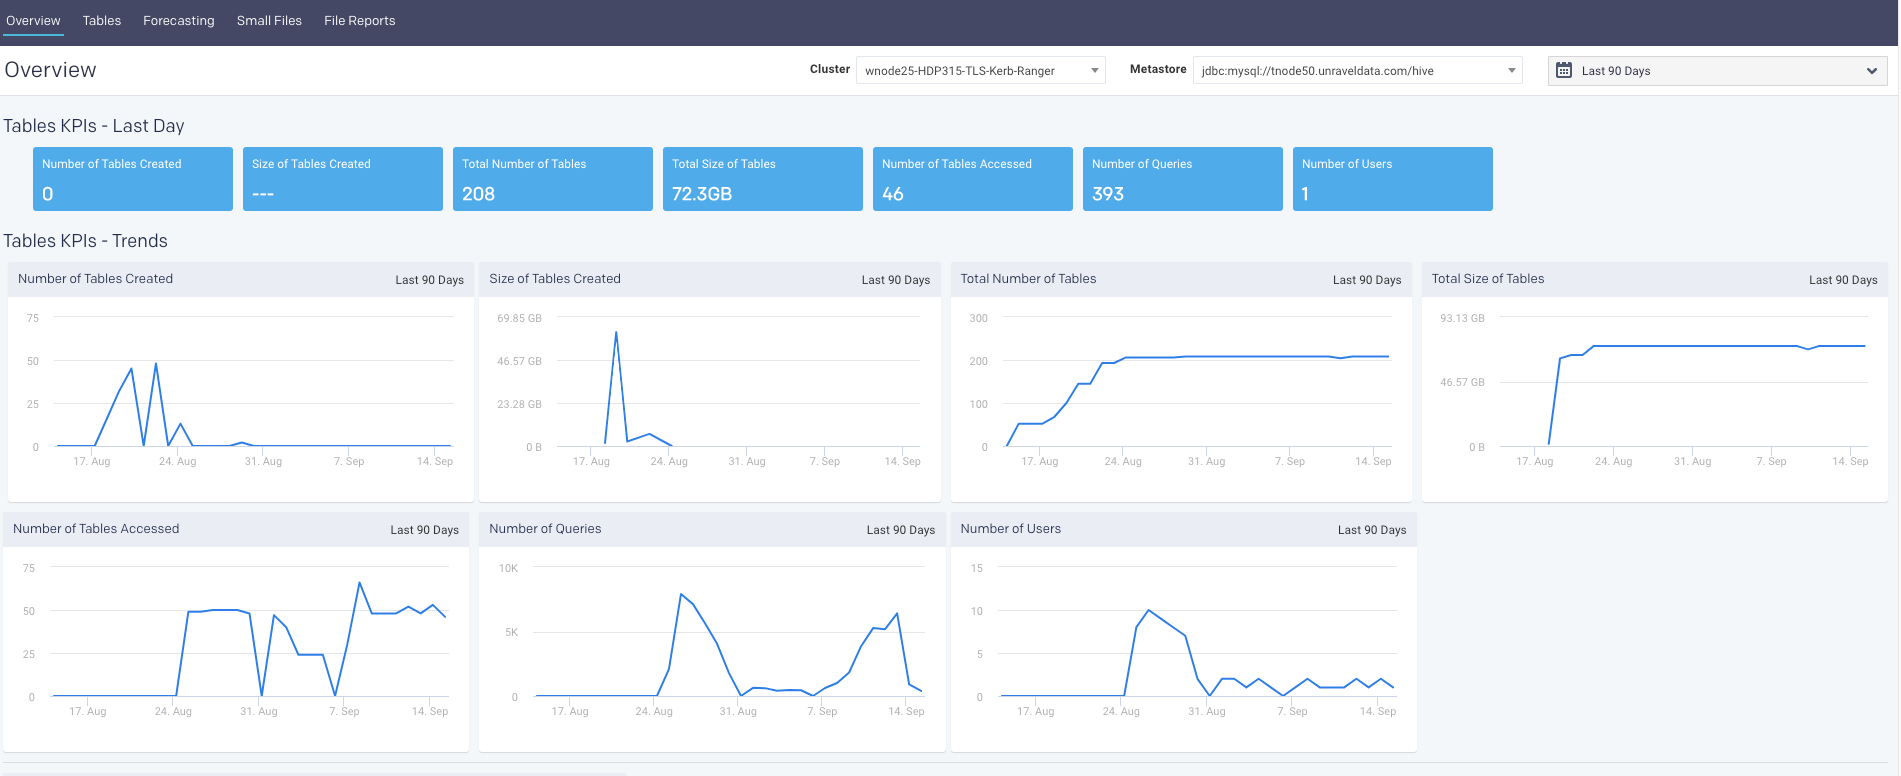
Table KPIs and trends
The following table KPIs are shown for both the last day and the last 90 days in a trend.
KPI | Description |
|---|---|
Number of Tables Created | Number of tables created for that time period. |
Size of Tables Created | The size of all the tables created for that time period. |
Total Number of tables | Total number of tables in the system for that time period. |
Total size of Tables | The size of all tables in the system for that time period. |
Number of Tables Accessed | Number of tables that are accessed for that time period. |
Number of Queries | Total number of queries that accessed the tables within the system, for that time period. |
Number of Users | Number of users who have accessed the tables for that time period. |
Table state
You can define a color-coded heat label for the tables, that is, Hot ( ), Warm (
 ), Cold (
 ). The uncategorized tables are listed as Unknown (
 . The temperatures are defined based on the following parameters:
Age: the period since the table was created.
Last App Access: The last time the table was accessed by an application.
To define a heat label for the table:
Go to Data > Overview > Table state section.
Click
 . The Label Tables dialog is displayed.
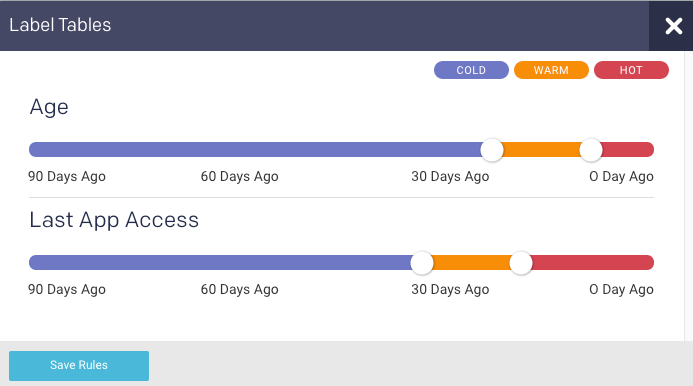
Move the color-slider to set the period for the tables to be defined under a specific color-coded heat label.
Click Save Rules. The corresponding donut chart displays the proportion of tables that are in the defined Hot (
), Warm (), and Cold () states.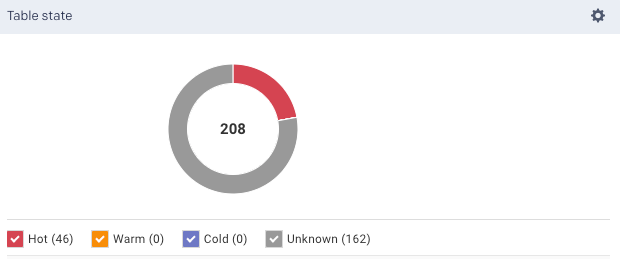
These states of a table are classified based on the following logic:
A table is marked as
Unknown when either Age or Last App Access is unknown.When both the metrics are known, then the following logic is applied:
A table is Hot (
) when at least one of the metrics (Age or Last App Access) is hot.A table is Warm (
) when both metrics (Age and Last App Access) are warm, or when one is warm and the other is cold.A table is Cold (
) when both metrics (Age and Last App Access) are cold.
Partition KPIs and Trends
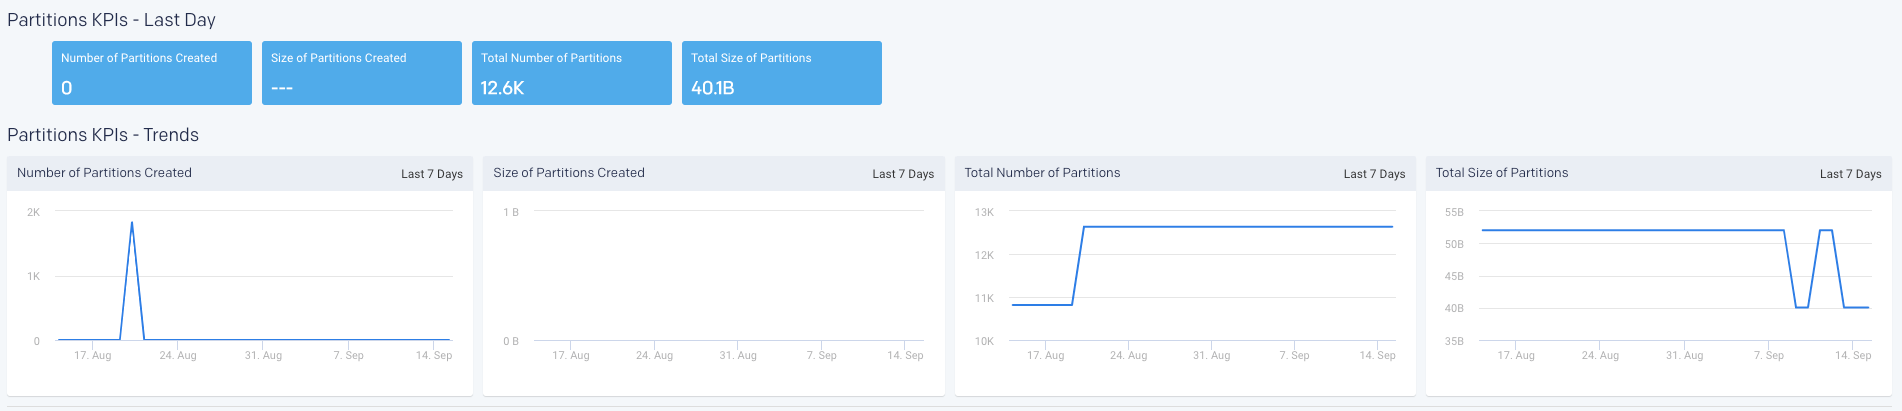
Partition KPIs and trends
The following partition KPIs are shown for both the last day and the last 90 days in a trend.
KPI | Description |
|---|---|
Number of Partitions Created | Number of partitions created for that time period. |
Size of Partitions Created | The accumulated size of all the partitions created for that time period. |
Total Number of Partitions | Total Number of partitions currently in the system for that time period. |
Total size of Partitions | The accumulated size of all partitions in the system for that time period. |