Tables
You can check the current information for each table in the metastore type for a selected workspace and metastore from the Tables tab. The following details are shown:
Users accessing the tables
Number of applications accessing the tables
Number of partitions in a table
Types of applications accessing the tables
Table metadata
Table size
Tables running in (hot, warm, cold, and unknown states)
Total number of tables in a cluster
Recommendations and insights for the table
Configuring Tables report
Refer to Data Page configurations and ensure that the configurations for Unity Catalog, and Hive Metastore connection are set.
Viewing table details
Go to the Data > Tables tab.
From the Metastore Type drop-down, select either Unity Catalog, Hive , or BigQuery.
From the Cluster/Workspaces/Project Id drop-down, select a cluster/workspace/project Id.
From the Metastore drop-down, choose a metastore.
Select a metastore option. A list of tables is displayed with the following metadata. The total tables for the selected cluster and metastore are displayed on the left
 . You can click the Download CSV
  icon to export a list of tables in a CSV format. You can download a maximum of up to 1000 tables.
Click
 in the table header to add or remove the columns in the table.
Metadata
Description
Catalog (Unity Catalog)
Name of the catalog.
Dataset (Unity Catalog)
Name of the dataset.
Database (Hive)
Name of the database where the table is stored.
Table
Name of the table.
Owner
Owner of the table.
Path
Location of the table. Hover over to view the complete path.
Table Type
Type of the table.
File System
The file system that is used to store the table. Hover over to view the source of the table. For example, metastore or apps.
Storage Format
The format in which the table is stored. For example, text, ORC, PARQUET.
Hover over to view the source of the table and the last updated time of this field.
Created
Date and time when the table was created. Hover over to view the source of the table and the last updated time of this field.
Latest Access
Date and time when the table was last accessed. Hover over to view the source of the table and the last updated time of this field
Size (Hive)
Size of the table.
Apps
The type of app accessing the tables. Hover over to view various apps accessing the tables and the last updated time of this field.
Partitions (Hive)
Number of partitions in a table.
Users
Number of users accessing the table.
More Info
Click
 to access more information about the selected table.
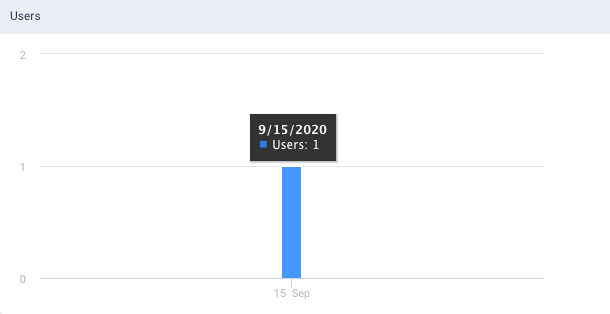
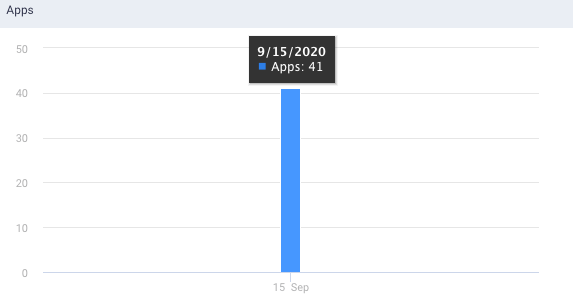
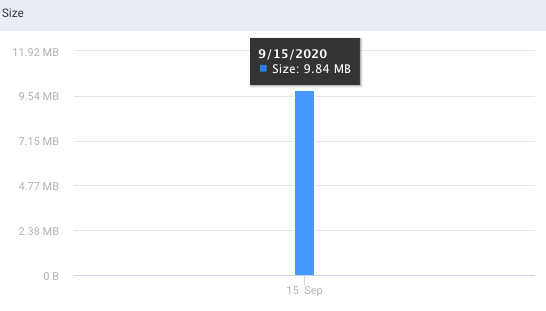
Select the checkbox corresponding to a table for which you want to view the details. The following graphs are updated based on the selection:
Users: This graph plots the number of users who access the tables on a given day.
Apps: This graph plots the number of applications that access the tables on a given day.
Size: This graph plots the table size on a given day.
Search and filter tables
In the Search box, you can enter the name of the table and click  , the corresponding tables are displayed.
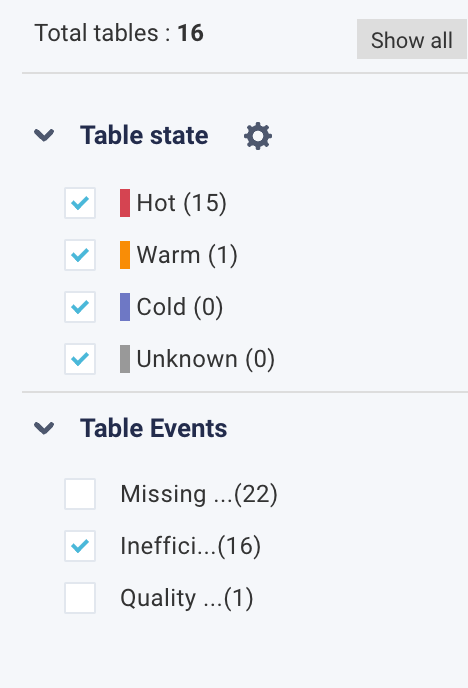
To filter the tables using the heat map labels and table events, do the following:
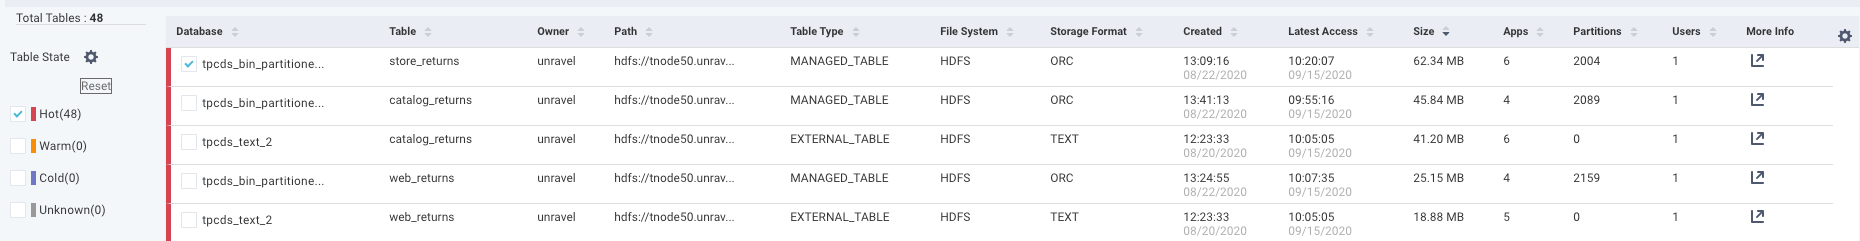
Go to Data > Tables > Table state section.
From the Table State on the left, select any of the following heat labels. You can also choose any of the events listed under Table Events.
The tables matching the corresponding heat labels are listed in the table. Here, the Hot option was selected, and the corresponding tables, color-coded with a red line on the left, are shown. Click the Reset button to discard the filters.
Optionally, you can define the heat labels for the table and click
in the Table State section. The Label Tables dialog is displayed.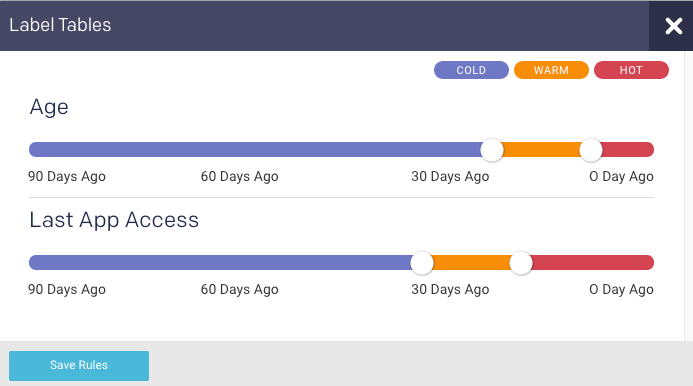
Move the color-slider to set the period for the tables to be defined under a specific color-coded heat label. The filter results are displayed. Click Download CSV to download the search results in CSV format. Click
in the More Info column for more details about the table.
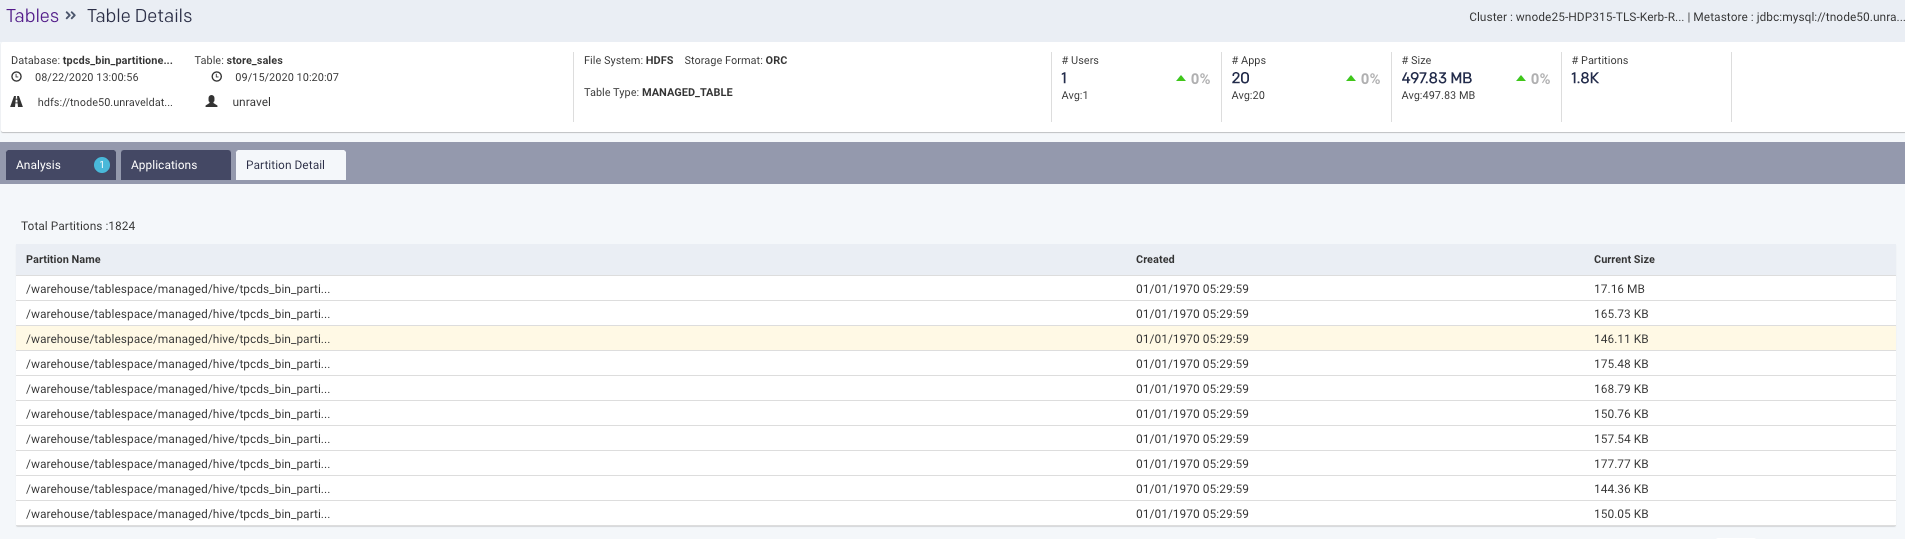
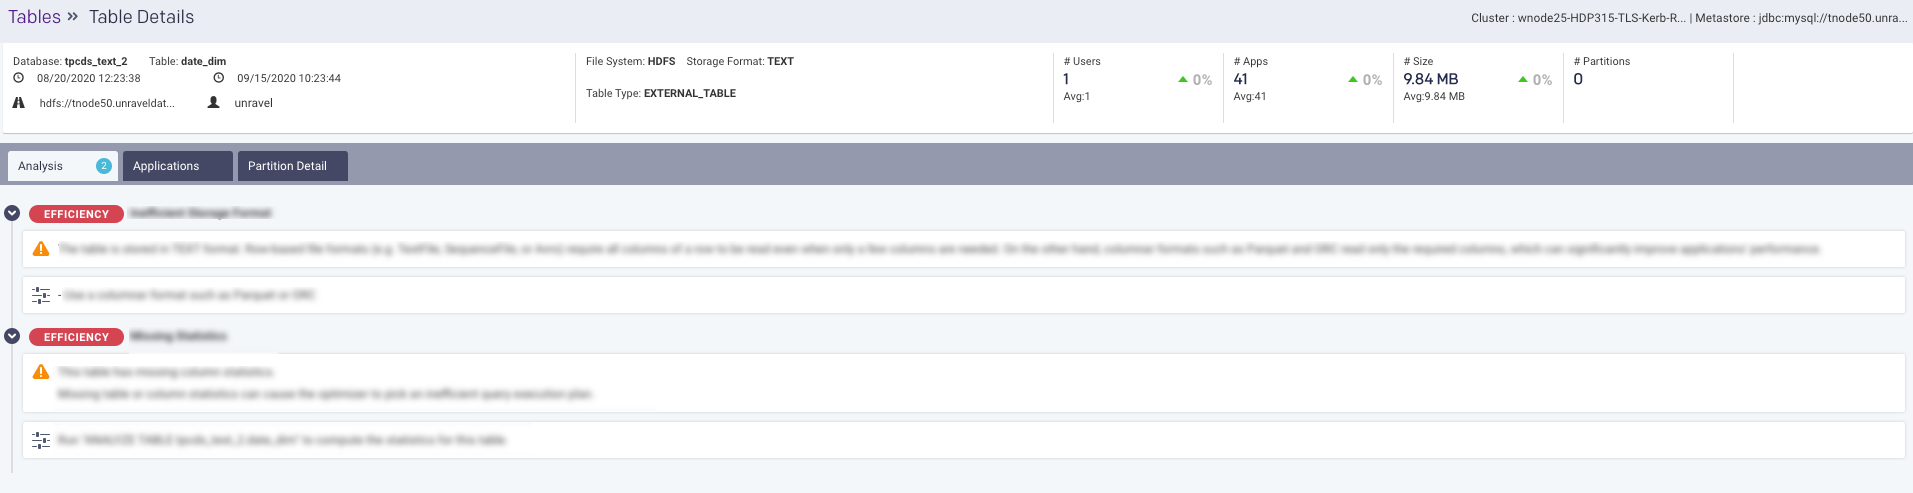
Click to view more details of the table. The following Table Details page is displayed.
This page displays all the metadata as shown in the Tables tab, along with the following tabs:
Analysis: This tab provides recommendations and insights for the selected table.
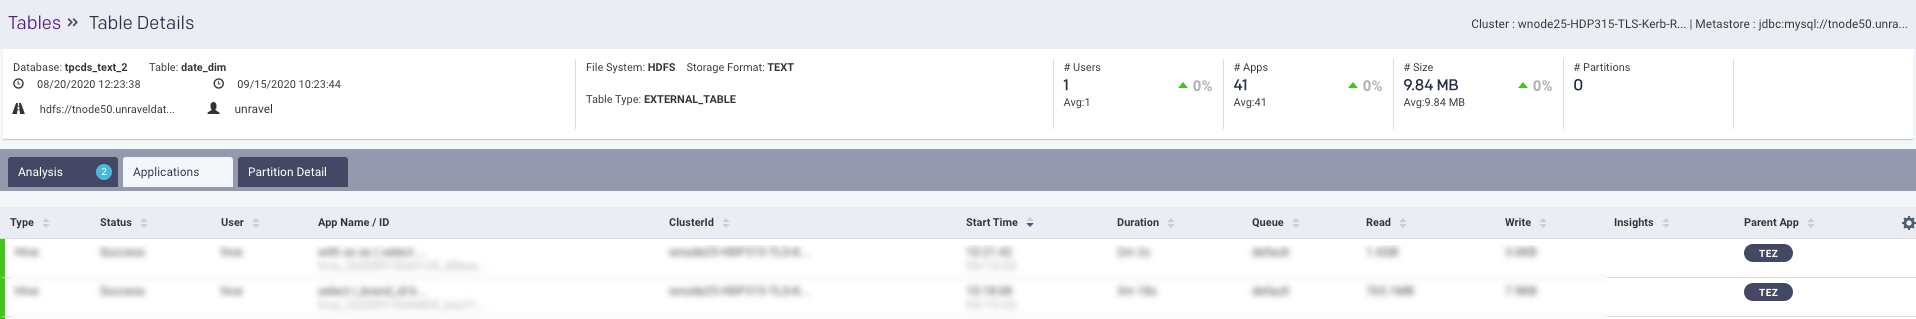
Applications: This tab provides the list of applications that are accessing the selected table and their corresponding details.
Partitions Detail: This tab displays all the details of the partitions in the selected table. All the partitions are listed along with the name of the partition, the date when the partition was created, and the current size of the partition.
Note
This is not applicable to Snowflake.