Hive Applications
The Hive Applications app provides a view of all Hive queries executed within a selected time range. It displays key details about each query, such as execution times, resource usage, and processing status. This app enables users to monitor query activity, track resource consumption, and gain insights into the efficiency of Hive operations.
Track Query Execution
Use the Start Time and Duration columns to monitor execution times and identify slow queries.
Understand Resource Usage
Analyze the Total DFS Bytes Read and Total DFS Bytes Write metrics to assess data volume processed by each query.
Monitor Queue and Cluster Performance
Review the Queue and Cluster ID columns to ensure optimal workload distribution across clusters.
Resolve Issues
Use the Status column to identify queries that are stuck, failed, or taking unusually long.
Installing and Opening the Hive Applications app
Refer to Installing and accessing the apps.
Using the Hive Applications app
On the Unravel UI, from the upper-right corner, click
 . The App Store page is displayed.
Click the Hive Applications image to open the app.
Select a time range and click Submit. The Hive Applications dashboard is displayed in the form of a table. The table contains the following metrics:
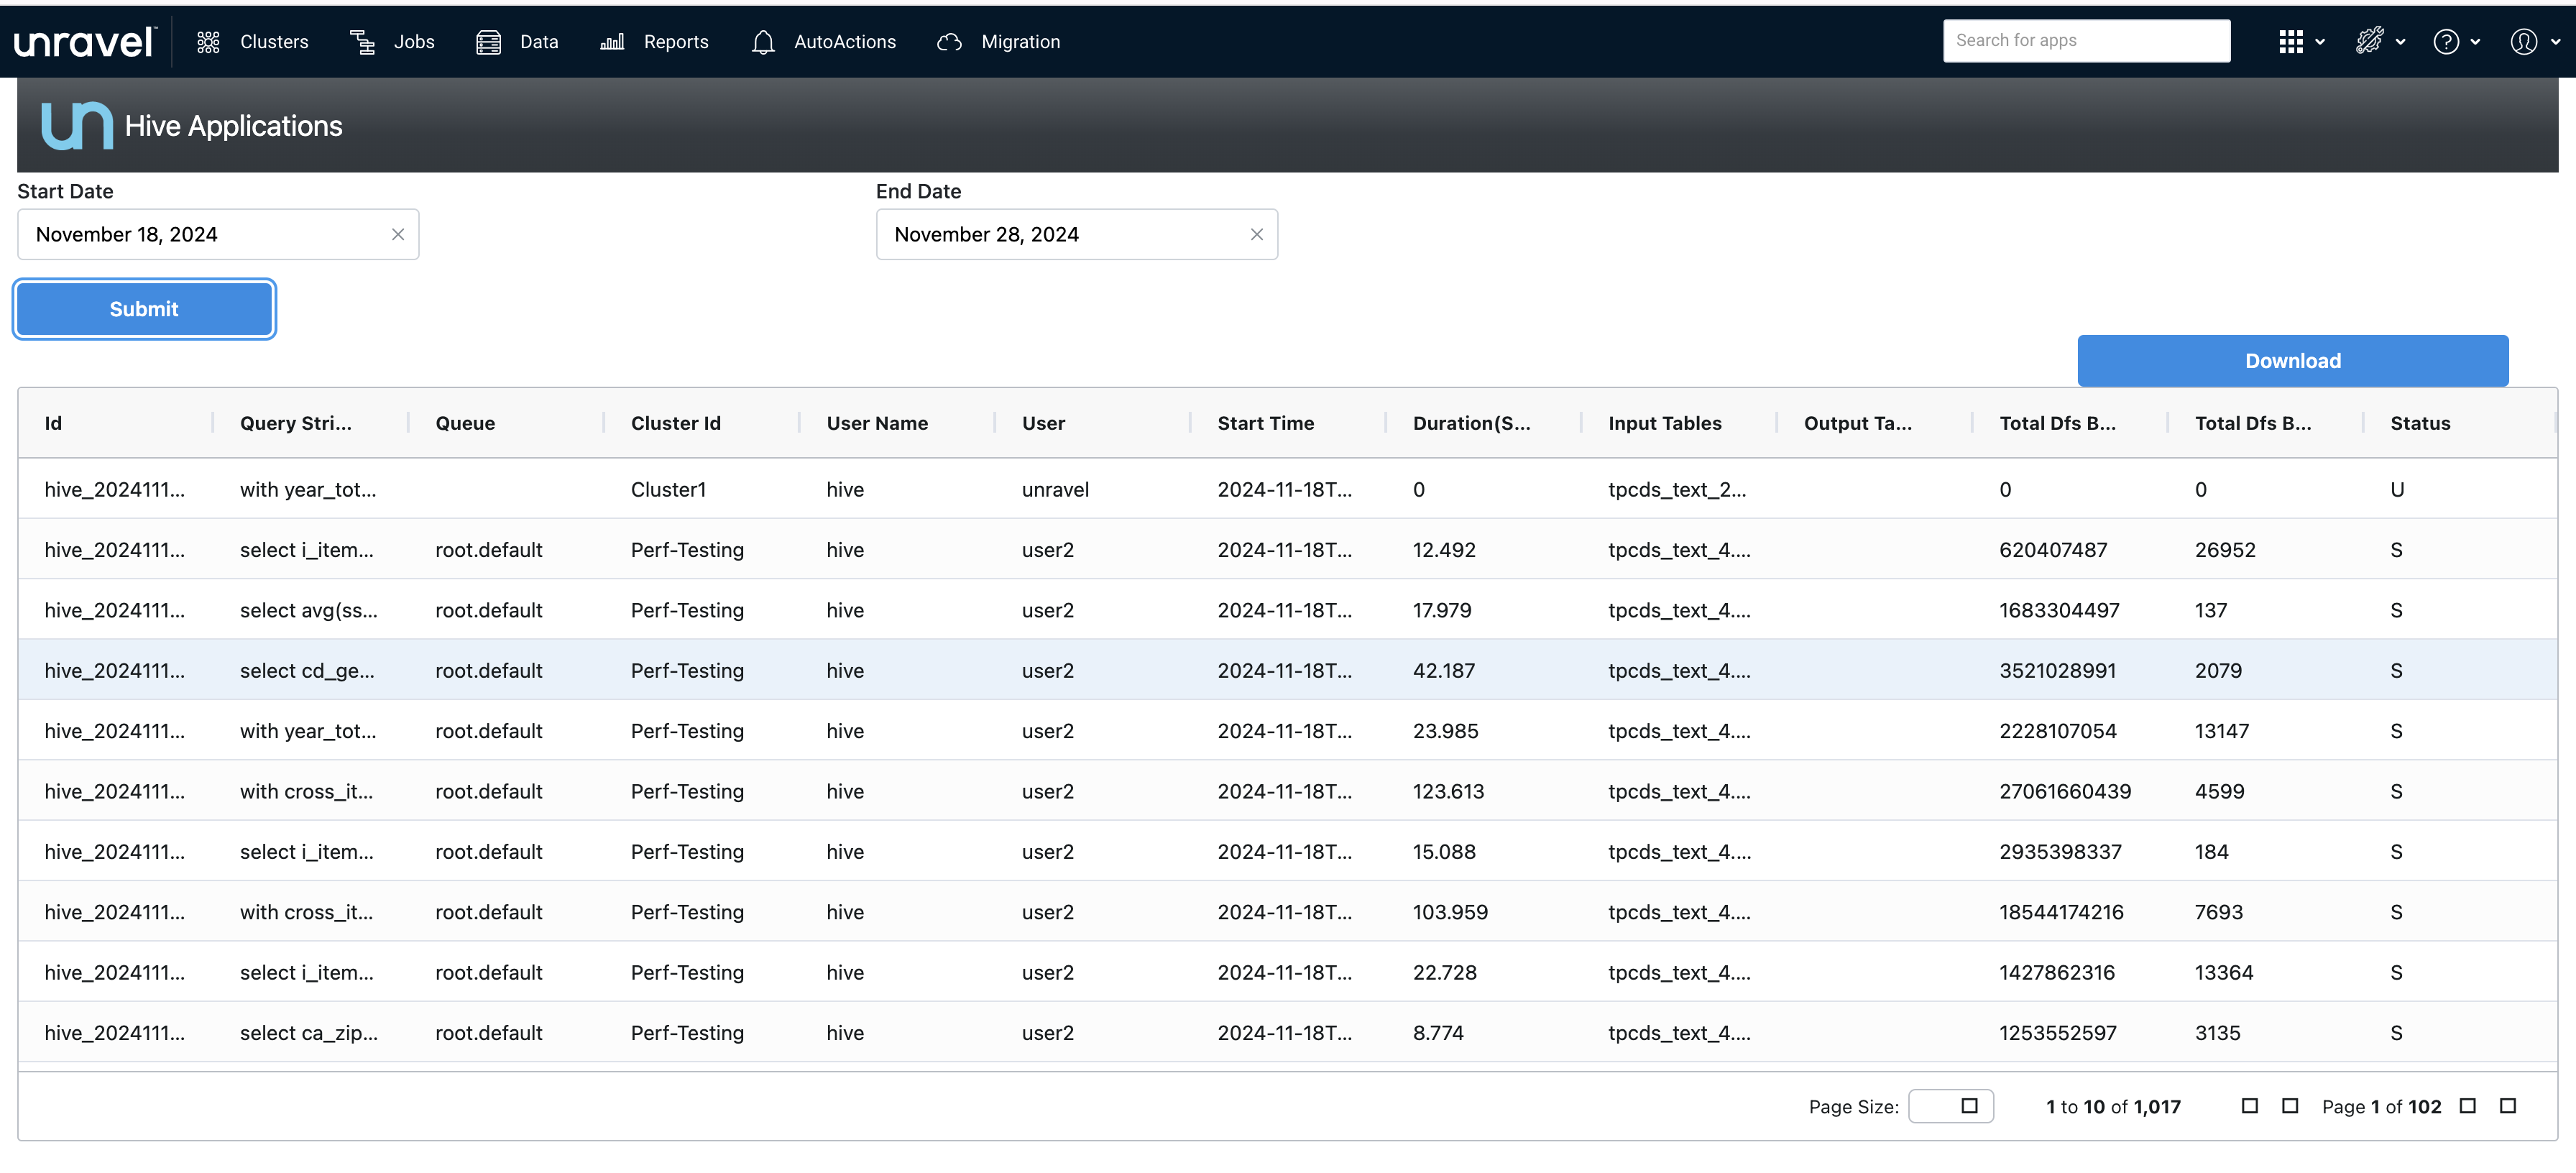
Query ID: A unique identifier for each query, useful for tracking specific queries.
Query String: The actual SQL query string executed.
Queue: The processing queue assigned to the query. This helps understand the resource allocation.
Cluster ID: The identifier for the cluster that processed the query.
User Name: The name of the user who submitted the query.
User: The user account under which the query ran.
Start Time: The timestamp of when the query started execution.
Duration: The total time (in seconds or minutes) taken to complete the query.
Input Tables: The tables being read by the query.
Output Tables: The tables being written to by the query.
Total DFS Bytes Read: The total amount of data read from the Distributed File System (DFS).
Total DFS Bytes Write: The total amount of data written to the Distributed File System (DFS).
Status: The current state of the query (e.g., Running, Completed, Failed).