
Snowflake Documentation

Unravel User interface tour

After you sign in to Unravel, you will see the following menus at the top.
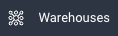
Menus (Snowflake)

Description

insights.png

Provides a comprehensive summary of all the insights generated for your integrated Snowflake warehouses and queries for the last 15 days.

cost.png
  • View, understand, and monitor your costs within Snowflake.

  • Access and evaluate the total compute cost associated with your Snowflake usage.

  • Identify and analyze the most expensive warehouses and users in your Snowflake environment.

warehouses.png
  • Provides insights and data relating to your warehouse activities.

  • Monitor costs, review trends, and access detailed warehouse information

queries.png
  • Filter and analyze queries.

  • Explore similarities among queries by selecting Same Signature Queries and compare different queries to understand their performance

  • Streamline the query management process.

data.png

Presents information such as metadata, KPIs, and insights about tables and partitions.

dashboards.png

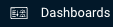
Construct custom dashboards tailored to your specific needs using the collected metadata.

alerting.png

Get notified, in your preferred notification channel, with alerts which get triggered when the set conditions are met.

Search bar

Search bar

Description

Search for apps search-for-apps.png

Search for an application name, application type, or user name. The search is case-insensitive.

Examples:

  • Application name: application_1661849569325_6440

  • Application type: Spark

  • User name: jsmith

For wildcard search, you can use an asterisk (*) at the end of the text you search for. For example, (spark*).

Context menu

You can click various elements on the upper-right corner of the window to see the actions available.

Icon

Description

App Store app-store.png

Use to install and manage apps. Generate reports of executive KPIs (cluster usage KPIs, including for YARN and Impala).

Manage manage.png

Expand to view various management options.

  • Daemons: View daemons that are enabled for Unravel. You can also check the message (Info, Progress, Error, and Fatal) count information. See Unravel Daemons.Unravel Daemons

  • Stats: View database statistics and Elasticsearch details, such as the status of an Elasticsearch cluster, total size, and the number of indexes.

  • Run Diagnostics: Load and view the latest diagnostics log. You can also download the diagnostics.txt file.

  • Monitoring: Monitor information such as Partition Info, DB Status, DB Performance, Kafka (topic by consumer group), Zookeeper (host details), and Elastic (nodes and cluster health).

  • API Tokens: Create tokens for API token authorization. See API authorization token.

Help help.png

Expand to view the following list of options:

  • Support Portal: Navigate to the Unravel customer support portal.

  • Send Feedback: Send your feedback or share your ideas.

  • Documentation: View the online Help of Unravel documentation.

  • About: View the version of Unravel and its components.

User user.png

Expand to view the following list of options:

  • Copy Login Token: Copy the login token.

  • Logout: Log out of Unravel.