How to view Databricks pipelines
A job workflow instance for an application provides a comprehensive view of the data pipelines and their execution patterns. You can check the workflow instance and identify anomalies, inefficiencies, and bottlenecks in your data pipelines.
To view the data pipeline details, do the following:
On the Unravel UI, click Applications > Jobs. All the job workflows in the cluster are listed.
Click the date picker on the right and select a period range. For this walkthrough, you can select the Last 90 days period range. The job workflows that are only in the specified period range are shown.
Click any job workflow instance. You can view the details of the workflow on the application details page.
Left Tabs
Navigation: Provides an easy way to understand the breakdown of the apps' workflow. You can click a job to see more details.
Errors: Lists all the job's errors. Like job status, the errors are color-coded, and the total number of each type (fatal, errors, warnings) is noted. The top line lists the number of all jobs and tasks. The errors are grouped by tasks/jobs and then by severity. For each job/task, the total and type of errors are noted. Time, keywords (if any), and a brief message is displayed for the error. Keywords extract important details from the error messages and log data that can help developers and operators quickly "root cause" issues. "No errors found" is displayed when there are none.
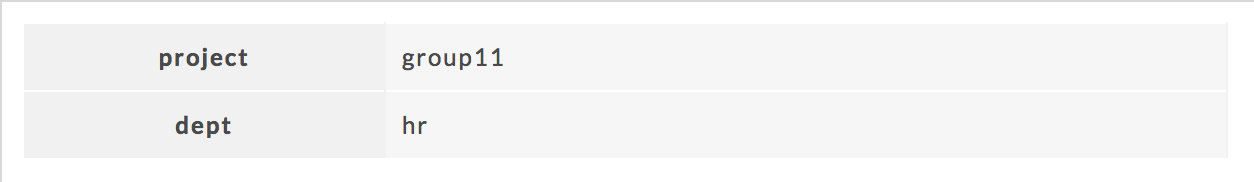
Tags: The defined tag keys and values for the app. This example has two tag keys, project and dept , with each having one value, group11 and hr , respectively.
Right Tabs
Compare: A comparison of the workflow runs is provided. The following metrics are plotted in the Workflow Instance graph:
Events: The number of Unravel insights for a query.
Duration: Total time taken by the query.
Data I/O: Total data read and written by the query.
Number of Apps: The number of apps that make up the workflow.
Cost: Cost calculated based on the estimated run durations of the instances/DBUs.
DBUs: Databricks Unit
Task Attempts: Displays charts for the tasks, broken down by success, failed, and killed.
Attempts: Graphs the attempts over the time interval in Wall Clock time.