Spark details page
Overview
A Spark application consists of one or more Jobs, which have one or more stages. A job corresponds to a Spark action, for example, count, take, for each. You can view all such details of a Spark application from the Spark details page.
The Spark details page lets you:
Quickly see which jobs and stages consumed the most resources.
View your app as an RDD execution graph.
Drill into the source code from the stage tile, Spark stream batch tile, or the execution graph to locate the problems.
You can use the Spark applications detail page to analyze an app's behavior to:
Resolve inefficiencies, bottlenecks, and reasons for failure within apps.
Optimize resource allocation for Spark drivers and executors.
Detect and fix poor partitioning.
Detect and fix inefficient and failed Spark apps.
Use recommended settings to tune for speed and efficiency if applicable.
The following details are shown in the uppermost section of the Spark details page.
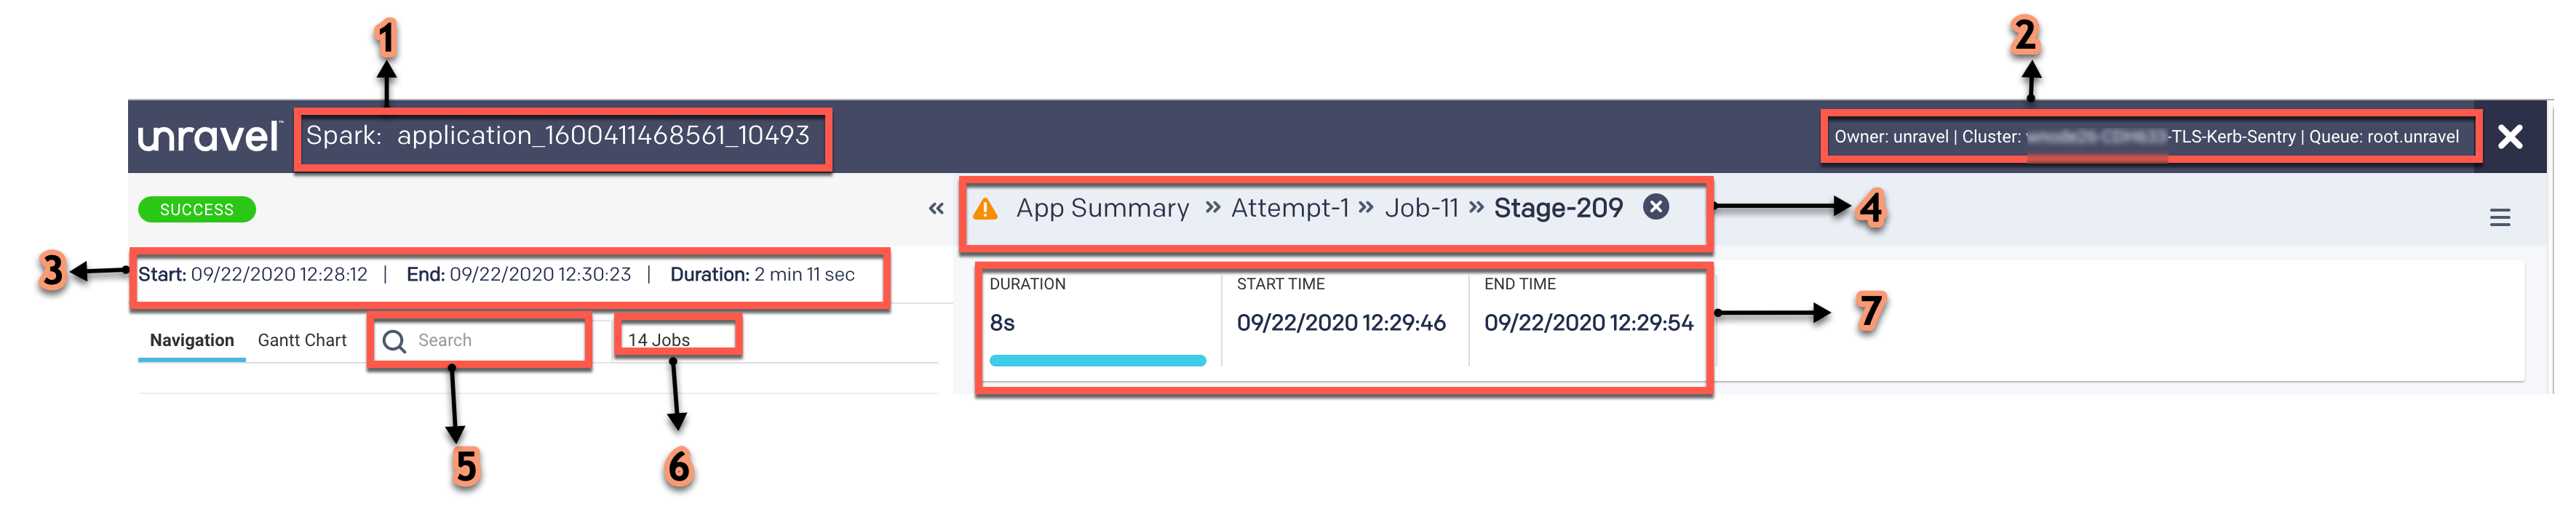
Item No. | Description |
|---|---|
1 | Name or ID of the Spark application. |
2 | Details of the Spark app owner, cluster ID, and Queue. |
3 | Start time of the application run. End time of the application run. Duration of the application run. |
4 | Indicates the navigation drill-down into job attempts, stages of the job, etc. You can click |
5 | Search box to search for an application or job. |
6 | Total number of jobs in an application. |
7 | Duration of the job. Start time of that specific job. End time of that specific job. |

Navigation
The Navigation tab lists the jobs in an application with the following details:
Job ID: ID of the job in the application.
Start Time: Time when the job started.
Duration: Period since the job started.
Read: Bytes of data read by the process.
Write: Bytes of data written by the process.
Stages: The execution stage of the job.
Click a row within the Job ID list. The corresponding list of job stages is displayed below, along with the Execution tab on the right.
The Execution tab shows an RDD DAG of the job. The RDDs are represented in the vertices, while the edges are the Operations to be applied. You can click  to expand the tab.
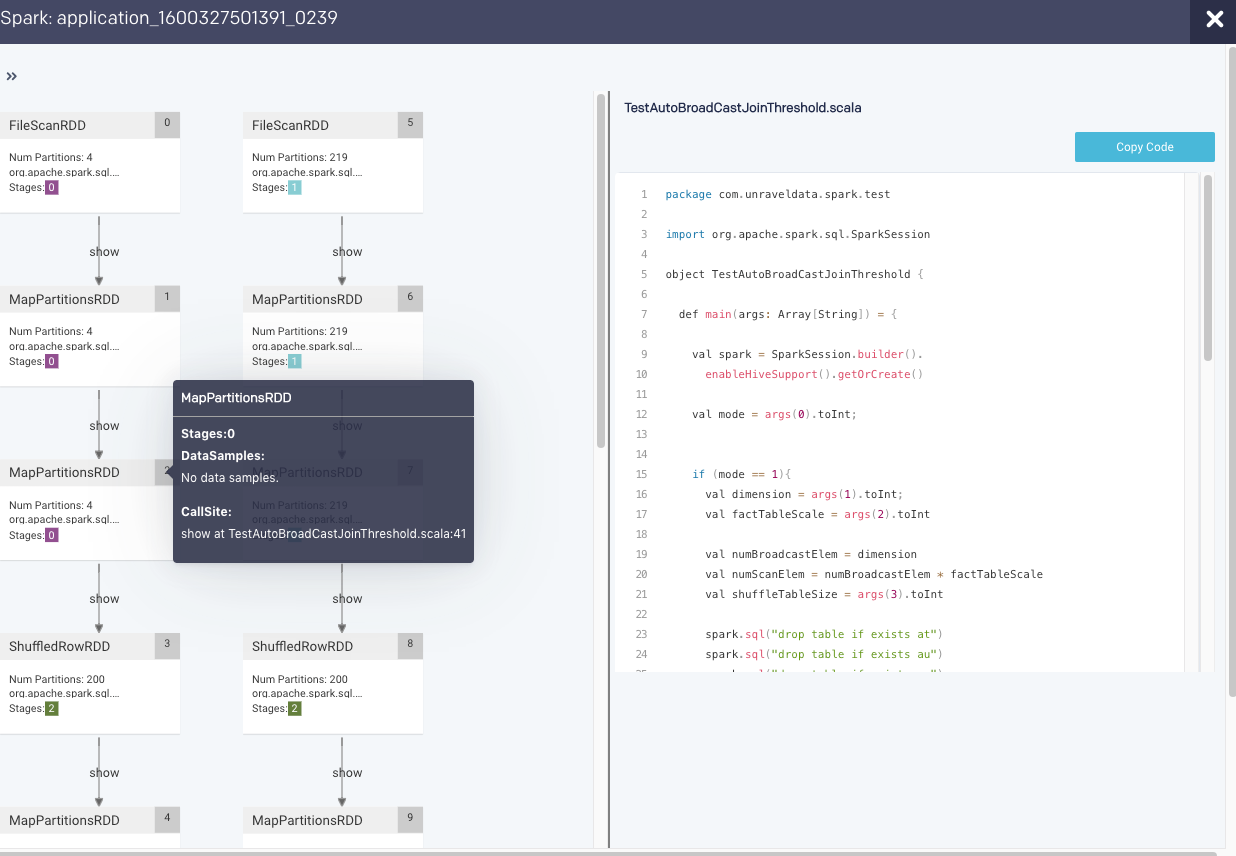
If the source code is available, clicking on a vertex brings up the source line associated with the RDD.
Note
The execution graph is not displayed when more than 1000 RDDs in the generated DAG.
When you click a job in the Navigation tab, the corresponding stages of the job are listed. Click a stage, and the following tabs are displayed for that stage:
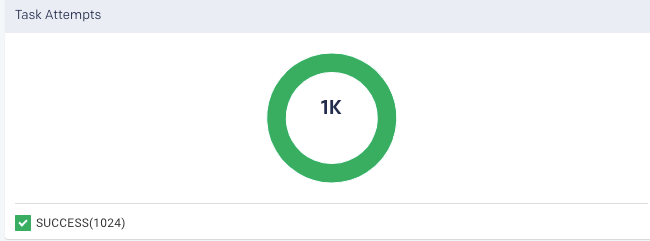
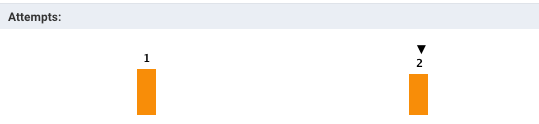
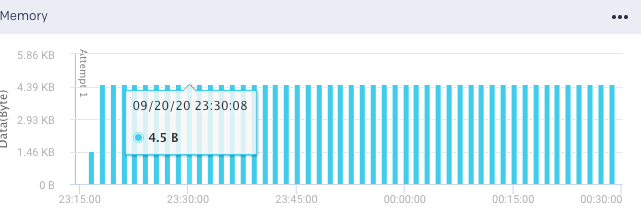
Taskattempt: Graphically and textually notes the number of tasks and their status. The donut graphs show the percentage of successful (green), failed (orange), and killed (red) tasks.
In case of failed or killed status, the Attempts graph is displayed on the left, which plots the number of attempts that were made before the application failed or got killed.
Program: Displays the program's source code if available. See Uploading Spark Programs.
Timeline: The Timeline tab shows the following sections
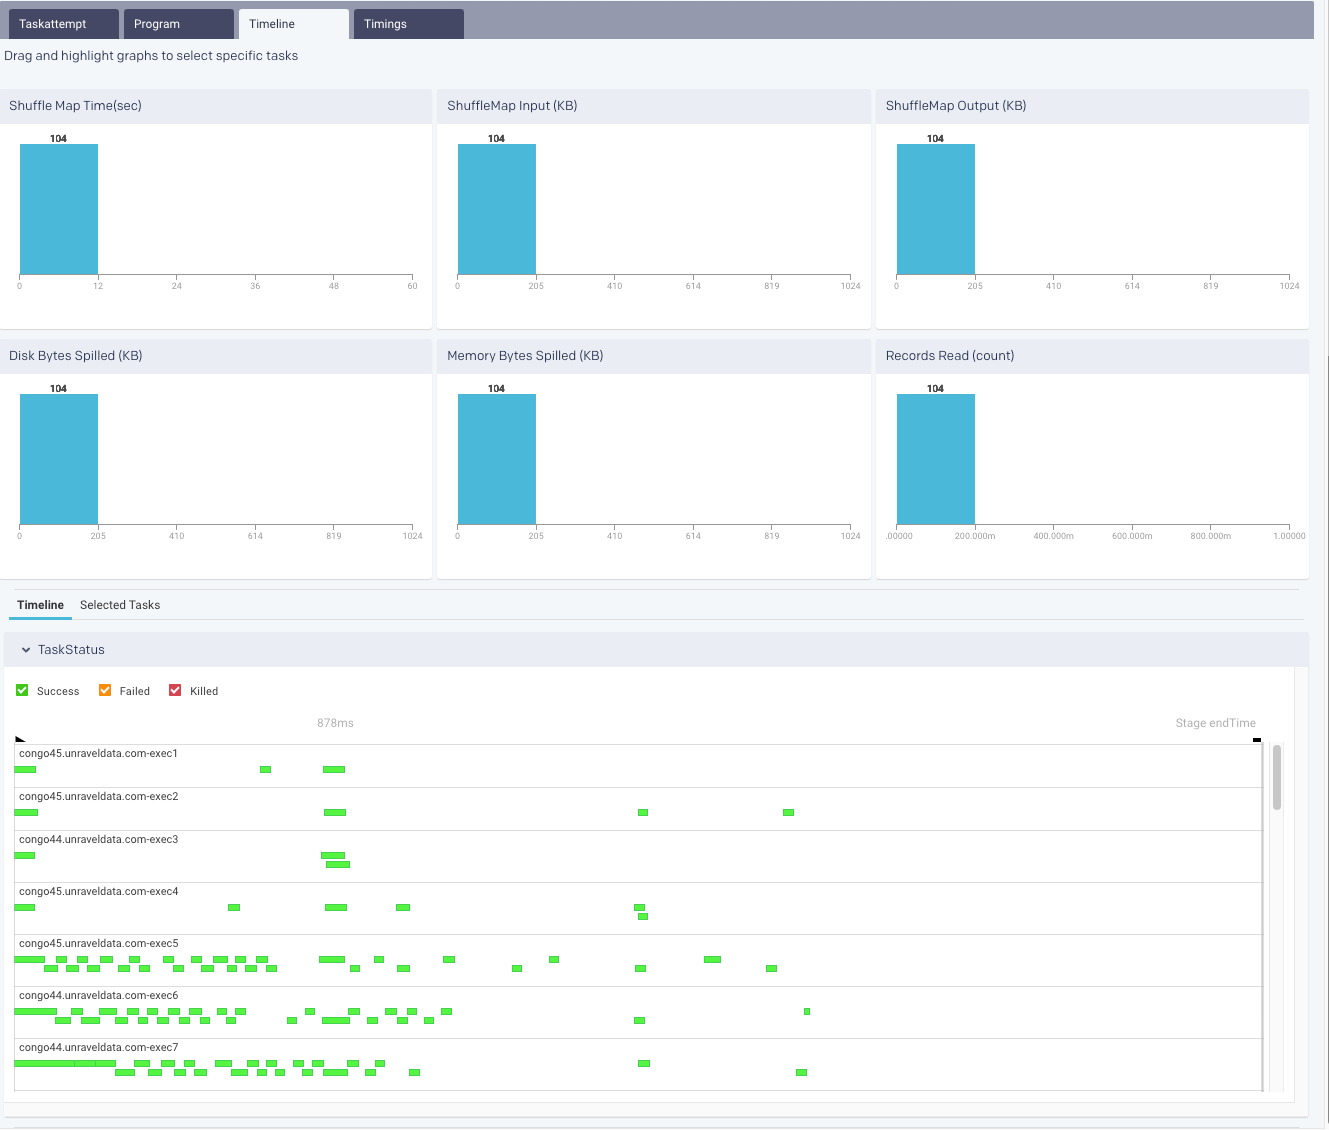
Distribution Charts: By default, the Time Line tab opens with the Distribution Charts displaying the tasks over the following graphs:
Shuffle Map Time(sec)
ShuffleMap Input (KB)
ShuffleMap Output (KB)
Disk Bytes Spilled (KB)
Memory Bytes Spilled (KB)
Records Read (count)
You can drag and highlight the graphs to view task details in the Selected Tasks tab.
Timeline: From the drop-down, you can select any of the following:
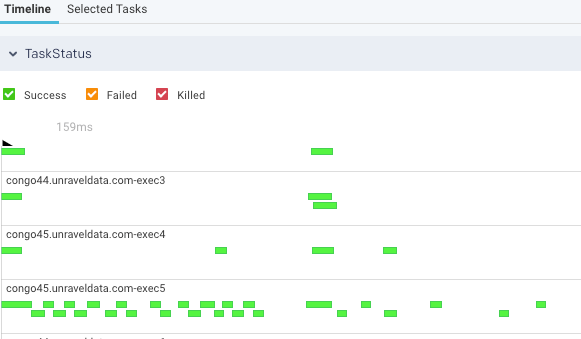
Task Status:
This is useful to see the task stages that can be filtered by status; Success, Failed, Killed. Hover over a task to bring up the stage details.
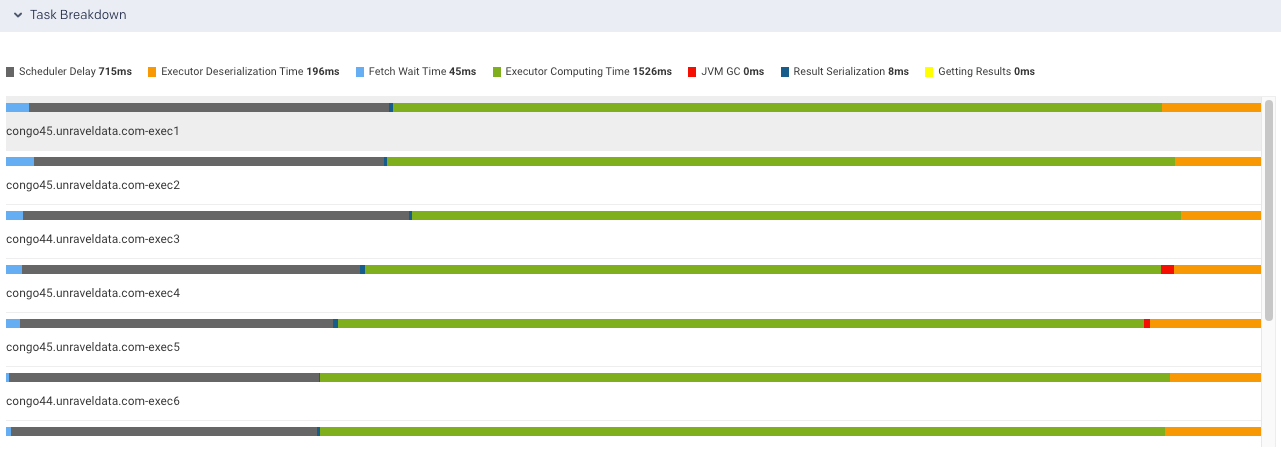
Task Breakdown
This is useful to identify bottlenecks. For each executor used in the current stage, multiple metrics are graphed: Scheduler Delay, Executor Deserialization Time, Fetch Wait Time, Executor Computing Time, JVM GC time, Result Serialization Time and Getting Result Time.
Using the ratio of Executor Computing Time to the total execution time you can determine where the executor spent most of its time:
Performing actual work.
Thrashing.
Waiting for scheduling.
Selected Tasks: A list of tasks, if any, for the stage.
Timings: This contains a pie chart that plots the total task duration of all the Spark stages, which are neither reading nor writing to external file systems. The pie chart is sliced based on the following metrics:
Item
Description
ShedulerDelay
Time to ship the task plus the time to ship the results back to the scheduler.
TaskDeserializationTime
Aggregated time spent on the executor to deserialize all tasks.
ResultSerializationTime
Aggregated time spent serializing the result of all tasks.
CPUTime
Aggregated CPU time that the executors spent to run all the tasks.
ShuffleWriteTime
The aggregated time that all the tasks spent blocking on the shuffle writes to disk or buffer cache.
ShuffleReadBlockTime
Aggregated time all the tasks spent waiting for remote shuffle blocks.
Others
Other times all the tasks spent on components that could not be inferred.
Gantt Chart
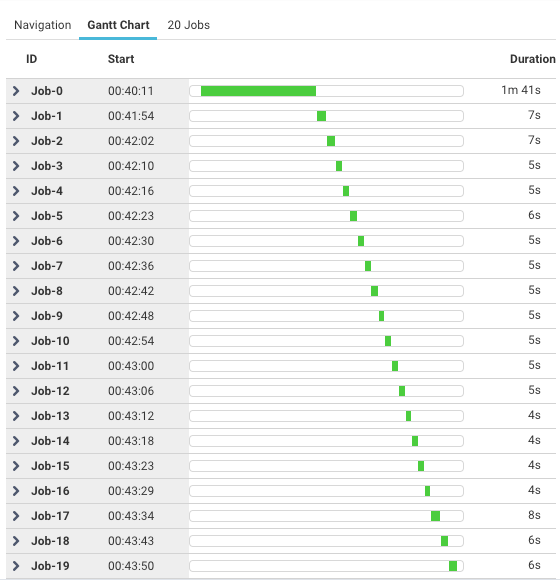
The Gantt tab visually displays the progress of all the jobs and their corresponding stages in the cluster. The status of each job and stage is displayed in a color-coded bar against a timescale.
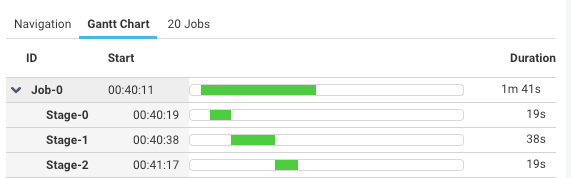
The job ID, start time, duration of the job and stage are shown when you hover over them. You can expand the Job to view the Stages.
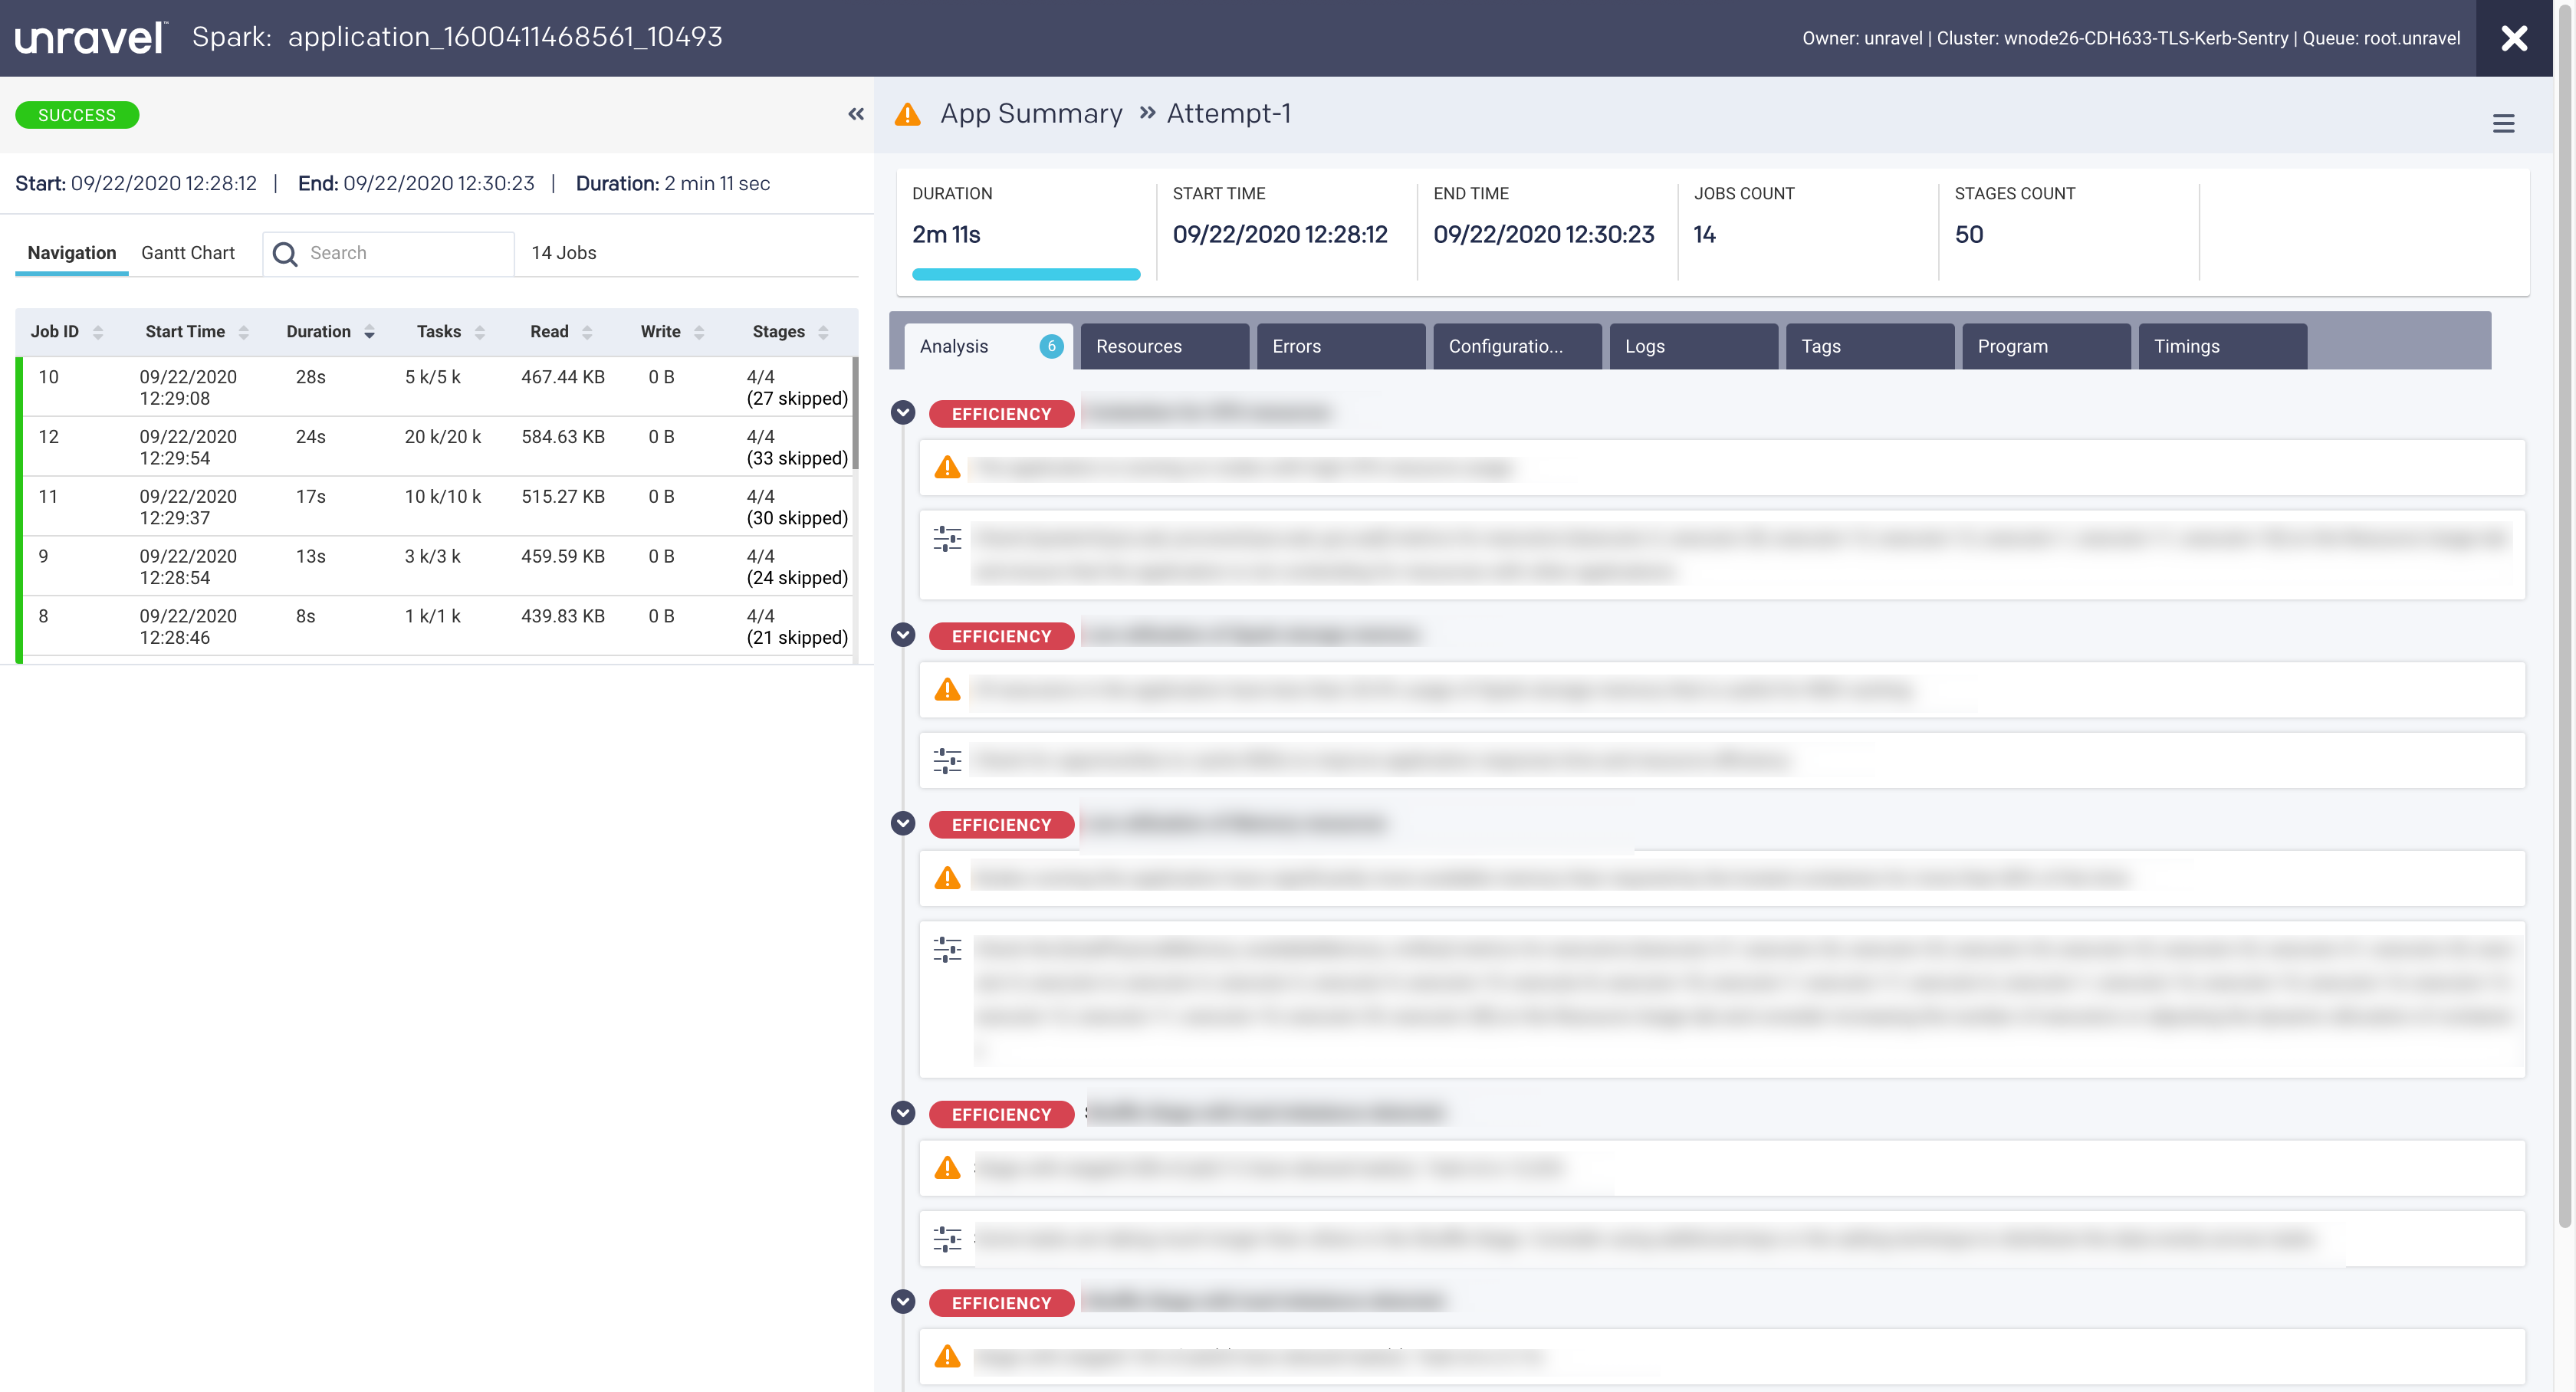
App Summary
The Application Summary page details the jobs run in a Spark application. The following tabs are included on the Application Summary page:
The Unravel intelligence engine helps you manage your jobs and pipelines by analyzing its run and providing insights based on the runs. Unravel's analysis results show where the efficiencies of your job can be improved.
The number of efficiencies found is noted in the tab. When an Efficiency leads to a suggested parameter or property change, those suggestions are listed as Recommendations.
Efficiency (
 ): Suggest areas to examine to improve efficiency. For example, inefficient usage of resources. Expand an Efficiency tab to read the in-depth analysis. While some are only configuration property suggestions, others focus on areas you should examine. For example, inefficient storage, problems with a query, and so on.
SLA: Recommendations to improve the application performance to meet the SLA.
Bottlenecks: Insights to resolve bottlenecks, such as bad JOINs or partitioning issues, for your SQL queries.
App Failure: Points out common application failures, such as failure due to out-of-memory (OOM).
Recommendations (
 ): Suggestions to update a property or configuration parameter. Click to view the current and recommended value.
The resources contain the following charts:
Taskattempt: Graphically and textually notes the number of tasks and their status. The donut graphs show the percentage of successful (green), failed (orange), and killed (red) tasks.
In case of failed or killed, the Attempts graph is displayed on the left, which plots the number of attempts that were made before the application failed or got killed.
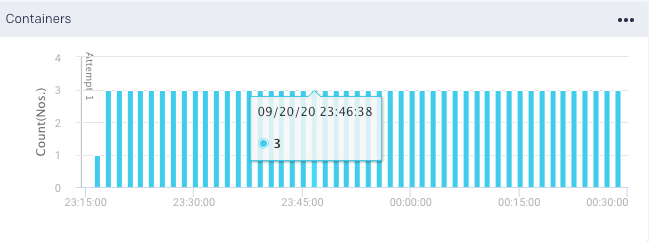
Containers: Graphs the number of containers used.
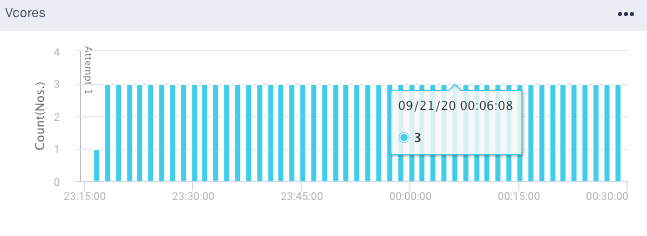
vCores Graphs the vCores used for running the jobs.
Memory: Graphs the memory used for running the jobs.
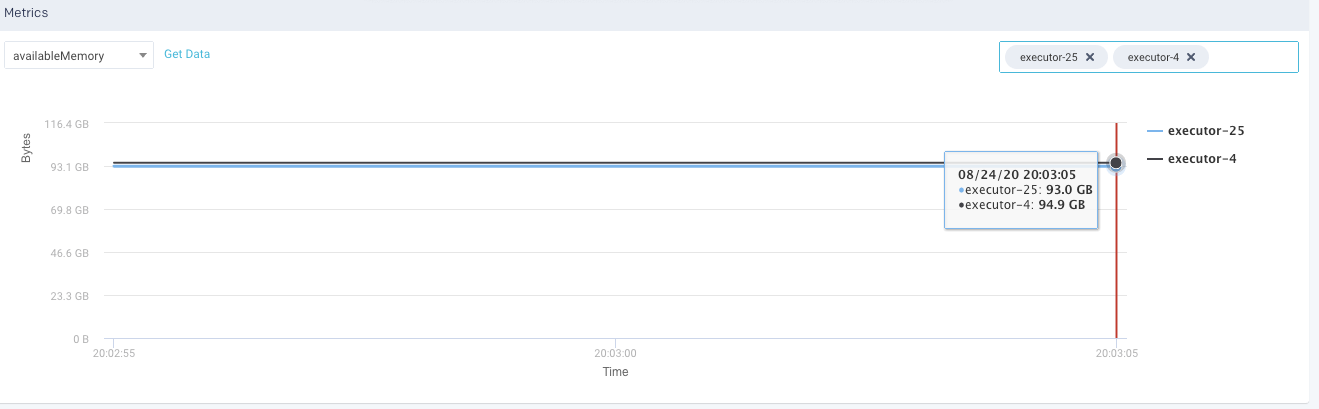
Metrics: The details of the following metrics of the application are plotted in a graph:
OS Memory
CPU Utilization
Java Memory
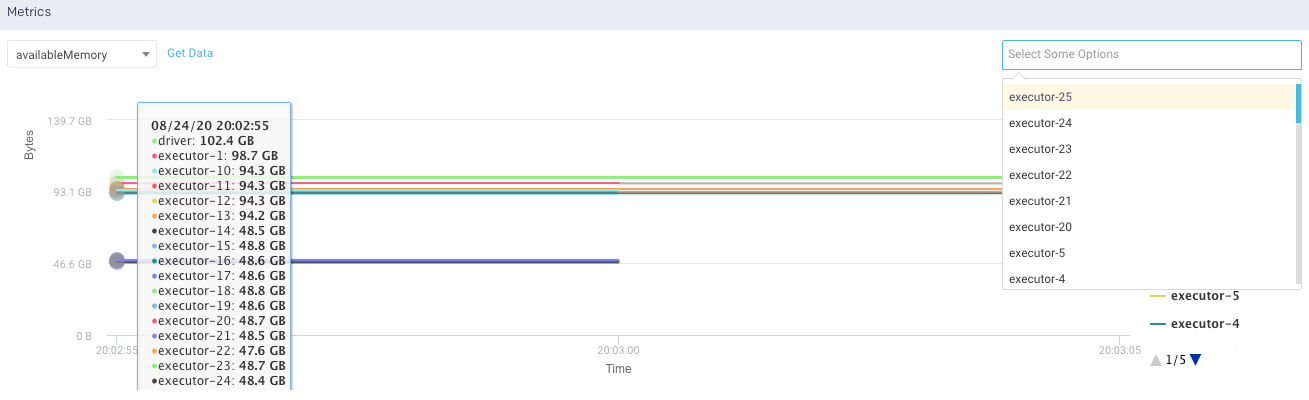
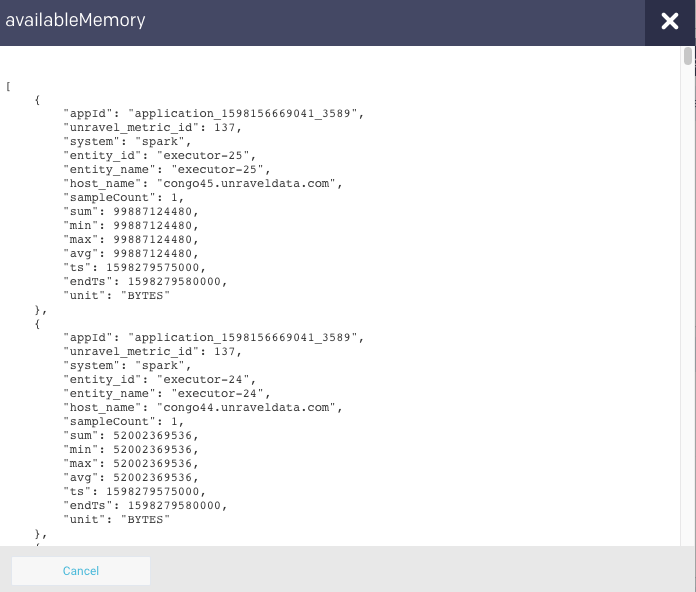
Click Get Data to get the raw data of the graph.
You can further drill down each metric.
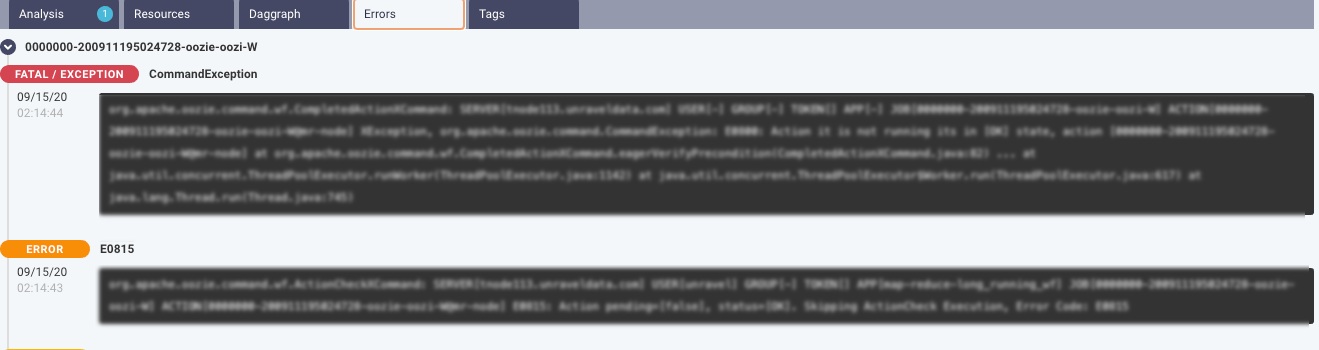
This tab lists the errors that were encountered during the application run.
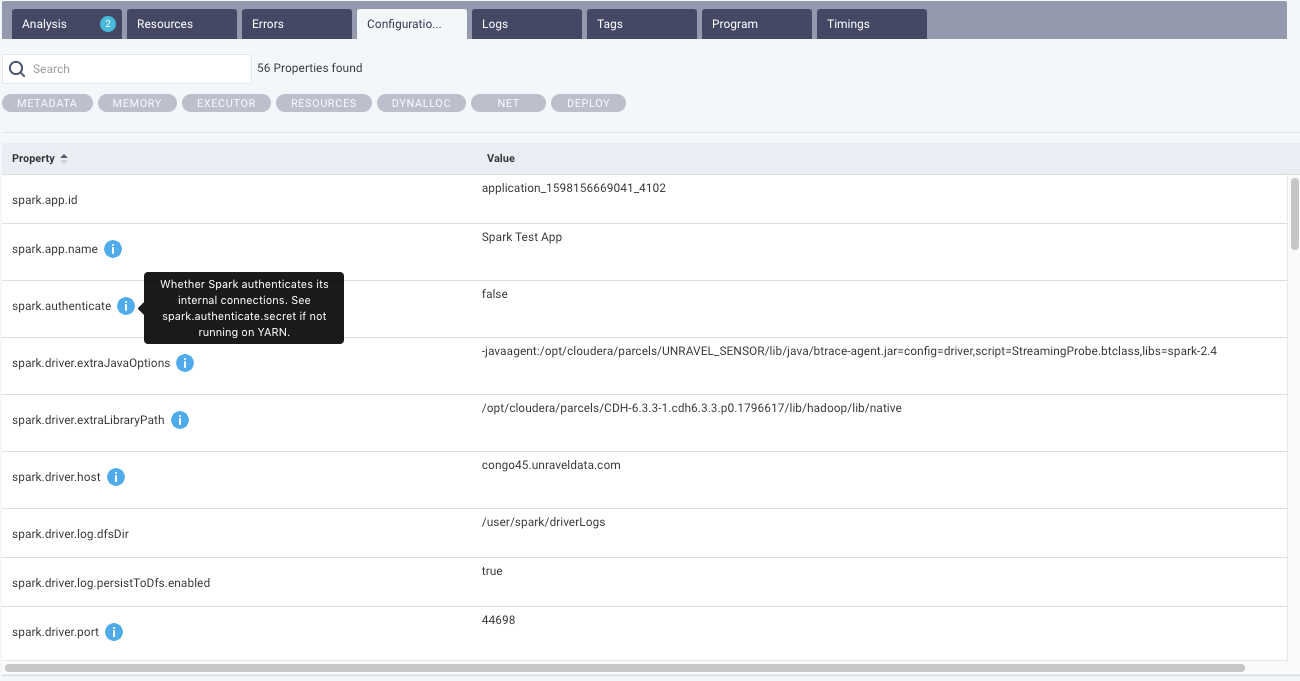
This tab lists all the configurations set for the selected Spark application. You can select the options to view the configurations from the top of the tab. Moreover, you can search for a specific configuration property. Hover over hover any property to view the corresponding definition of that property. By default, all the properties are shown. After you filter, you can click Reset to return to the default view.
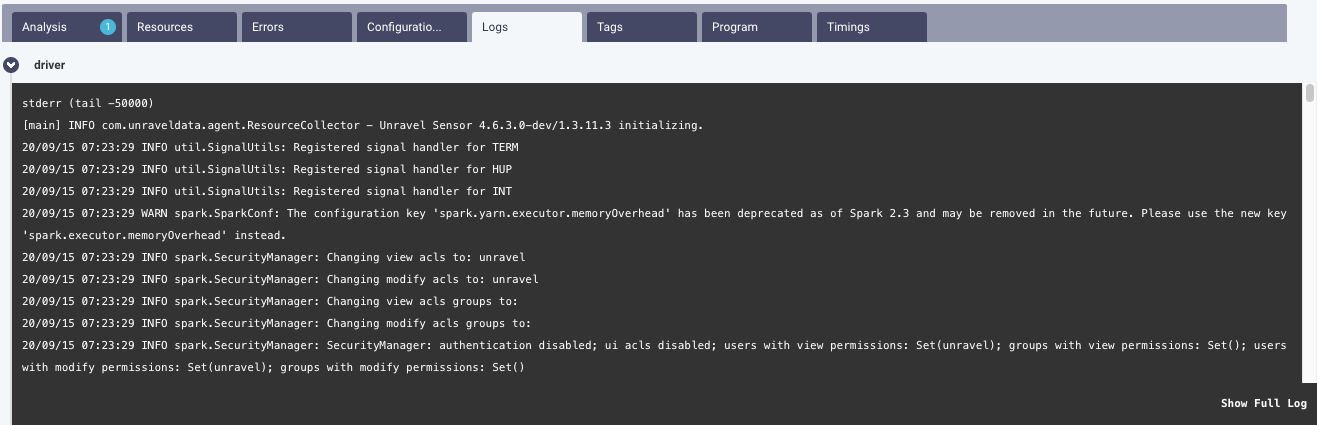
From this tab, you can view the executor and driver logs. Click Show Full Log, to view the complete log file.
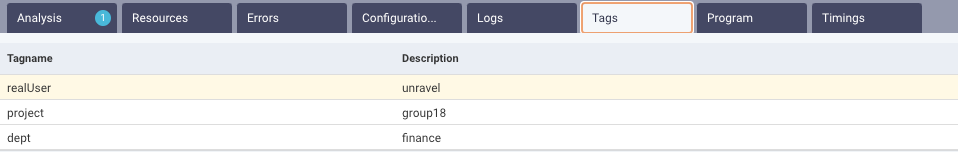
This tab lists the tags used in the Spark application. Refer to Tagging.
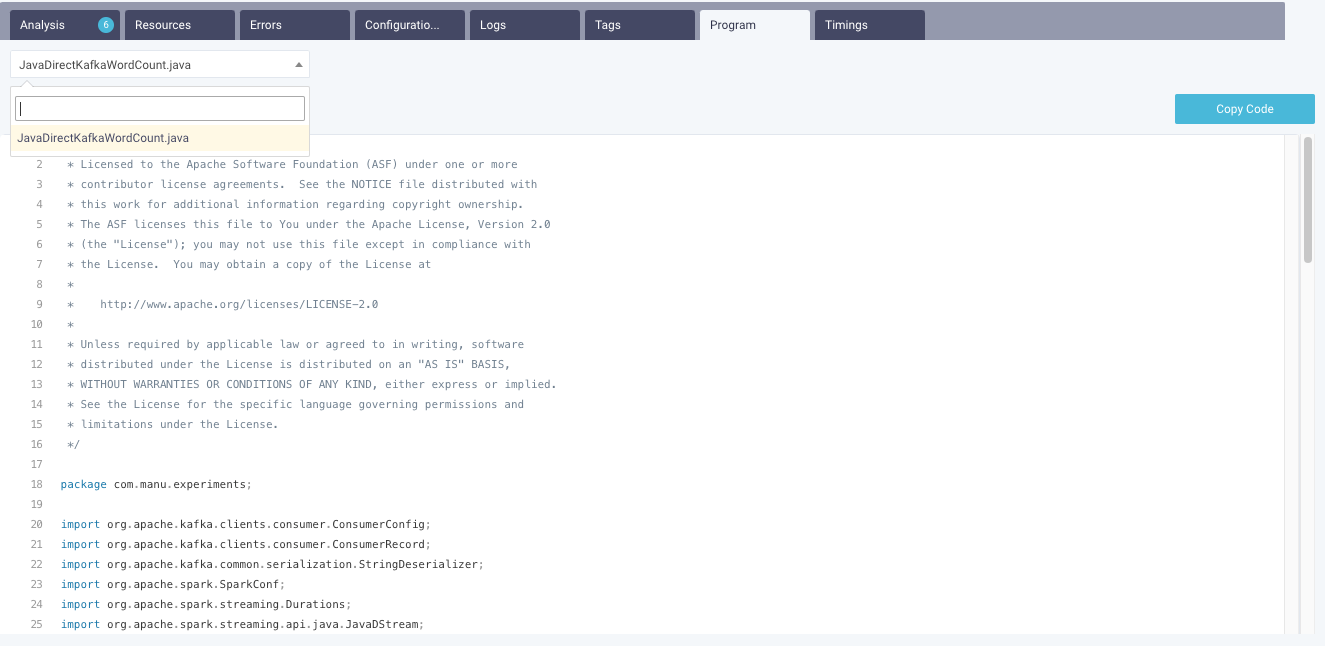
If the source code is submitted via spark-submit then the code is displayed in this tab. From the drop-down, you can select a source code file and view the details. You can also copy the code.
A Spark program is about multiple jobs that run in parallel on different executors. When we analyze a Spark program, it is essential to know the areas where the applications spend most of the time. The Timings tab in the Spark details page provides the details of the time spent by an application, that is, the application’s wall clock time, as well as the time spent by different tasks on each executor.
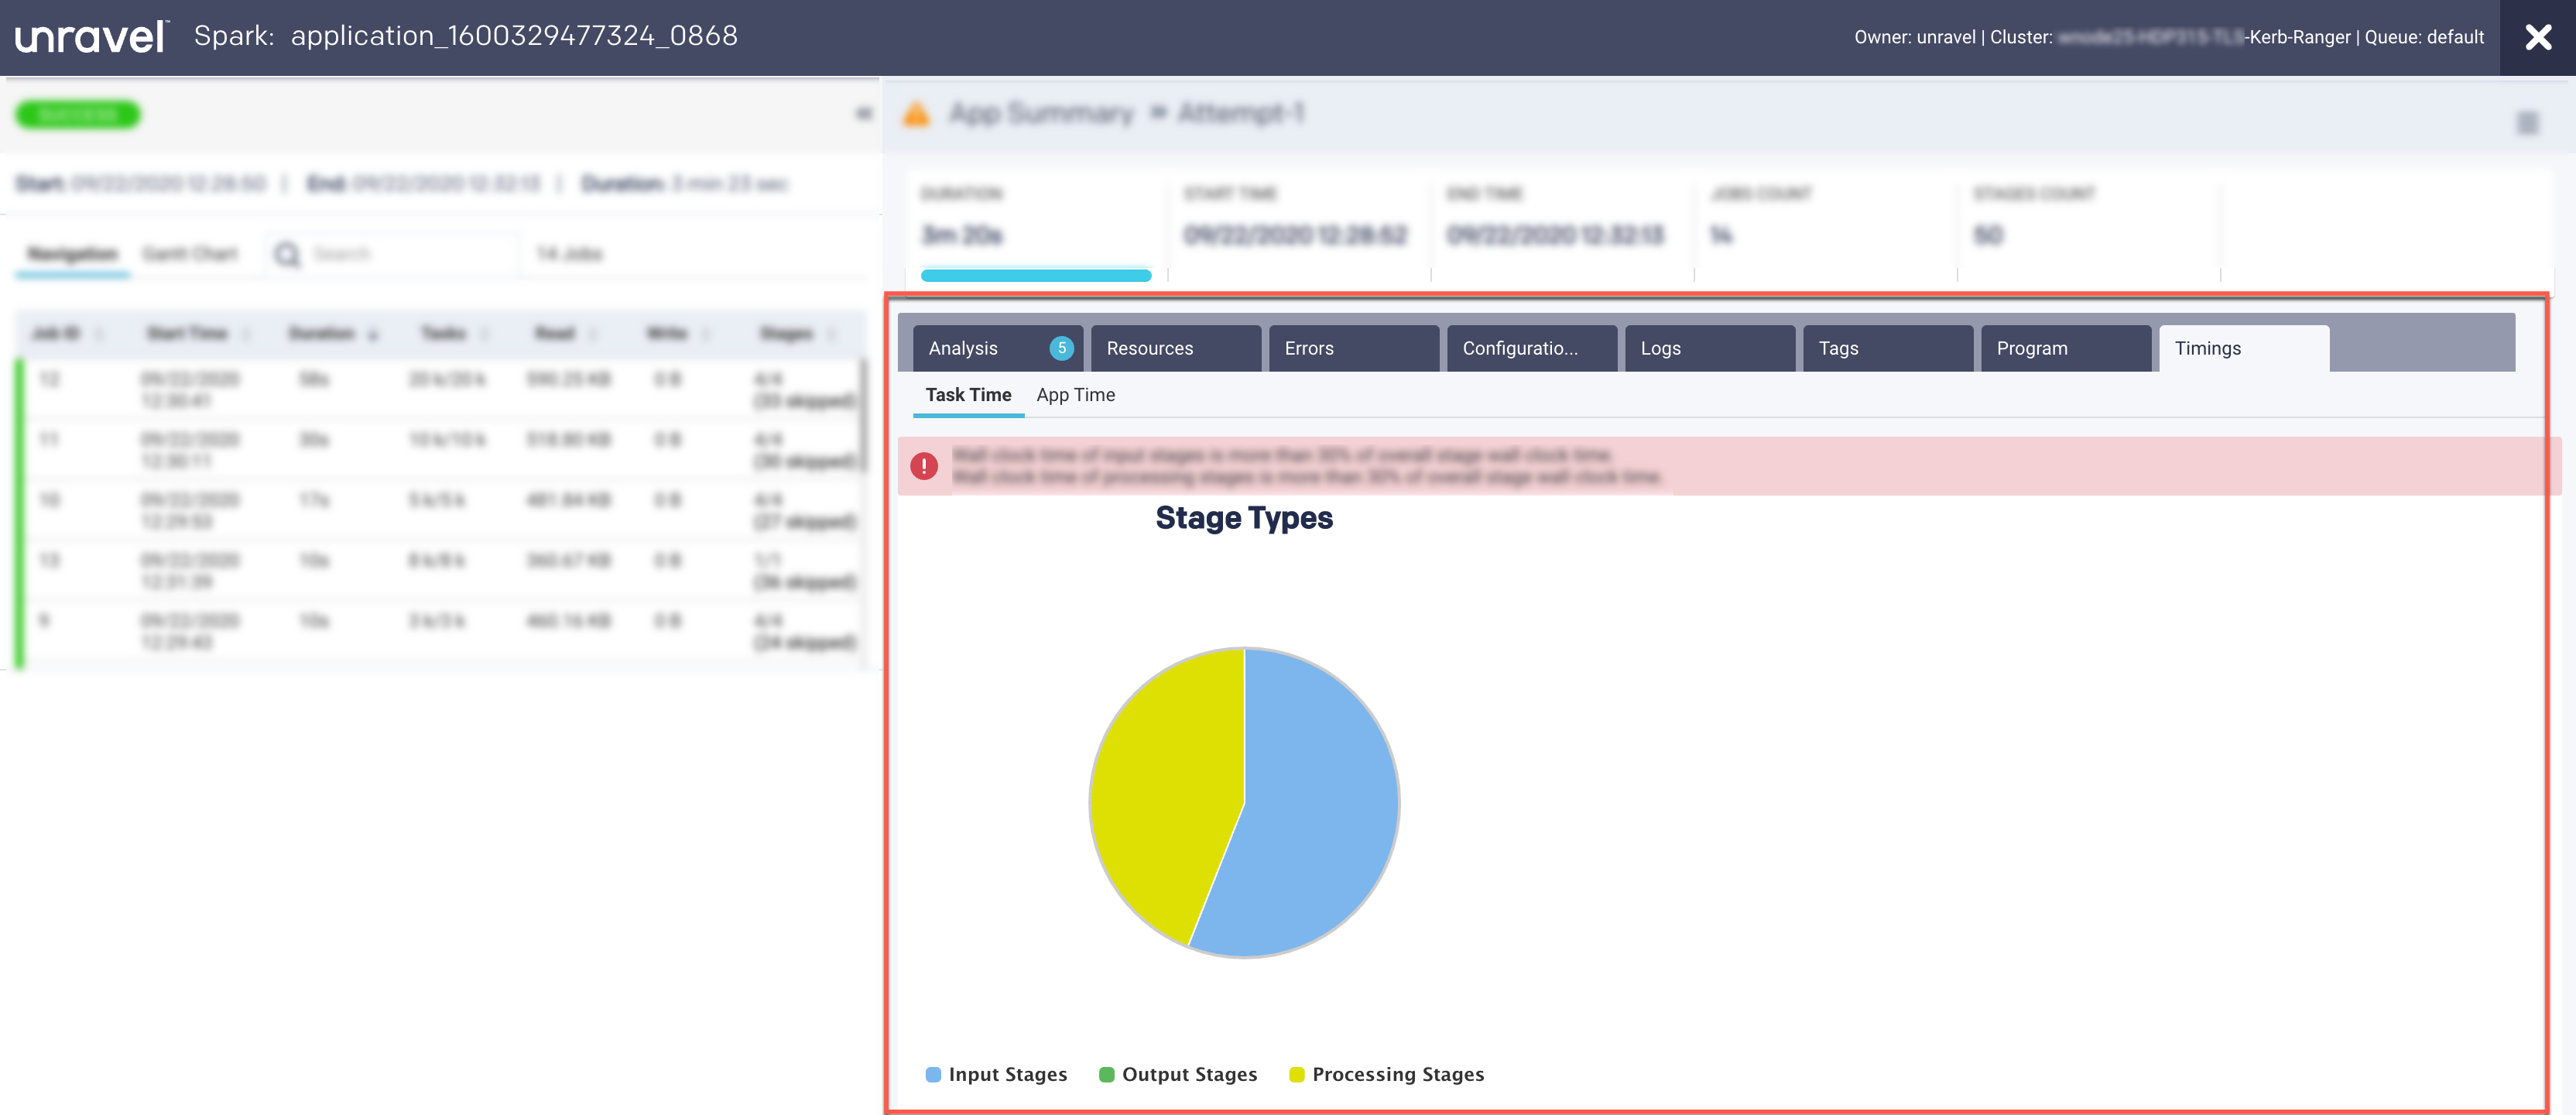
These are captured in the following views:
App Time
Task Time
This view provides a breakdown of the areas where the time on tasks was spent.
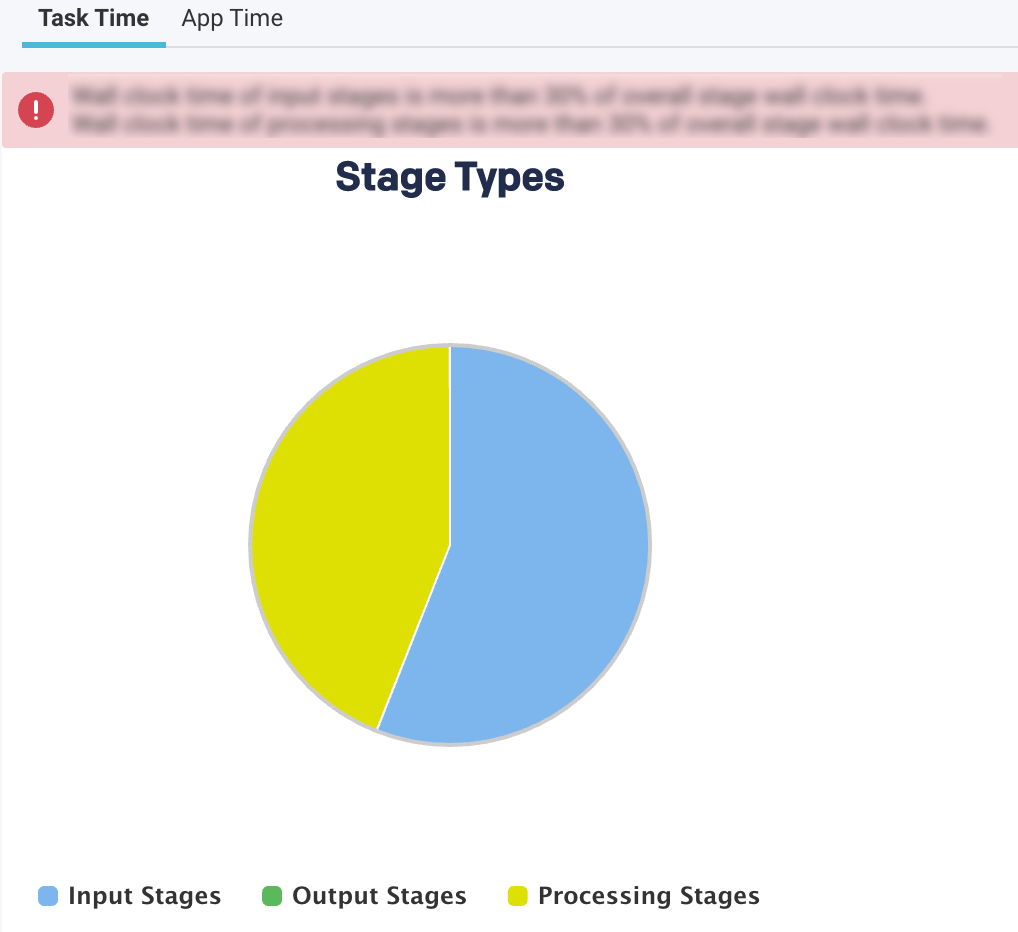
The top-level pie chart is divided into three types of stages:
Input Stages
This contains the total task duration of all the Spark stages, which read data from an external system, such as HDFS, S3, or JDBC.
Output Stages
This contains the total task duration of all the Spark stages, which write results to an external system such as HDFS, S3, or JDBC.
Processing Stages
This contains the total task duration of all the Spark stages, which are neither reading nor writing to external file systems.
Select any stages and click the corresponding pie chart to drill down further to view the time breakdown and other details.
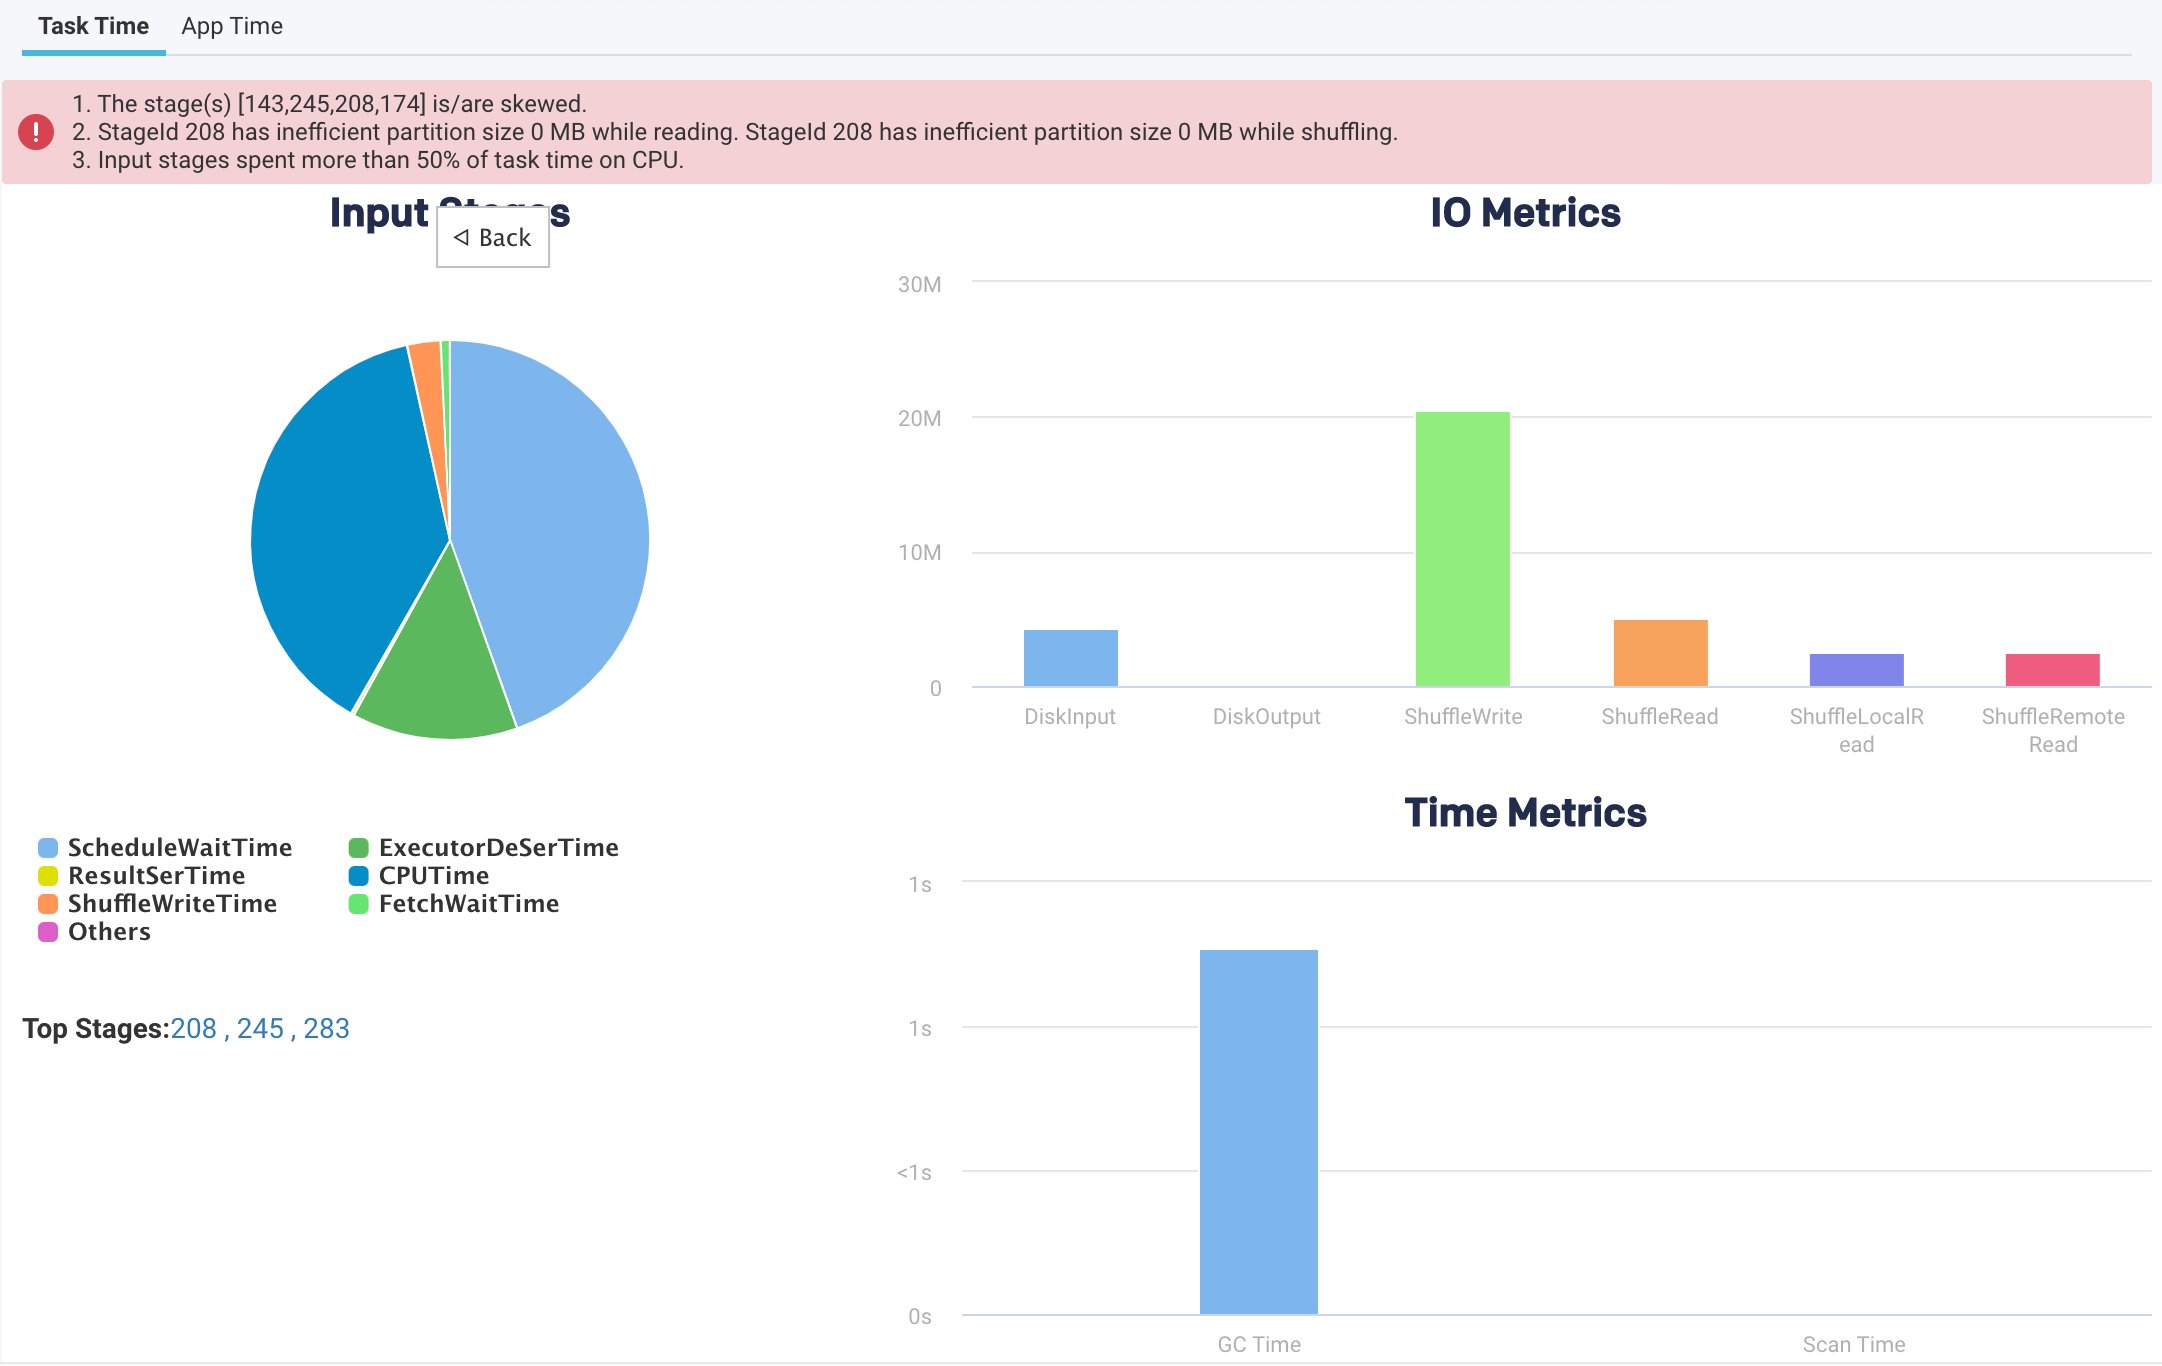
Pie-chart metrics
Item
Description
SchedulerDelay
Time to ship the task plus the time to ship the results back to the scheduler.
TaskDeserializationTime
Aggregated time spent on the executor to deserialize all tasks.
ResultSerializationTime
Aggregated time spent serializing the result of all tasks.
CPUTime
Aggregated CPU time that the executors spent to run all the tasks.
ShuffleWriteTime
An aggregated time that all the tasks spent blocking on the shuffle writes to disk or buffer cache.
ShuffleReadBlockTime
Aggregated time for all the tasks spent waiting for remote shuffle blocks.
Others
Other times all the tasks spent on components that could not be inferred.
Time metrics
Metric
Description
GC Time
The aggregated amount of time the JVM spent in garbage collection while executing all the tasks.
Scan Time
The aggregated amount of time spent reading data from files and tables.
IO Metrics
Metric
Description
DiskInput
Total data read by all the tasks.
DiskOutput
Total data written by all the tasks.
ShuffleWrite
Total shuffle data written by all the tasks
ShuffleRead
Total shuffle data read by all the tasks.
ShuffleLocalRead
Total shuffle data read, which were local to the executors.
ShuffleRemoteRead
Total shuffle data read, which were remote to the executors.
This view provides a breakdown of the application's wall clock time.
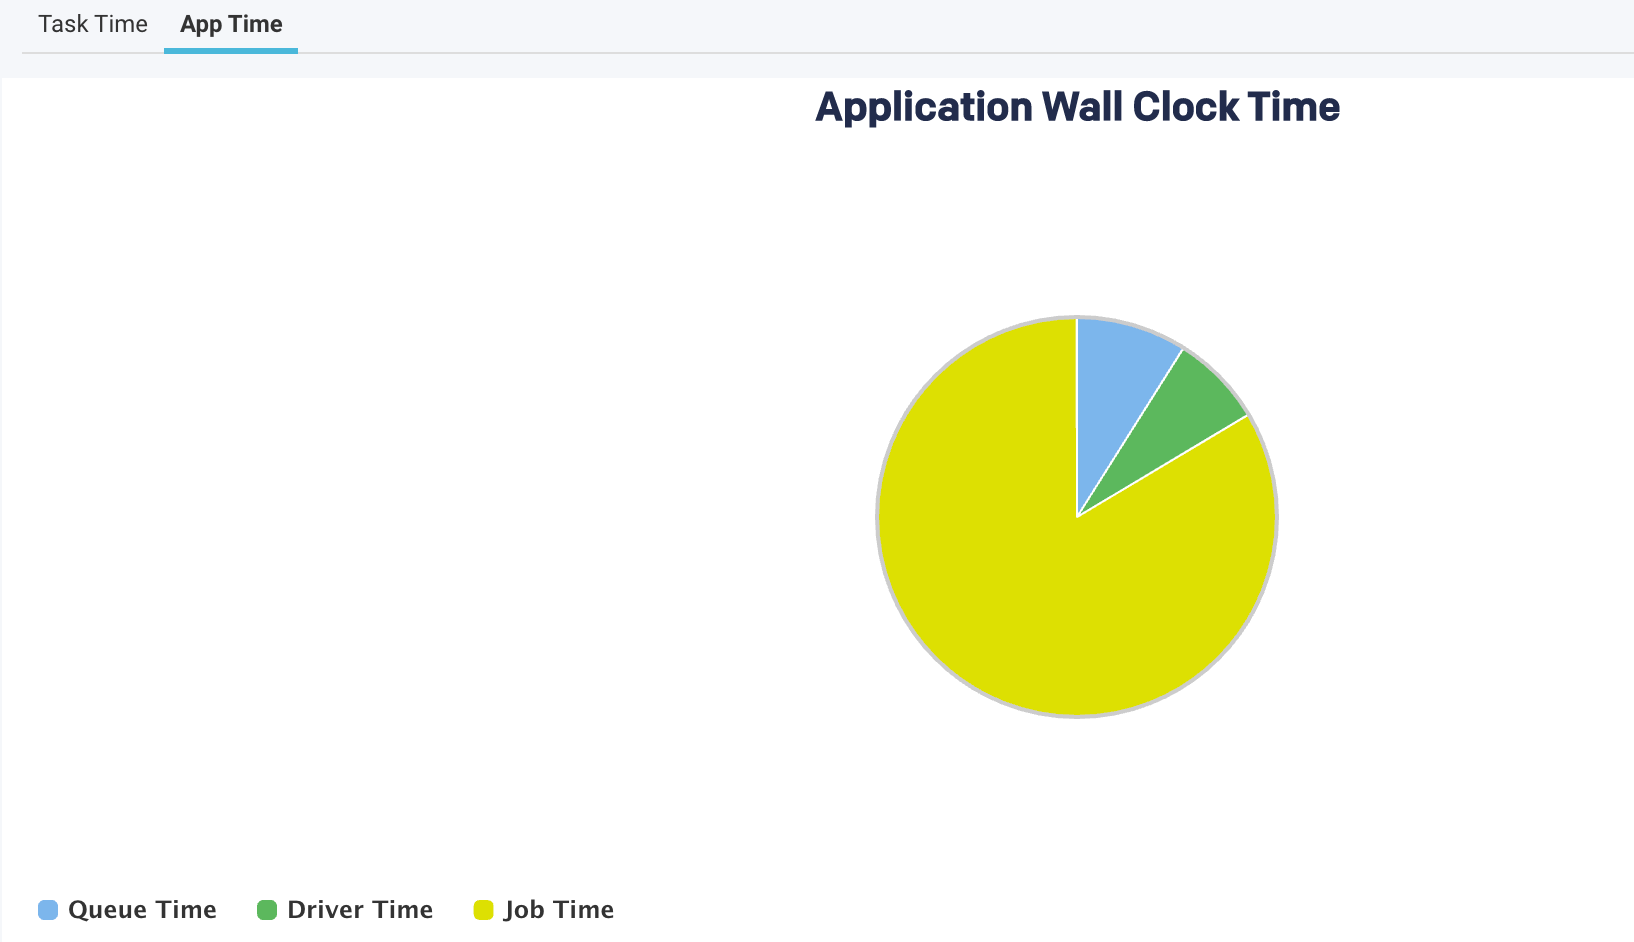
The following metrics are graphically represented in the App Time view:
Item | Description |
|---|---|
QueueTime | The time difference between the submission of an application and the start of the application. |
Driver Time | The time spent by the Spark applications exclusively on the driver. During this time, jobs are not executed. |
Job Time | The time when at least one job was running and thereby cluster resources are used. |
An orange bar on the top provides various hints regarding the application.
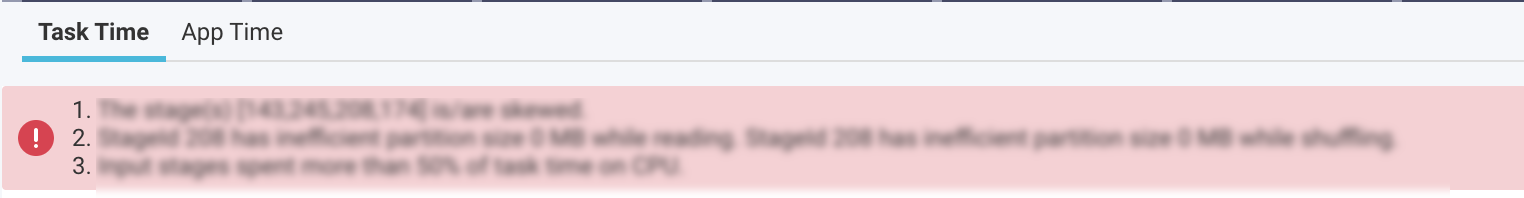
In addition to the above metrics, at the bottom, there is a section called Top Stages. Here the top three stages are listed that contribute the most to the stage types.
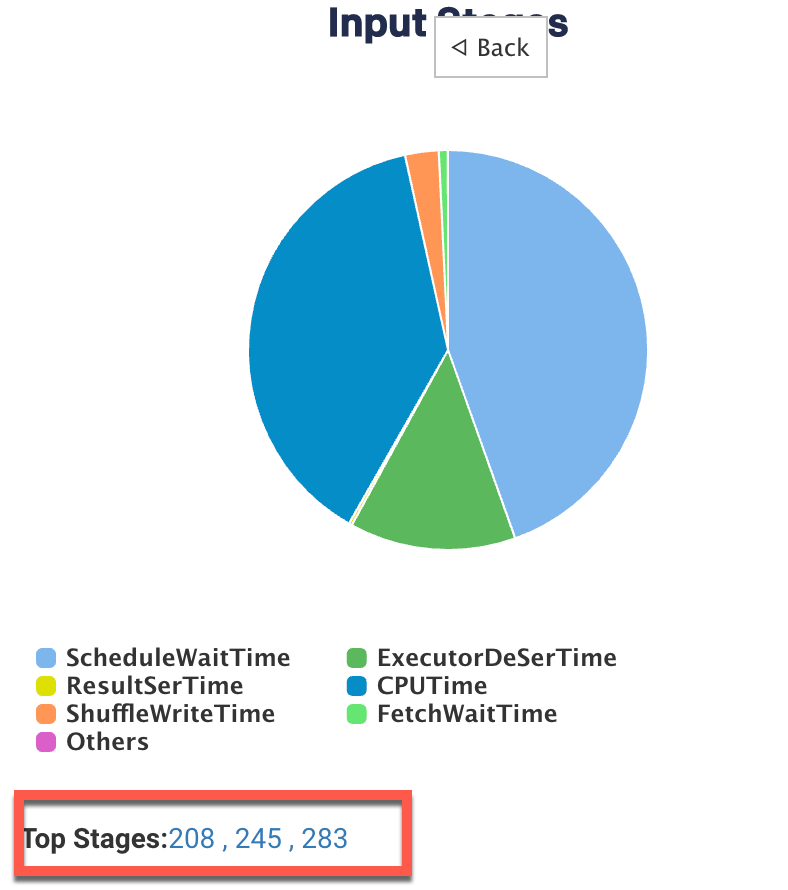
Click the link of a Top stage to view the stage-level details of the metrics. The metrics are the same as a stage type, only the values belong to a specific stage.