Logstash
This tab lets you monitor various metrics for Logstash. You can select a period to monitor the metrics for each Logstash instance and pipeline. The Logstash monitoring can be enabled by configuring the Logstash properties in the unravel.properties file.
Enable Logstash monitoring
To enable monitoring for Logstash in Unravel:
Set the properties for Logstash. Refer to ELK configuration for the method to set the properties.
View Logstash metrics
By default, the cluster metrics are summarized and shown for all the nodes in the cluster for the past one hour. To view the Logstash cluster KPIs for a specific time period:
Go to Clusters > Logstash.
Select a period range.
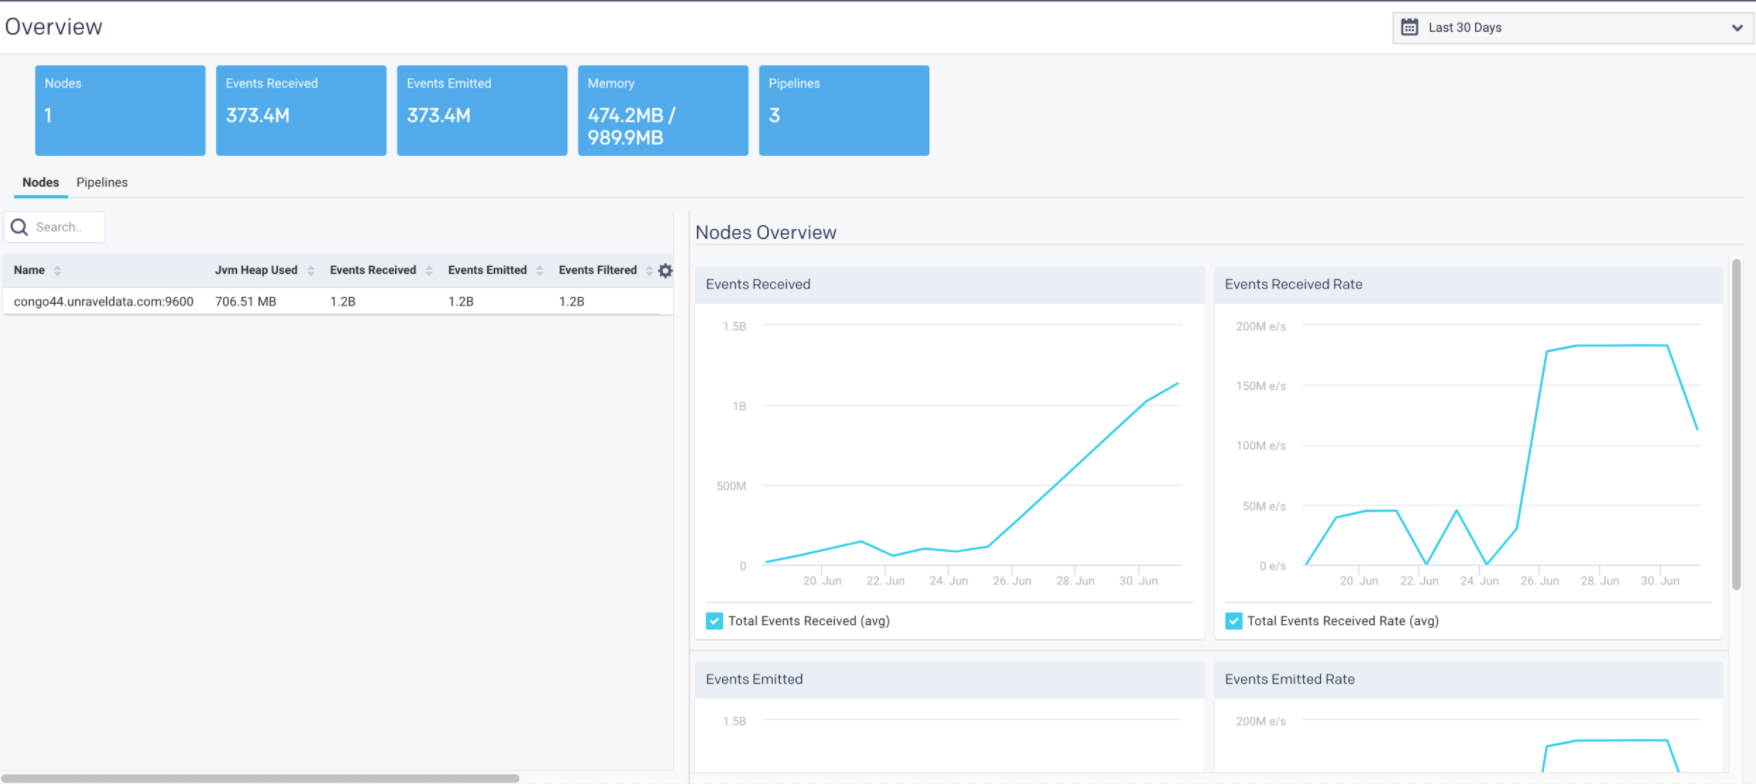
The following Logstash KPIs are displayed on top of the page:
Cluster metrics Metric
Description
Nodes
Total number of nodes in the cluster.
Events Received
Average of the number of events flowing into all the nodes, in a selected time period.
Events Emitted
Average of the number of events flowing out of all the nodes, in a selected time period.
Memory
The total heap memory used versus total heap memory available. (Heap memory used/Total heap memory available)
Pipelines
Total number of logical pipelines.
View Logstash node metrics
You can monitor the Logstash metrics at the node level. To view the metric details of a specific node in a Logstash cluster:
Go to Clusters > Logstash.
Select a period range.
Click the Nodes tab. All the nodes in the cluster and the corresponding details are listed in the Nodes tab.
Select a node. The node details are displayed in a table. The node metrics are displayed on the upper right side.
You can use the toggle button
 to sort the columns, of the node details table, in an ascending and descending order. You can also click the
  icon to set the columns to be displayed in the Nodes tab.
Node details The following details are displayed for each node:
Column
Description
Name
Name of the node.
Jvm Heap Used
JVM heap memory used.
Events Received
Current number of events flowing into the selected node.
Events Emitted
Current number of events flowing out of the selected node.
Events Filtered
Current number of events that are filtered for the selected node.
Node metrics The following node metrics are displayed for the selected node:
Node Metrics
Description
Version
Logstash version.
CPU Usage
Average CPU usage for the selected period of time.
Uptime
Time since the node has been up and active.
Reloads
Successful reloads versus the total number of reloads.
Node graphs The following graphs plot various Logstash KPIs for a selected node in a specified time range:
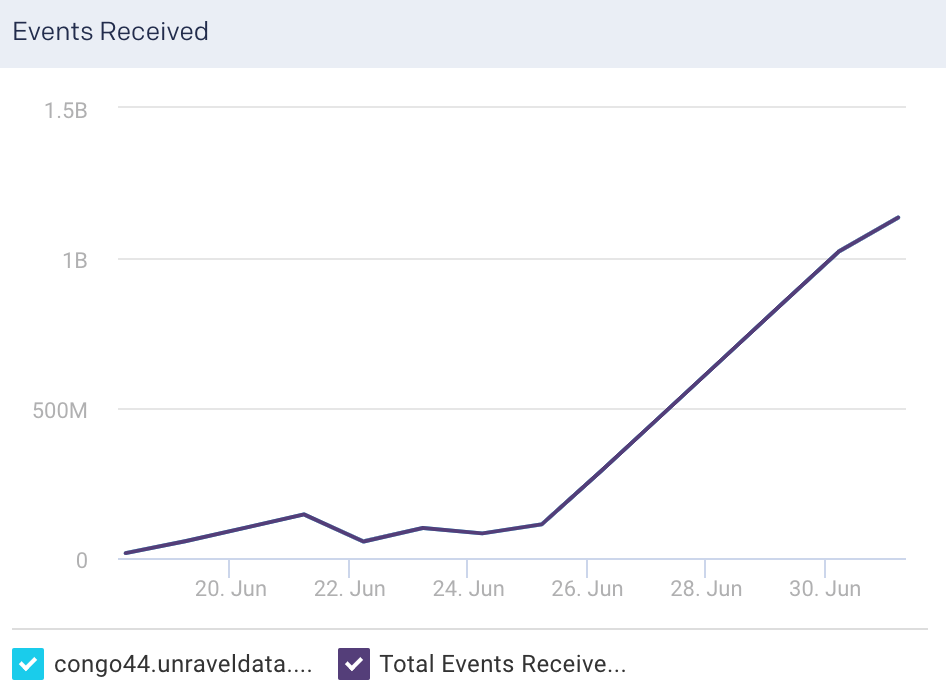
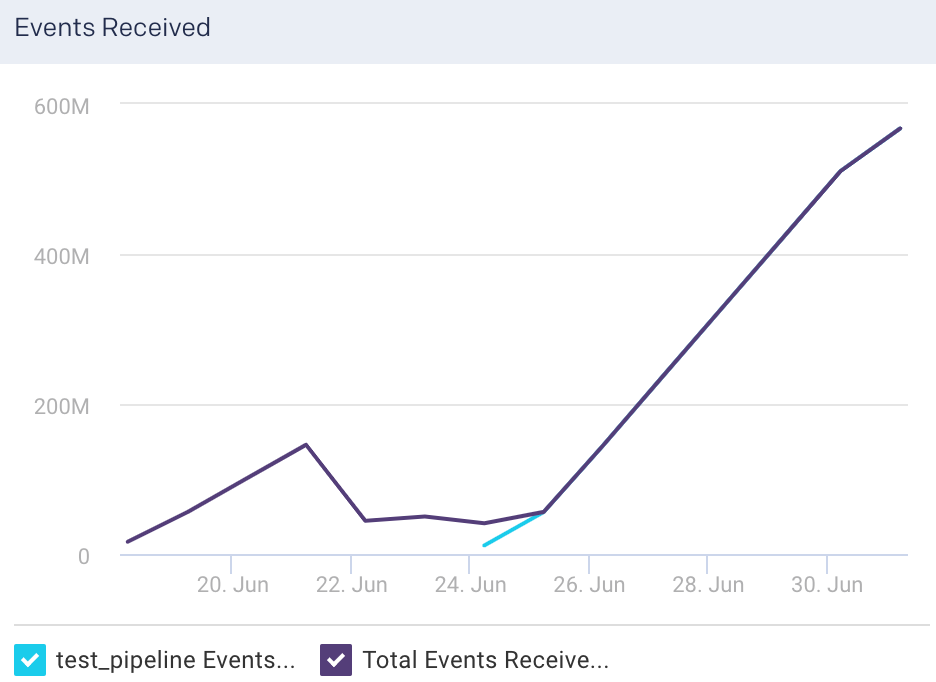
Events Received: This graph plots the average of the total events flowing into the selected node, for the specified time period.
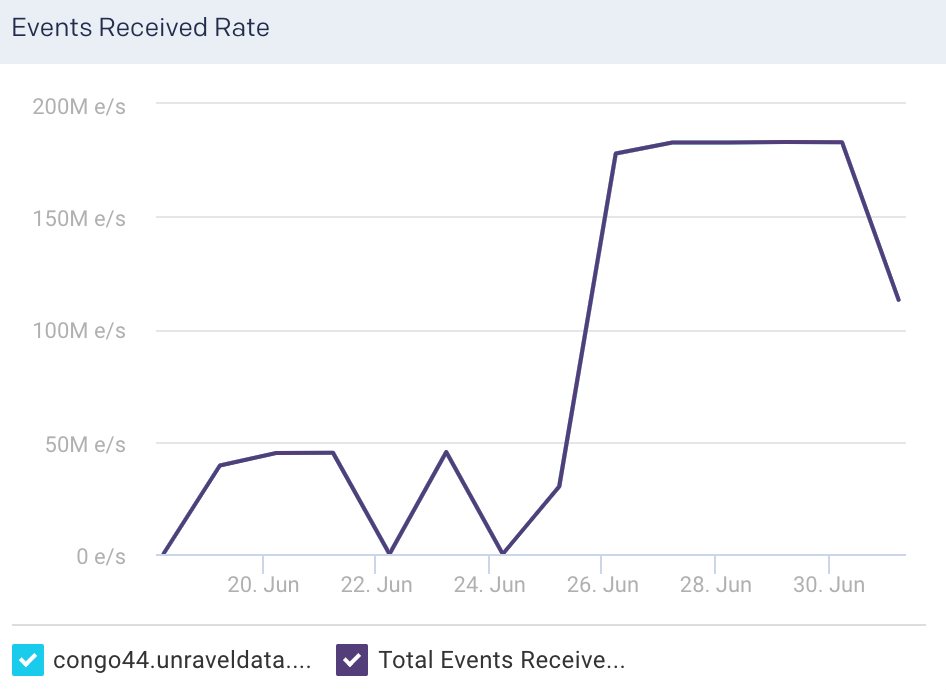
Events Received Rate: This graph plots the average rate at which events flow into the selected node, for the specified time period.
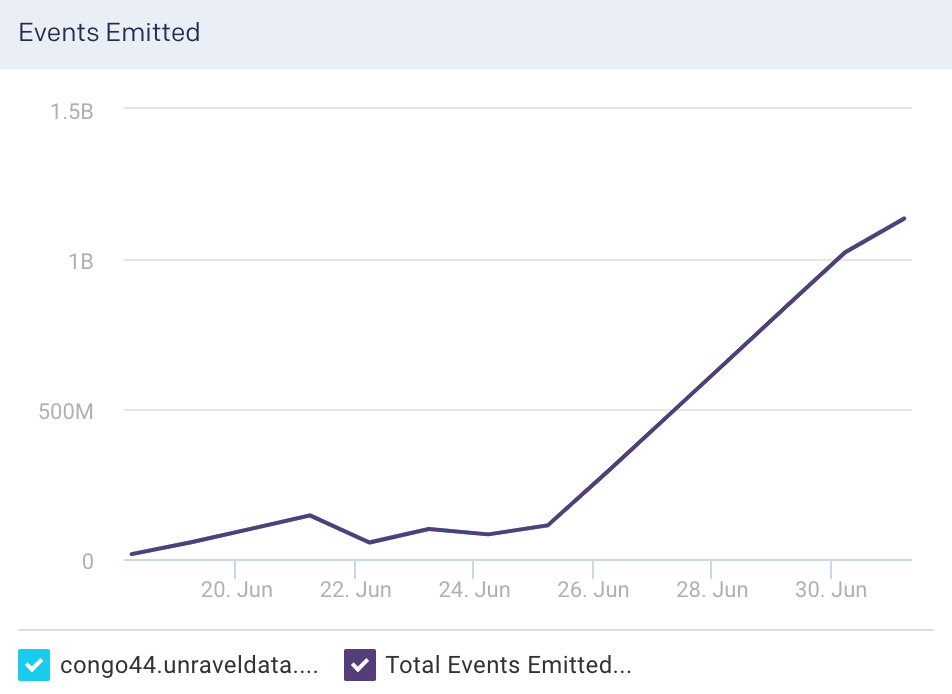
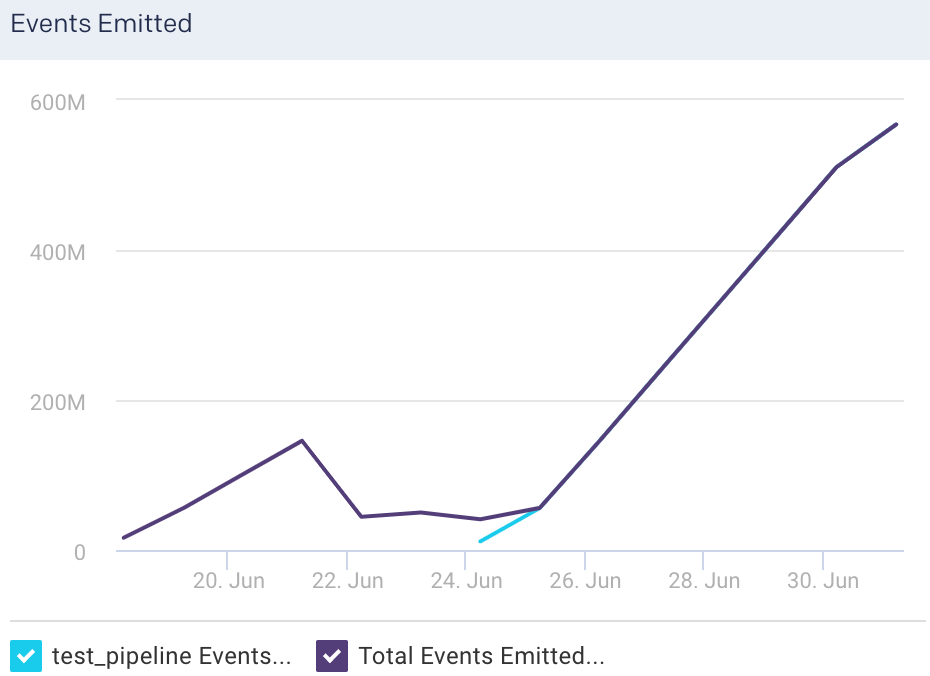
Events Emitted: This graph plots the average of the total events flowing out of the selected node, for the specified time period.
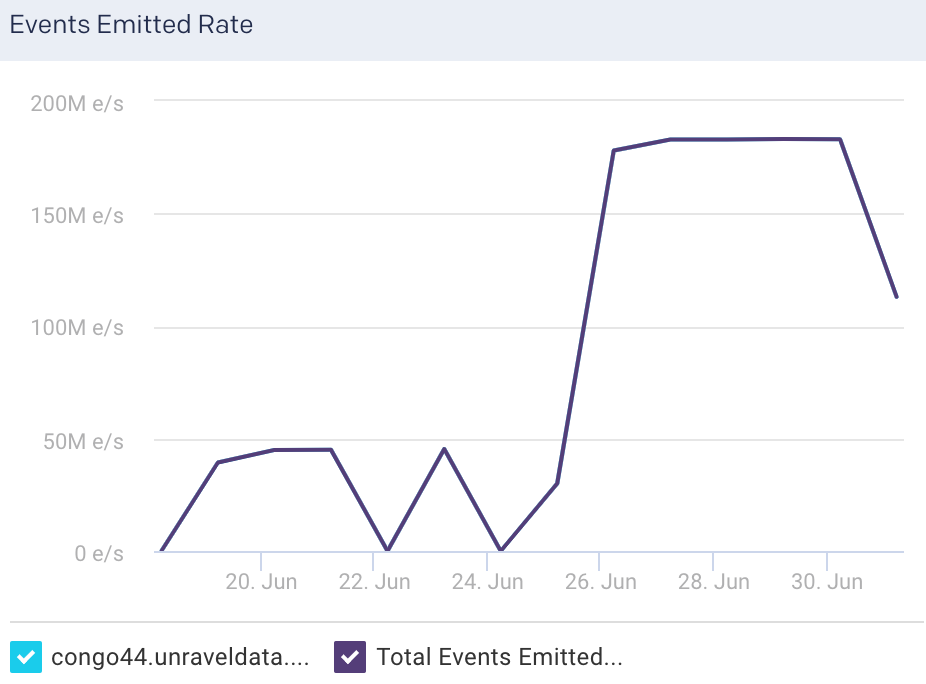
Events Emitted Rate: This graph plots the average rate at which events flow out of the selected node, for the specified time period.
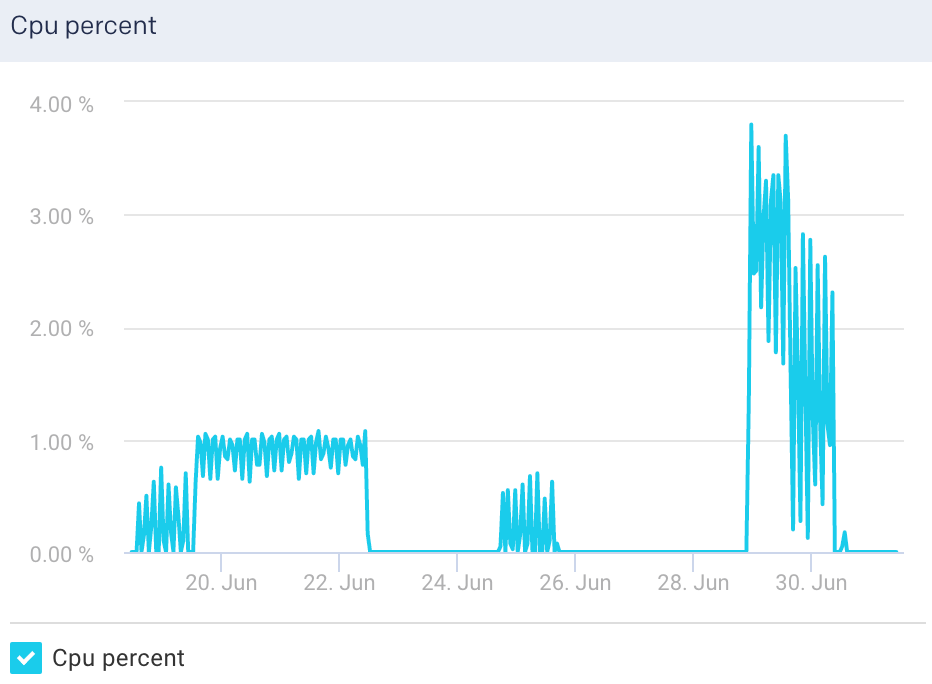
Cpu Percent: This graph plots the percentage of CPU usage for the Logstash process in the selected node.
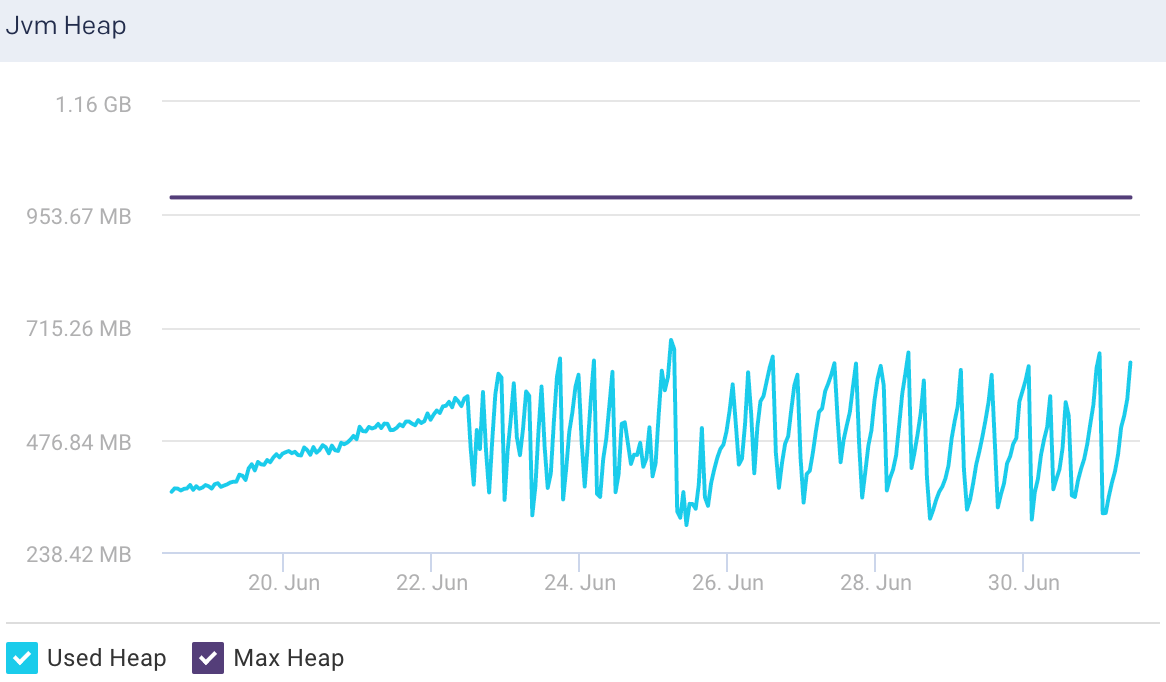
Jvm Heap: This graph plots the total heap used by Elasticsearch in the JVM for a selected node.
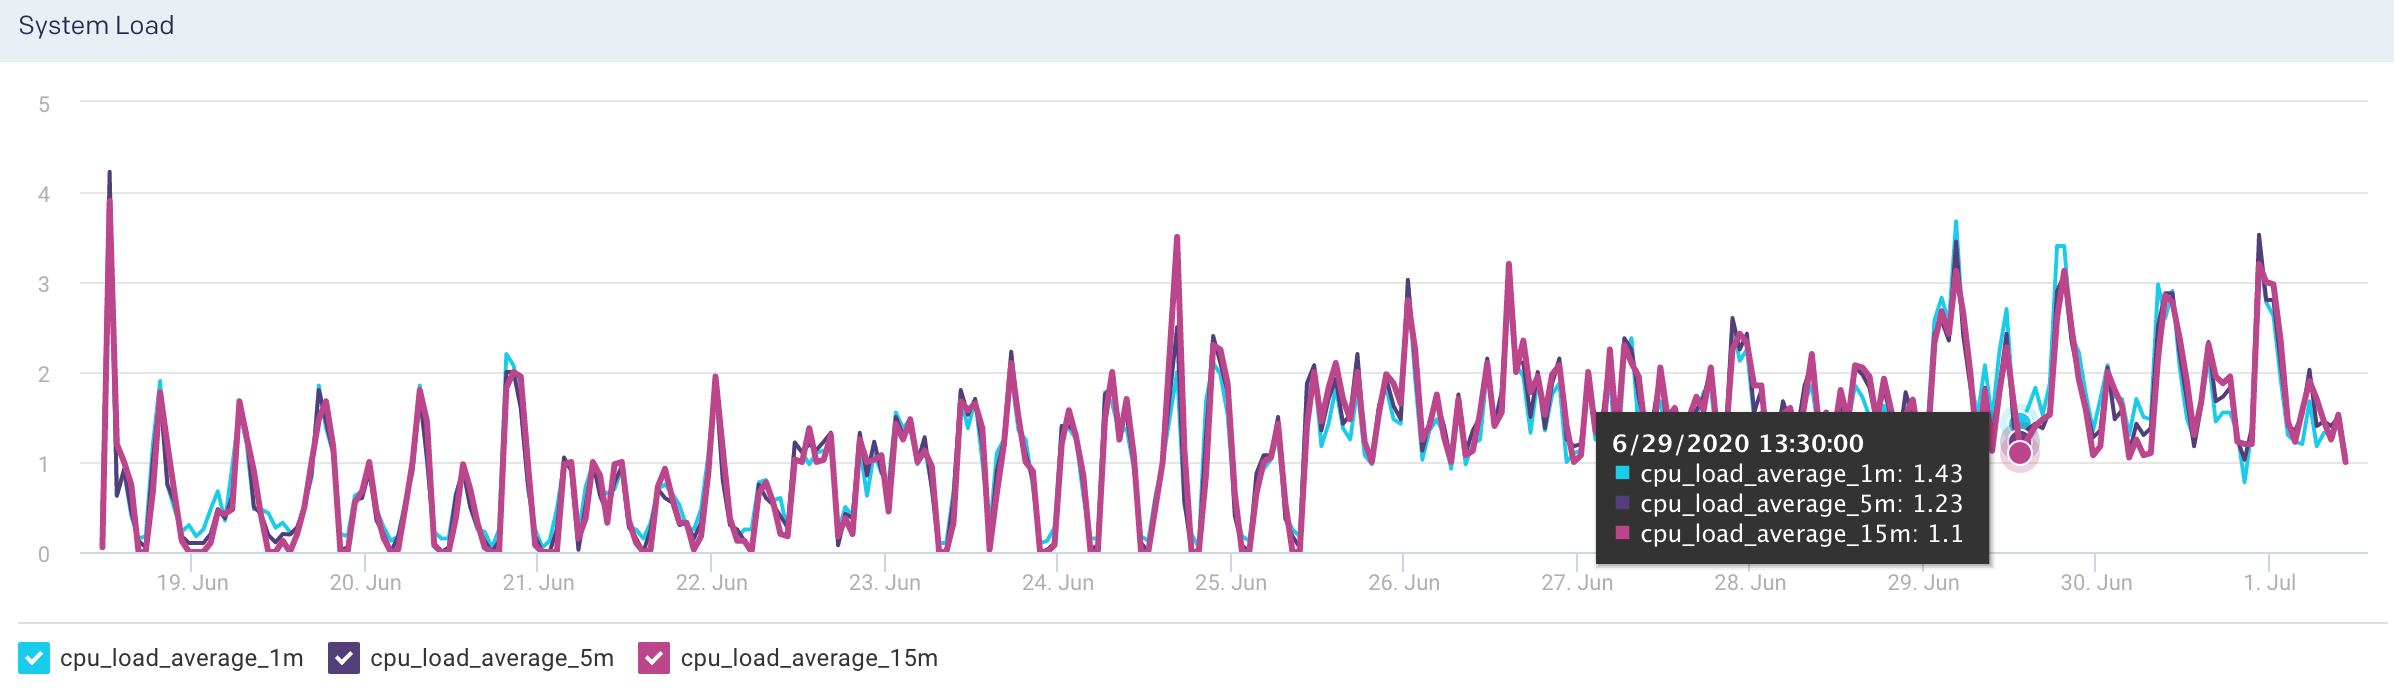
System Load: The graph plots the load average per minute for the selected node.
View Logstash pipeline metrics
To view the metric details of a pipeline in a Logstash cluster:
Go to Clusters > Logstash.
Select a period range.
Click the Pipelines tab. All the pipelines in the cluster are listed in the Pipelines tab.
Select a pipeline. The pipeline details are displayed in a table. The pipeline metrics are displayed on the upper right side.
You can use the toggle button
to sort the columns, of the pipeline details table, in an ascending and descending order. You can also click the icon to set the columns to be displayed in the Pipelines tab.Pipelines details The following details are displayed for the corresponding pipelines:
Column
Description
Name
Name of the node.
Events Received
Current number of events flowing into the selected pipeline.
Events Emitted
Current number of events flowing out of the selected pipeline.
Events Filtered
Current number of events that are filtered for the selected pipeline.
Number of Nodes
Total number of nodes in the pipeline.
Pipelines metrics The following metrics are displayed for the selected pipelines:
Pipelines Metrics
Description
Reload Interval
Time interval that specifies how often Logstash checks the config files for changes in the pipeline (in seconds).
Batch size
Maximum number events that an individual worker thread collects before executing filters and outputs
Reloads
Successful reloads versus total number of reloads
Workers
Number of threads to run for filter and output processing.
Pipelines graphs The following graphs plots various metrics for the selected pipelines in a specified time range:
Events Received: This graph plots the average of the total events flowing into the selected pipeline, for the specified time period.
Events Received Rate: This graph plots the average rate at which events flow into the selected pipeline, for the specified time period.
Events Emitted: This graph plots the average of the total events flowing out of the selected pipeline, for the specified time period.
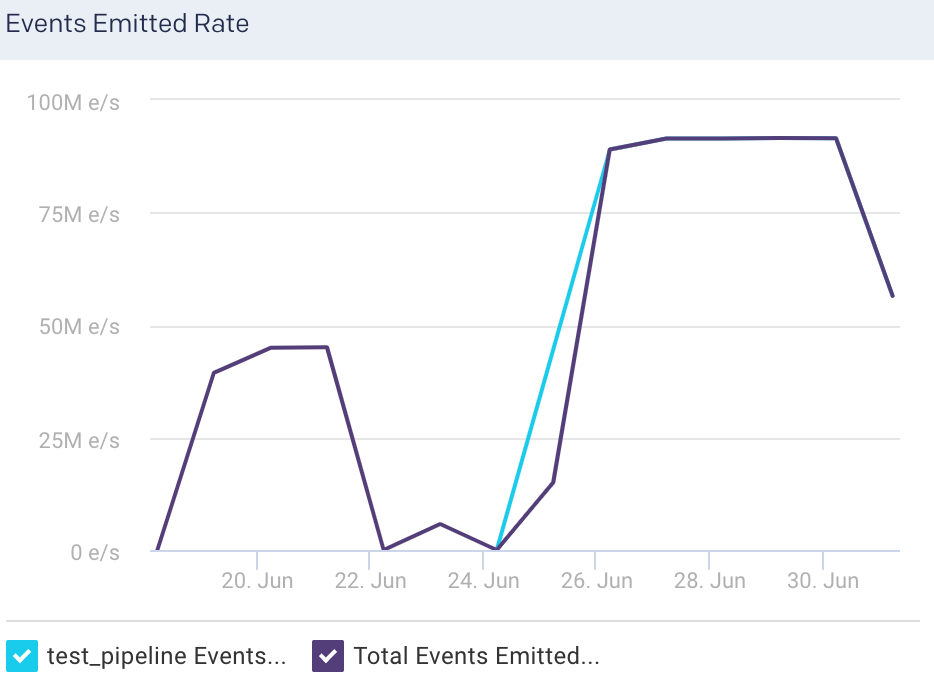
Events Emitted Rate: This graph plots the average rate at which events flow out of the selected pipeline, for the specified time period.