Compute (Databricks)
Note
This tab is visible only for Databricks clusters.
The Compute tab displays the list of Databricks clusters tracked by Unravel. Each cluster has a separate tab that contains information about the cluster's metadata, KPIs, configurations, trends, and Unravel's analysis. In addition, you can filter the clusters based on the status, duration, user, workspace, cluster type, and tags. The Compute tab consists of the following tabs:
All: Lists all the clusters and their details.
Finished: Lists the clusters where the jobs have completed the runs.
Running: Lists the clusters where the jobs are in the running status.
Inefficient: Lists the inefficient clusters.
The cluster list displays the following columns:
Columns | Description |
|---|---|
Status | Status of the cluster. |
Cluster Name | Name of the Databricks cluster. Click the link of the cluster name to view the details of the cluster session. |
Cluster Type | Type of the Databricks cluster.
|
User | Name of the user running the jobs on the cluster. |
Insights | Displays the ( |
Workspace | Name of the Databricks workspace. |
Start time | The start time and day of the cluster. |
Duration | Total time taken by the cluster to process the jobs. |
Cost | An estimated cost incurred in running the apps on the cluster. This cost is calculated based on VM and DBU prices. |
Actions | Click to access the Application Details page, where more details of a specific job run on the cluster are displayed. |
Filtering clusters
You can filter clusters by:
Selecting a date and time range of the running clusters.
Using ID or keyword.
Using cluster name
The left sidebar lets you filter the clusters by:
Status: Status of the cluster, success, failed, or killed.
Duration: You can use the slider to set the time range.
User: Name of user, who runs the jobs on the cluster. Click in the text box for a list of valid values.
Workspace: Databricks workspaces. Click in the text box for a list of valid values. Click the value to select it.
Cluster Type: The type of cluster; Interactive, Automated, or Automated Light. Click in the text box for a list of valid values. Click the value to select it.
Tags: List of created tags. Click the checkbox next to the tag and then click in the text box for the valid values.
Events: This filter is only available in the Inefficient tab. You can filter the inefficient apps based on the associated events.
Viewing a cluster session
On the Unravel UI, navigate to Compute > All/Finished/Running/Inefficient tab.
Click the link in the Cluster Name column for the cluster you want to view. The cluster session page is displayed.
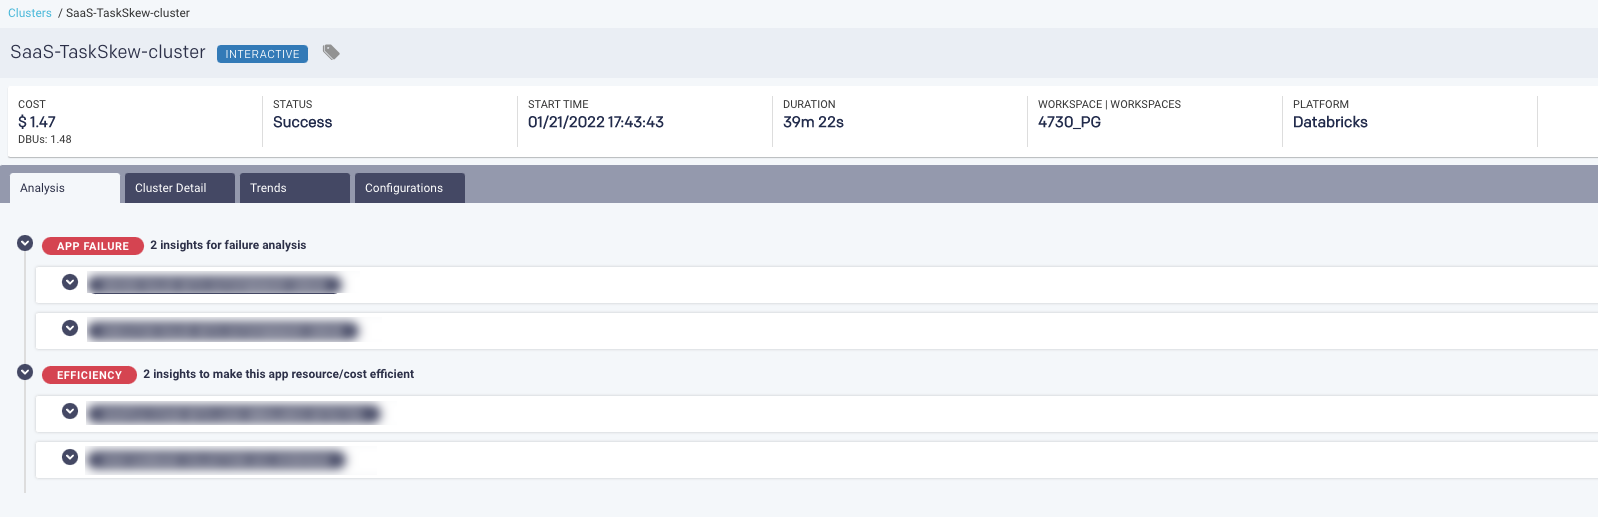
From the Cluster session page, you can get a quick reference of the following:
Name of the cluster
Type of the cluster
The cost incurred for the cluster
Status of the job run on the cluster
Start time of the job on the cluster
End time of the job on the cluster
Workspaces on the cluster
Platform of the cluster
The following tabs are shown for the cluster session.
From this tab, you can view the cluster insights. Unravel's analysis results show where the efficiencies of your app can be improved at the cluster level.
The number of efficiencies found is noted in the tab. When Efficiency leads to a suggested change, those suggestions are listed as Recommendations.
Efficiency (
 ): Suggest areas to examine to improve efficiency. For example, inefficient usage of resources. Expand the Efficiency of reading the in-depth analysis. While some are only configuration property suggestions, others point to areas for examination, for example, inefficient storage, problems with a query, and so on.
Recommendations (
 ): Suggestions to update a property or configuration parameter. Click to view the current and recommended value.
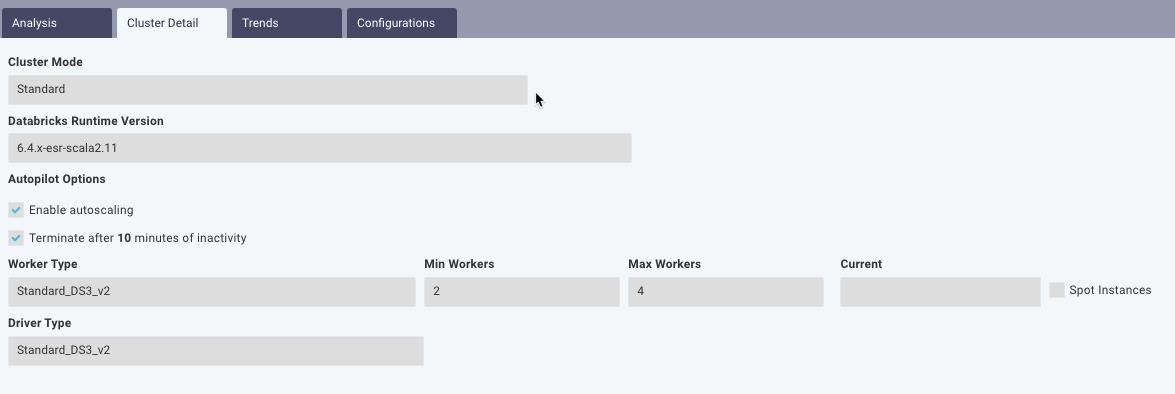
Cluster Detail
The Cluster detail tab shows cluster details such as the Cluster Mode, Databricks Runtime Version, Autopilot Options, Worker Type, Driver Type, etc.
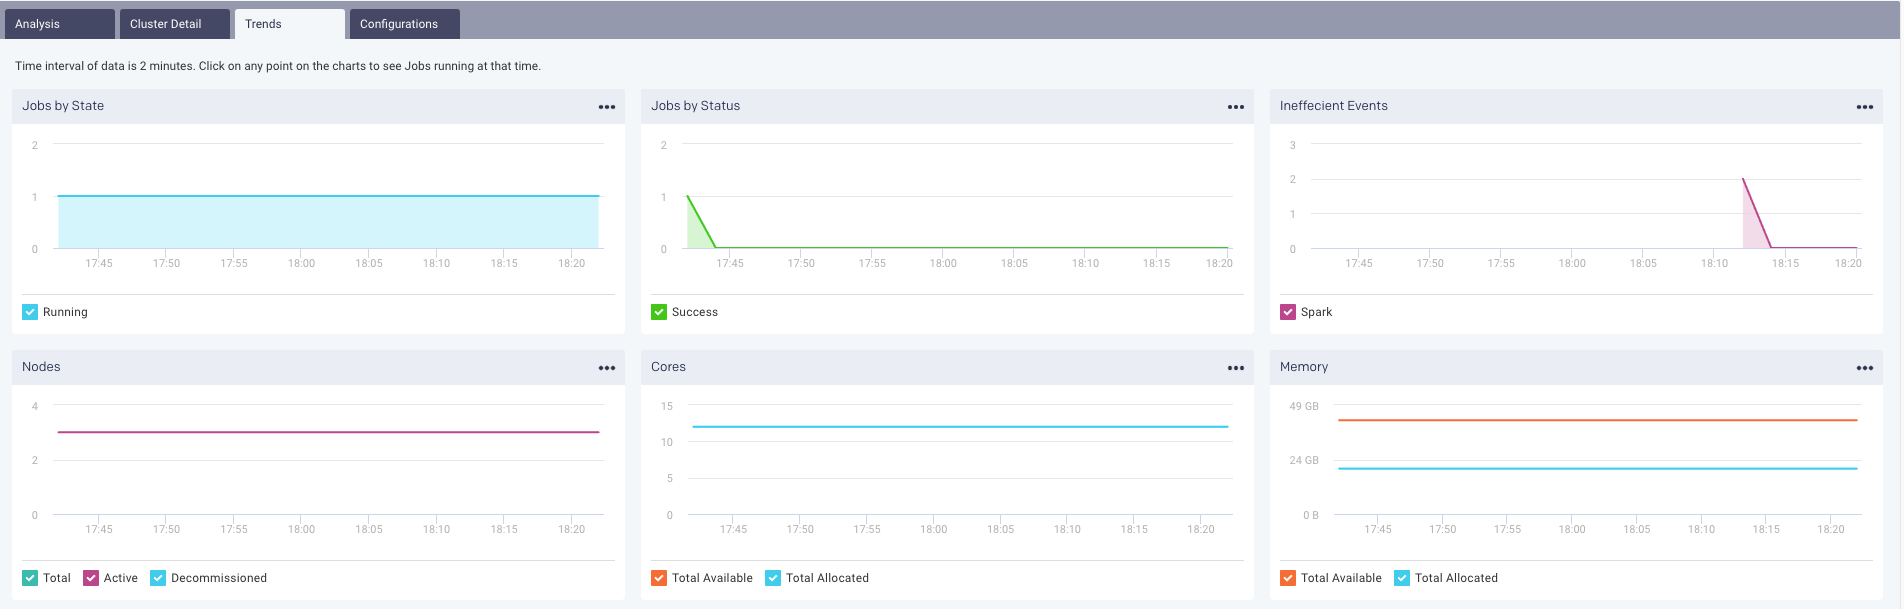
Trends
From the Trends tab, based on the type of the cluster; Interactive or Automated, you can view job trends in the cluster and the trends of the resources that are used for all the jobs.
Interactive cluster
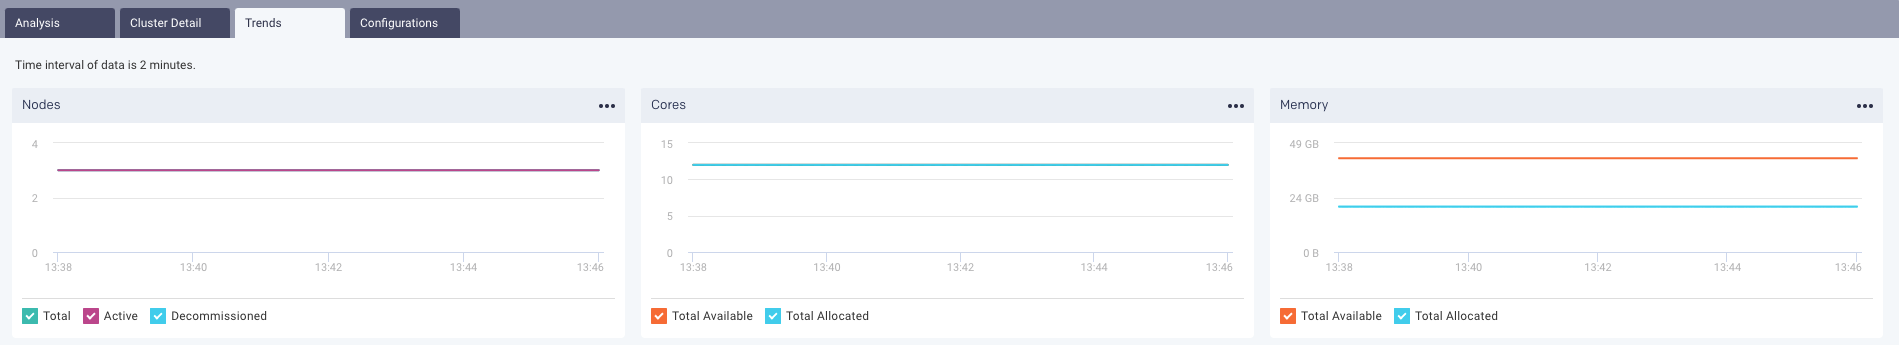
Automated cluster
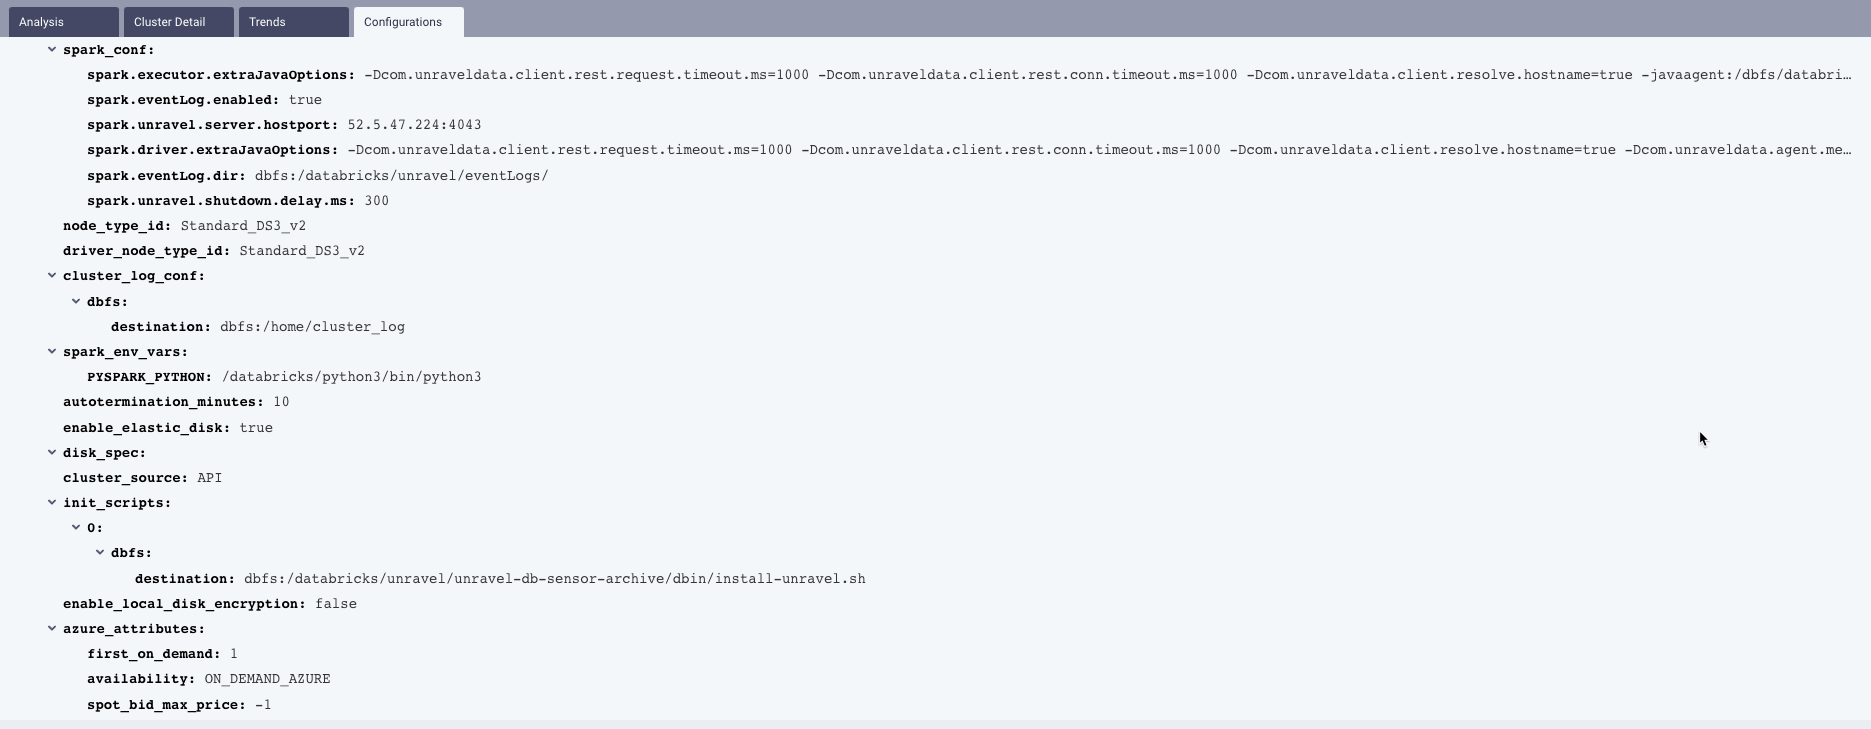
Configurations
From this tab, you can view all the configurations that are set for the chosen cluster.