HBase
Running real-time data injection and multiple concurrent workloads on HBase clusters in production is always challenging. There are multiple factors that affect a cluster's performance or health, and dealing with them isn't easy. Timely, up-to-date, and detailed data is crucial to locating and fixing issues to maintain a cluster's health and performance.
Most cluster managers provide high-level metrics, which while helpful, aren't enough for understanding cluster and performance issues. Unravel provides detailed data and metrics to help you identify the root causes of cluster and performance issues, specifically hot-spotting. This tutorial examines how you can use Unravel's HBase details page to debug issues in your HBase cluster and improve its performance.
To view the HBase monitoring results, you must configure HBase. Refer to Configuring HBase.
Cluster health
Unravel provides cluster metrics per cluster which provide an overview of HBase clusters in the Cluster > HBase tab, where all the HBase clusters are listed. Click a cluster name to bring up the cluster's detailed information.
The metrics are color-coded so you can quickly ascertain your cluster's health, and in case of issues, you can drill down further into them.
Green = Healthy
Red = Unhealthy, alert for metrics and investigation required
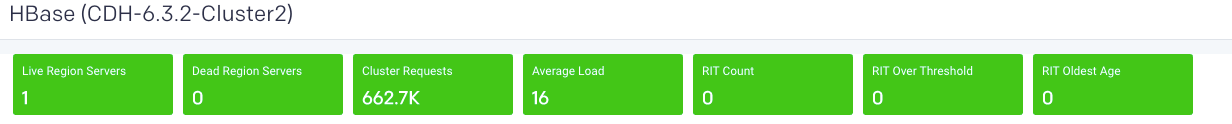
Live Region Servers: the number of running region servers.
Dead Region Servers: the number of dead region servers.
This metric gives you insight into the health of the region servers. In a healthy cluster this should be zero. When the number of dead region servers is one or greater you know something is wrong in the cluster.
Dead region servers can cause an imbalance in the cluster. When the server has stopped, its regions are then distributed across the running region servers. This consolidation means some region servers handle a larger number of regions and consequently have a correspondingly higher number of read, write, and store operations. This can result in some servers processing a huge number of operations while others are idle, causing hot-spotting.
Cluster Requests: the number of read and write requests aggregated across the entire cluster.
Average Load: the average number of regions per region server across all Servers
This metric is the average number of regions on each region server. Like Dead Region Servers, this metric helps you to triage imbalances on clusters and optimize the cluster's performance.
Rit Count: the number of regions in transition.
RitOver Threshold: the number of regions that have been in transition longer than a threshold time (default: 60 seconds).
RitOldestAge: the age, in milliseconds, of the longest region in transition.
Note
Region Server refers to the servers (hosts) while region refers to the specific regions on the servers.
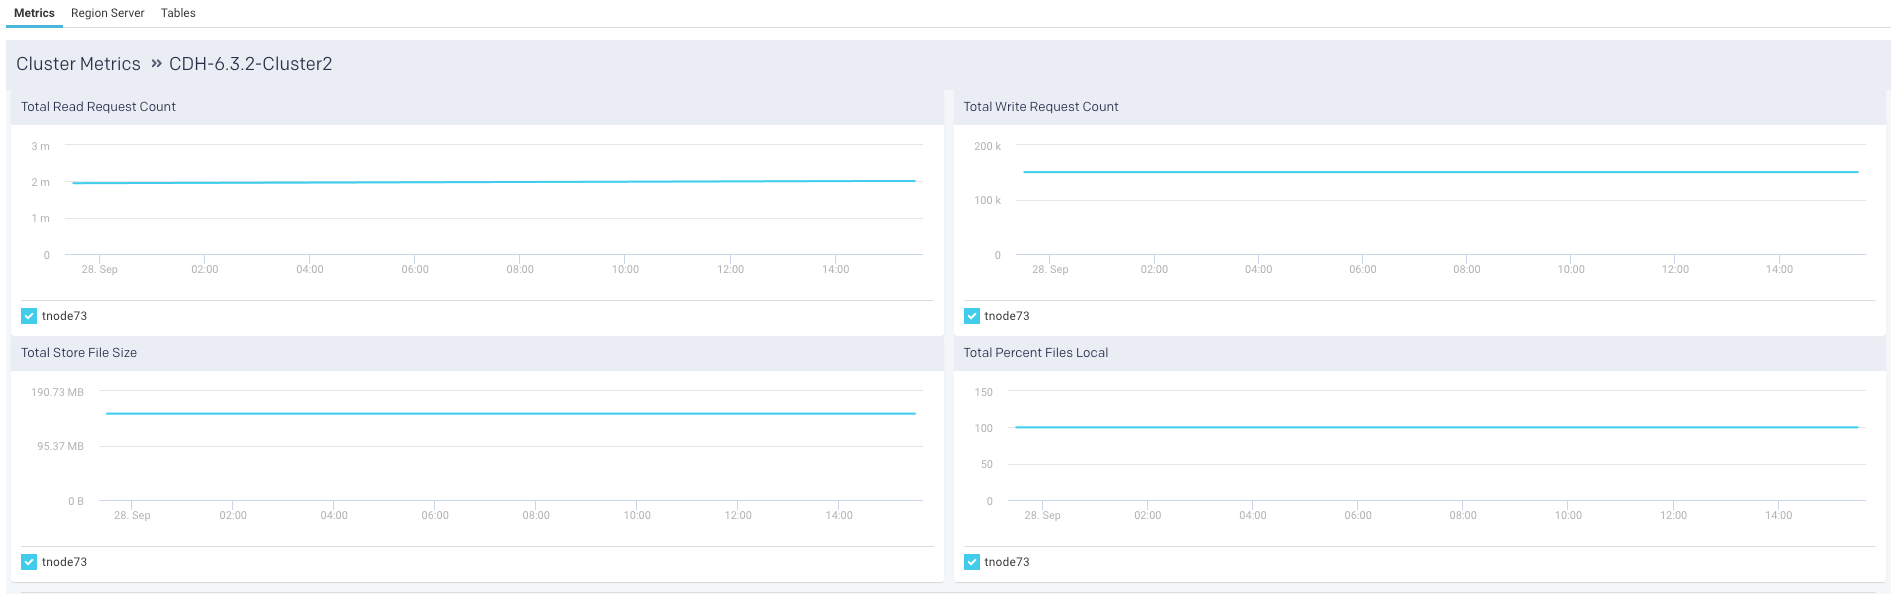
Metrics
The following graphs are plotted in the Metrics tab:
Region server
Unravel provides a list of region servers, their metrics, and Unravel's insight into the server's health for all region servers across the cluster for a specific point in time.
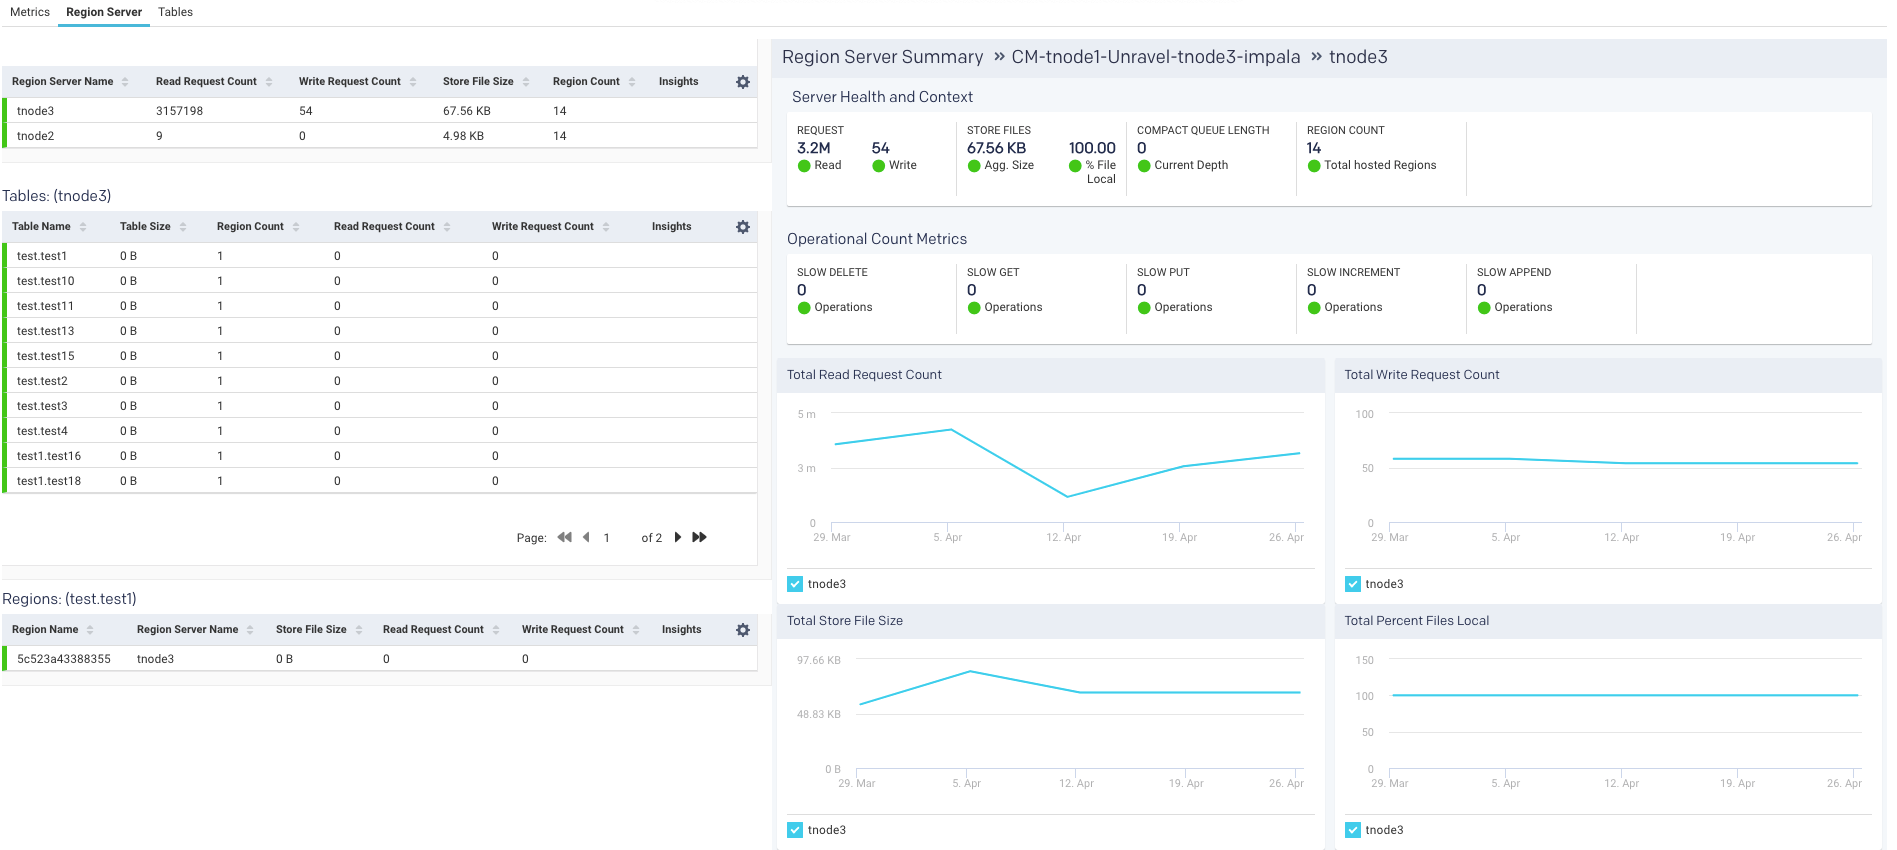
For each region server, the table lists the Region Server Name , and the server metrics Read Request Count, Write Request Count, Store File Size, Percent Files Local, Compaction Queue Length, Region Count, and Insights for each server. These metrics and insights are helpful in monitoring activity in your HBase cluster.
An icon is displayed in the Insights column, and you can quickly find out if the server is in trouble. Hover over the icon to see a tooltip listing the hot-spotting notifications with their associated threshold (Average value * 1.2). If any value is above the threshold, the region server is hot-spotting.
Further Server Health and Context and Operational count metrics are provided on the right:
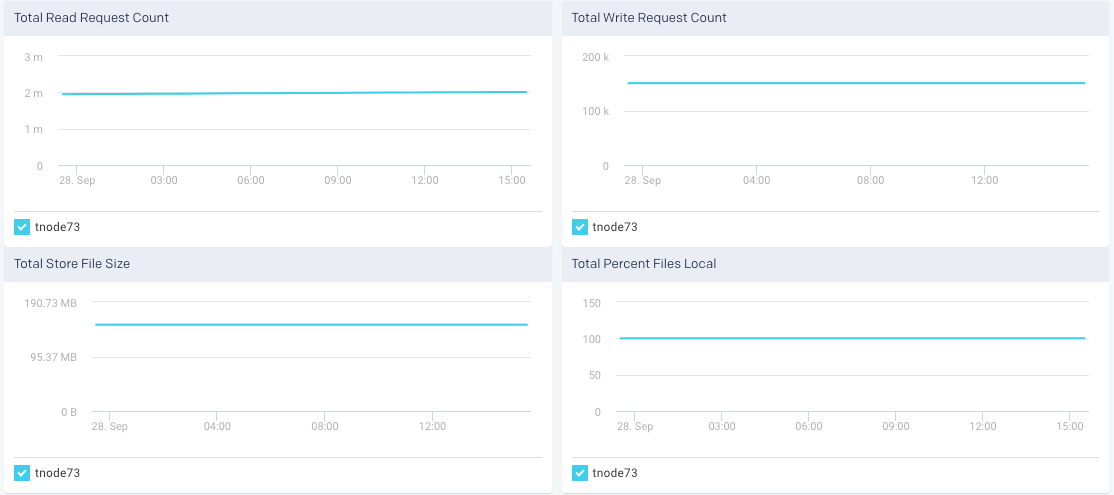
Region server metric graphs
Beneath the table are four graphs Total Read Request Count, Total Write Request Count, Total Store File Size, and Total Percent Files Local. These graphs are for all metrics across the entire cluster. The time period the metrics are graphed is noted above the graphs.
Tables
The last item in the Cluster tab is a list of tables. This list is for all the tables across all the region servers across the entire cluster. Unravel then uses these metrics to attempt to detect an imbalance. Averages are calculated within each category, and alerts are raised accordingly. Similar to the region servers you can view the Insights of the table.
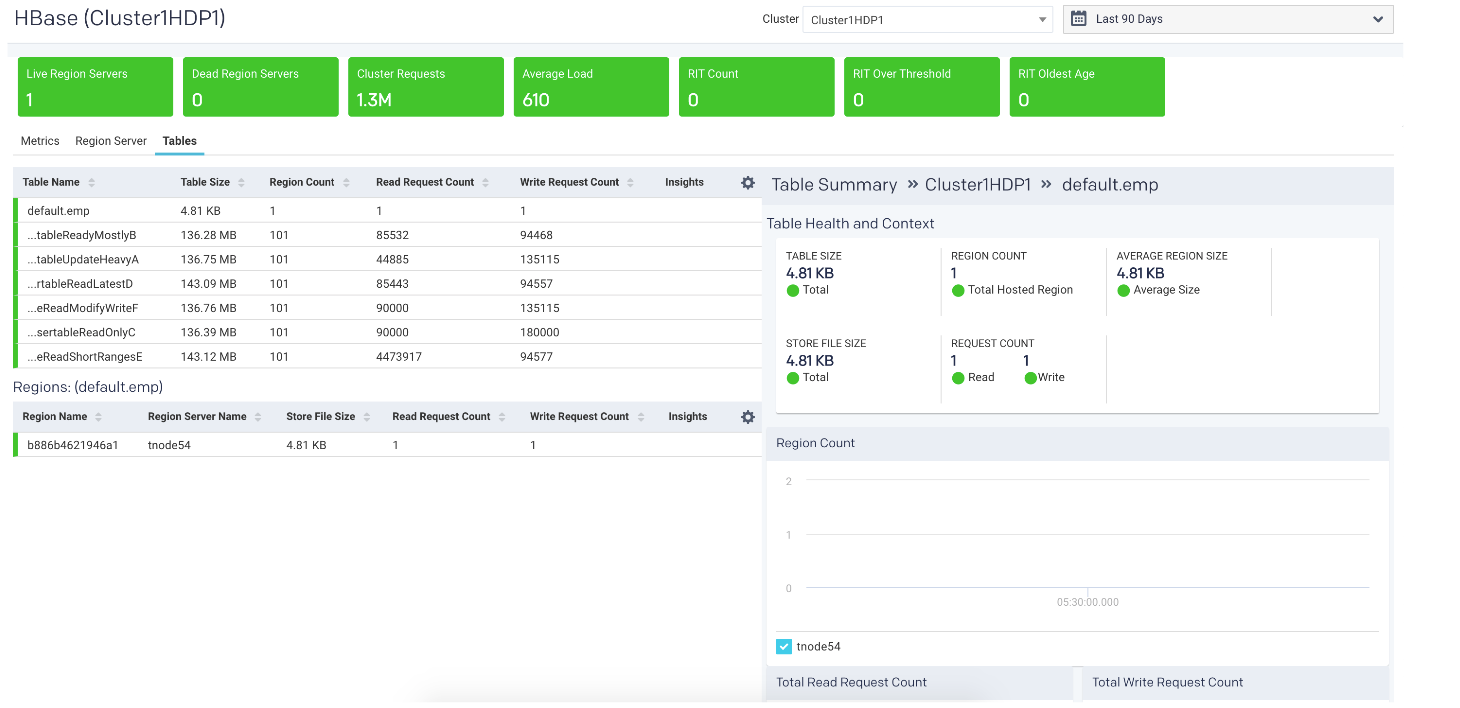
The list is searchable and displays the Table Name, Table Size, Region Count, Average Region Size, Store File Size, Read Request Count, Write Request Count, and finally, Insights. Hover over the insights to view a tooltip listing the hot-spotting. Bad health indicates that a large number of store operations from different sources are redirected to this table. In this example, the Store File Size is more than 20% of the threshold.
You can use this list to drill down into the tables and get their details which can be useful for monitoring your cluster.
Click a table to view its details, which include graphs of metrics over time for the region, a list of the regions using the table, and the apps accessing the table. The following is an example of the graphed metrics, Region Count, Total Read Request Count, and Total Write Request Count.
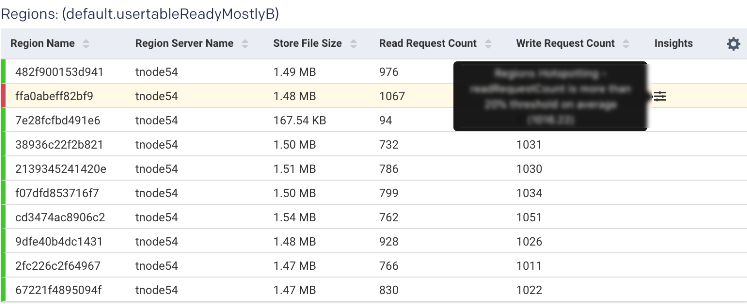
Region
Once in the Table view, click the Region tab to see the list of regions accessing the table.
The table list shows the Region Name, Region Server Name, and the region metrics Store File Size, Read Request Count, Write Request Count, and insights. These metrics are useful in gauging activity and load in the region. The region health is important in deciding whether the region is functioning properly. In case any metric value is crossing the threshold, the status is listed as bad. A bad status indicates you should start investigating to locate and fix hot-spotting.