Job Runs
The Job Runs tab provides details about the job execution within different applications.
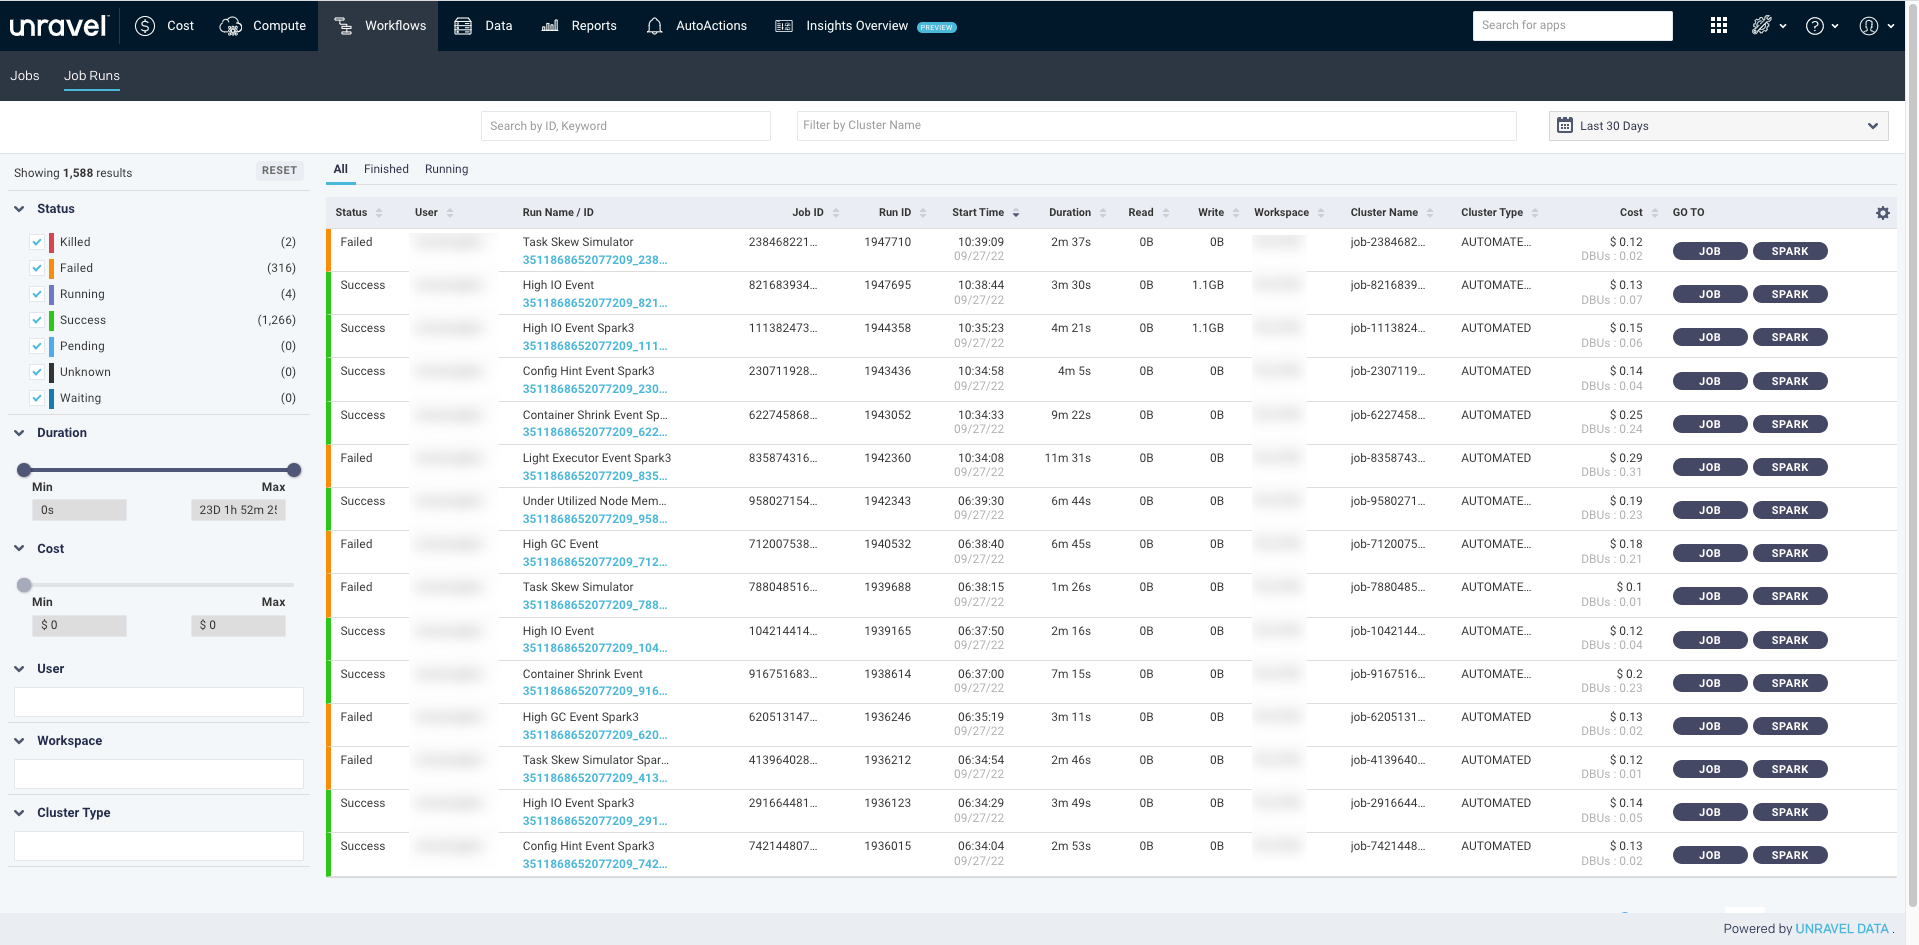
The details of a job run are listed in the following columns:
Columns | Description |
|---|---|
Status | App status. |
User | Name of the user who has run the job. |
Run Name/ID | Name and ID of the job run. |
Job ID | Unique ID of the job. |
Run ID | Unique ID of the run across a workspace. |
Start time | The start time and day of the application. |
Duration | Total time taken by the application. |
Read | Total read operations by the application. |
Write | Total write operations by the applications. |
Workspace | Name of the Workspace. |
Cluster Name | Name of the Databricks cluster. |
Cluster Type | Type of the Databricks cluster. (Interactive, Automated, and Automated Light). |
Cost | An estimated cost incurred in running the app. This cost is calculated based on VM and DBU prices. |
Go To | Links to access more details of a specific job. Refer to Jobs or Spark detail page. |
Filtering Job Runs
You can filter the job runs using any of the following options:
Date and Time: Select a date and time range of the apps using the date picker above the table.
ID, Keyword: Use any ID such as Job ID, Run ID, or any keyword to filter the list.
Cluster name: Select a cluster to filter the job runs of a specific cluster.
Filtering options: You can filter the applications using any of the following filtering options on the left panel:
Status: Select any of the following statuses, and the applications matching the status are displayed:
Success
Failed
Killed
Running
Waiting
Pending
Unknown
Duration: You can use the slider to set the range. The job runs matching the duration are displayed.
Cost: You can use the slider to set the range. The job runs matching the cost are displayed.
User: Click the text box and select a user. The corresponding job runs are displayed.
Workspace: Click the text box and select a workspace from the list. The corresponding job runs are displayed.
Cluster Type: Click the text box and select a cluster type from the list. The corresponding job runs are displayed.
You can click the link in the Run Name/ ID column to bring up the Application Details page.