Cluster discovery
The Cluster discovery report provides overall information about your cluster. The report includes the following sections:
On-Prem Cluster Identity contains the cluster configuration details and host information.
Overall cluster usage graphs of:
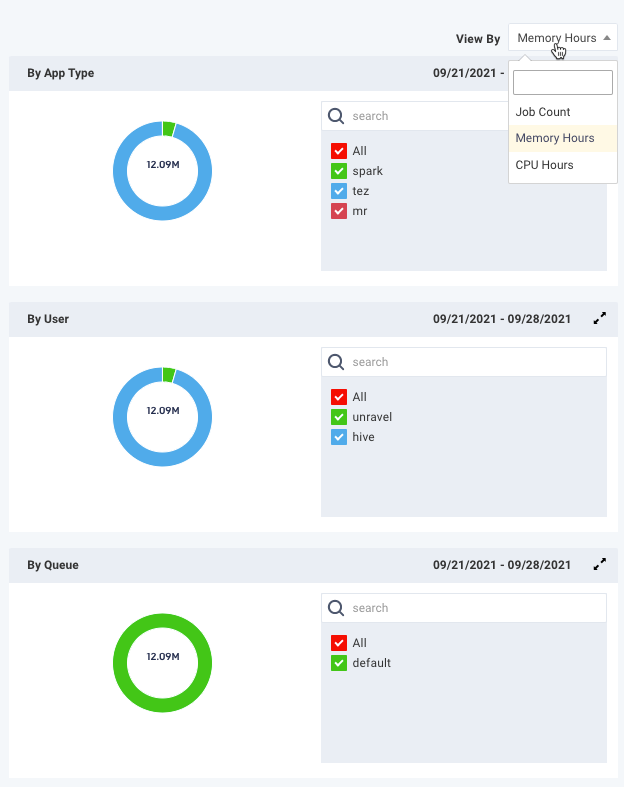
Applications that are submitted By App Type, By user, and By queue.
CPU
Memory
A CPU/Memory heat-map that aggregates usage by weekday, and then hour within the day.
You can download the Cluster discovery report in a PDF or JSON format.
Configuring Cluster Discovery report
For the Cluster Discovery report, ensure that the configuration for Migration reports is set.
Generating Cluster Discovery report
Go to Migrations > Cluster Discovery.
Click the Run button to generate a new report.
Select a period range from the date picker and click Run to generate the report.
The progress of the report generation is shown on the top of the page and you are notified about the successful creation of the report.
All reports (successful or failed attempts) are in the Reports Archive.
Note
Before the initial report generation, the default is a seven-day history.
Scheduling Cluster Discovery report
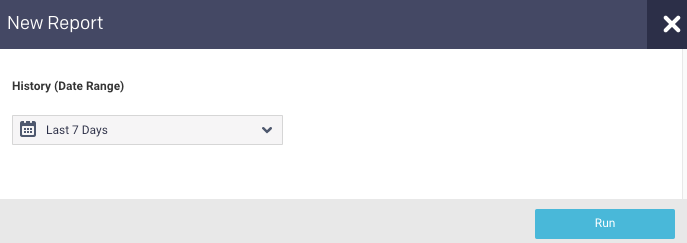
Click Schedule to generate the report regularly and provide the following details:
History (Date Range): Select a period from the date picker.
Schedule Name: Name of the schedule.
Schedule to Run: Select any of the following schedule options from the drop-down and set the time from the hours and minutes drop-down:
Daily
Weekdays (Sun-Sat)
Every two weeks
Every month
Notification: Provide an email ID to receive the notification of the reports generated.
Click Schedule.
Viewing the Cluster Discovery report
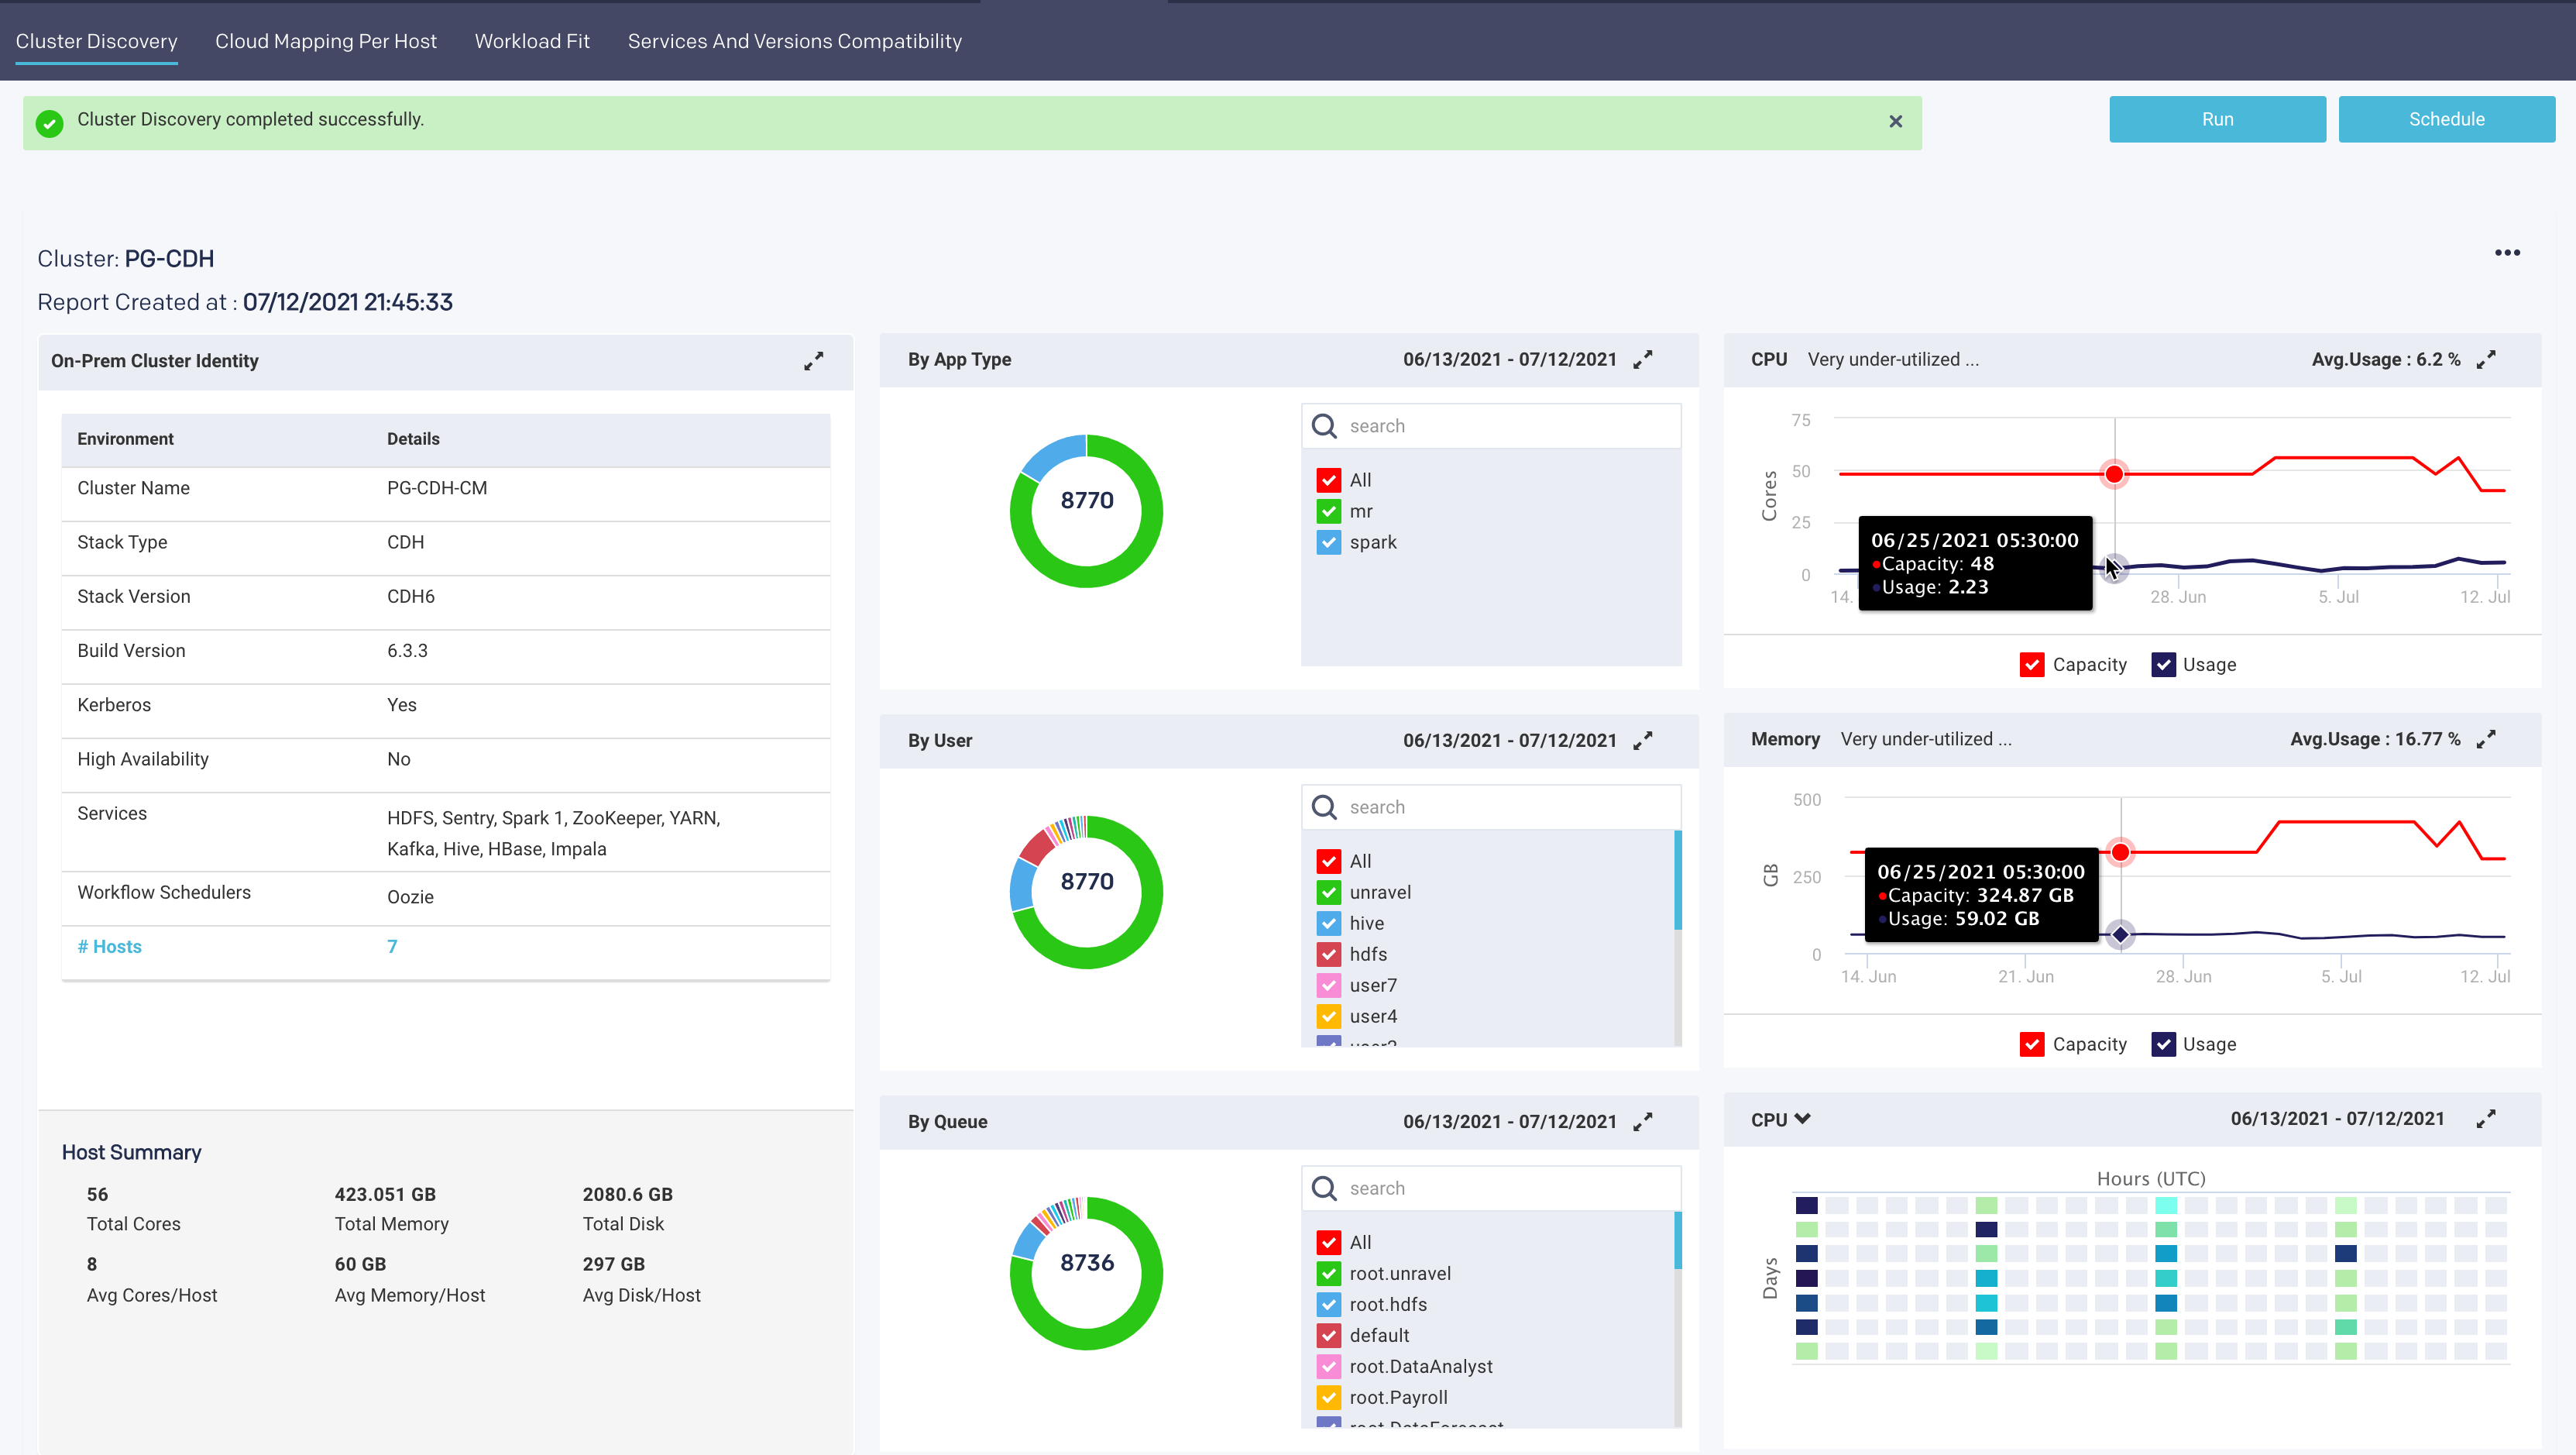
This tile contains information about your cluster, including the hosts. The Host Summary section shows the cluster's capacity across all hosts.
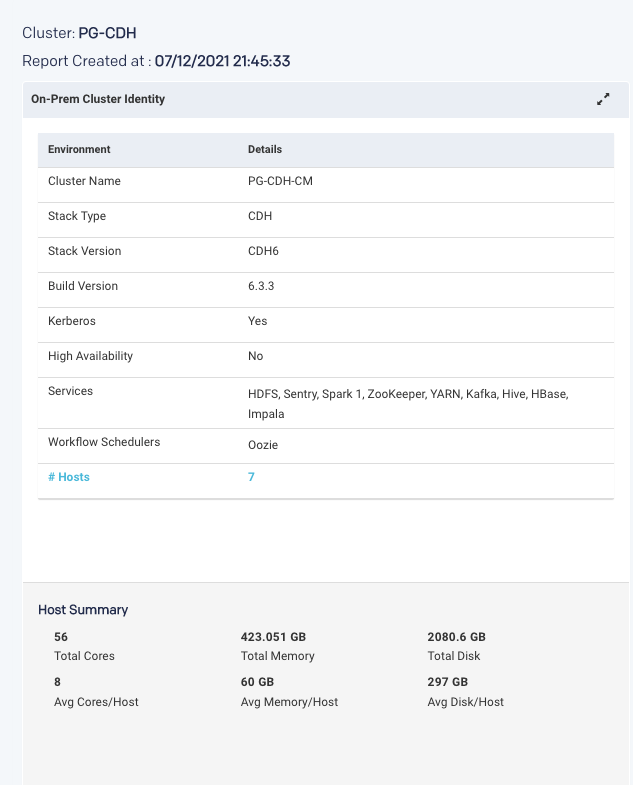
To see each host's hardware specifications and the host's roles, click the # Hosts link. The table can be searched on hostname. The potential host roles are:
Server: Has at least one server component, such as Zookeeper Server, HDFS.
Worker: Has at least one daemon component such as HDFS DataNode, YARN NodeManager, or HBase RegionServer.
Client: Has at least one client component, such as Zookeeper Client, Hadoop Client, Hive Client, etc.
The donut graph shows the job count, memory hours, CPU hours for all the applications grouped by app type, user, and queue. The top 10 in each category are displayed. You can select or deselect the checkboxes in each category to change the graph view.
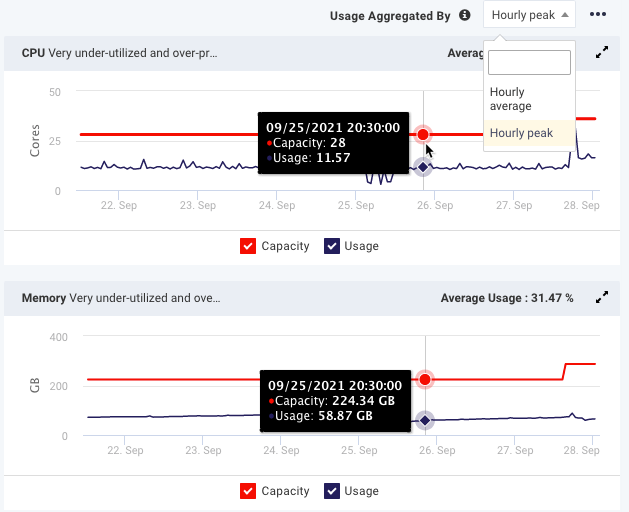
The graphs display the cluster's CPU and memory utilization over the time period. The capacity and the actual usage trends are plotted on the graph. The usage values can be aggregated and displayed for hourly average or hourly peak. Hover over the graph lines to view the capacity and actual usage in an hourly interval. The average usage is listed on the right-hand side of the title bar. Hover over the text next to the resource's name to view Unravel's analysis of your cluster's usage for that resource.
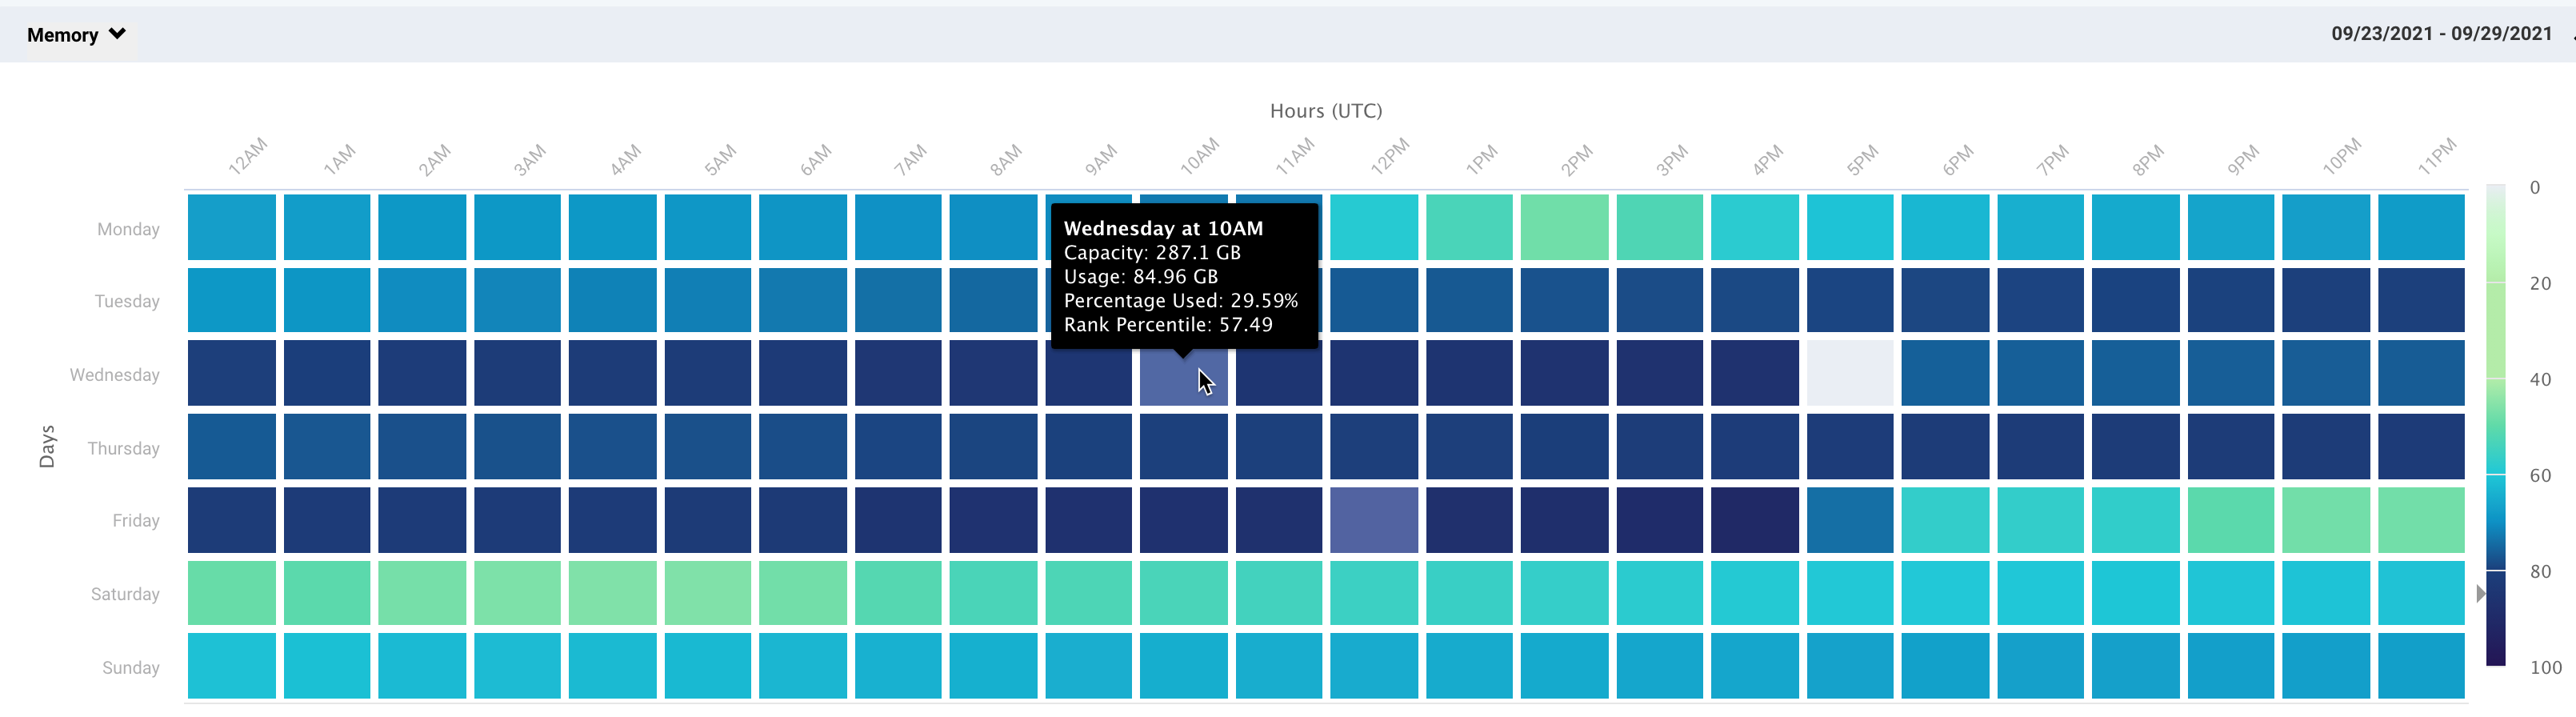
The heat-map is a map of the CPU/Memory usage and capacity by a weekday and hour, e.g., Monday between 5 and 6 a.m. Each time slot is color-coded to show how hot the time slot is compared with the rest of the time slots. On the heatmap, you can quickly view the load distribution across your cluster.
The heatmap can be filtered by CPU or memory. The Resource availability and usage graph noted the CPU is under-utilized and the heatmap graphically supports that analysis. Click  to expand and view the heat map.
Downloading the Cluster Discovery report in PDF or JSON format
On the Migration > Cluster Discovery page, click
 on the right.
 Select a format PDF or JSON. The file is downloaded and can be saved to your local machine.