Workload Fit
Report generation takes approximately 50 seconds for a slice with approximately one million apps. The number of apps depends on the slice's parameters and the selected period.
This analyzes your cluster workload based on your selected criteria. It enables you to map your workload (or a portion of it) onto a cloud service or. product and see the costs associated with migrating the slice.
First, select a time range from the Date picker.
Then, examine your cluster by
Job Count
Memory Hours
CPU Hours
Then you select a slice by
Users
App Types
Queues
Tags
For instance, you can evaluate your workload grouped by Job Count and generate the migration costs on a slice selected by Application Type, Users, Queues, or Tags.
You can download the Workload Fit report in a PDF or JSON format.
Configuring the Workload fit report
To enable and configure the Workload Fit report, you must set the configuration for Migration reports and also set the Workload fit report properties as follows:
Set the configuration for Migration reports.
Set the optional Workload Fit report properties as follows:
Stop Unravel.
<Unravel installation directory>/unravel/manager stop
Set the properties in the table as shown.
<Installation directory>/manager config properties set
<KEY><VALUES>##For example: <Unravel installation directory>/manager config properties set unravel.server.protocol httpsApply the changes.
<Unravel installation directory>/unravel/manager config apply
Start Unravel
<Unravel installation directory>/unravel/manager start
Generating the Workload Fit report
Run the following steps to generate the Workload Fit report:
Step 0: Select the period for the report.
From the date picker on the right, select a time range for the report. Unravel recommends using at least seven days of metrics to generate a meaningful report.
Step 1: Select a slice of the clusters' applications.
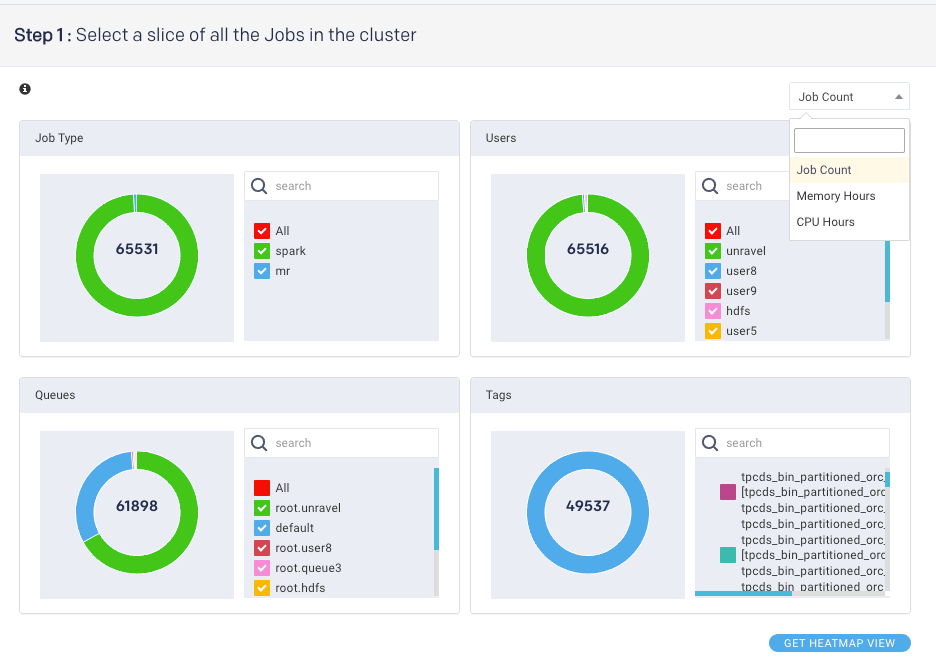
From the drop-down, select one of the following metrics to analyze your cluster's overall usage:
Job Count
Memory Hours
.CPU Hours
Select the criteria to use for analyzing the migration costs. You can select all or a subset of Application Type, User, Queue, or Tags. All available options for each type are listed.
Note
It is these selections that determine the slice of your cluster that is analyzed.
Hover over a chart section to see the name and absolute number for that section.
Tags
Tip
Tags comprise a (tag key:tag value); a tag key can have multiple values. The following images display the tag key
Project, which has fivevalues.If you are unfamiliar with tagging, see What is tagging.
The Tags chart behaves differently than the other charts. Hovering over a donut slice notes the number of apps with a specific tag key regardless of whether you have deselected a specific tag value. Hovering over the
Projectsection shows 24 apps tagged with aProject:value. Note the valueAdvertisingis deselected. If allProject:valuesare deselected,Projectis not included in the donut.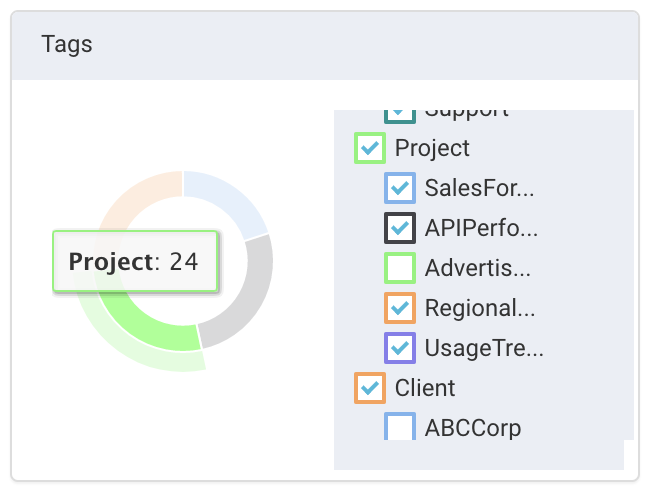
Click on the
Projectsection to bring up the distribution of the tag values.Advertisingis deselected, yet it is shown in the donut. Click Back to Tags to return to the tag key view.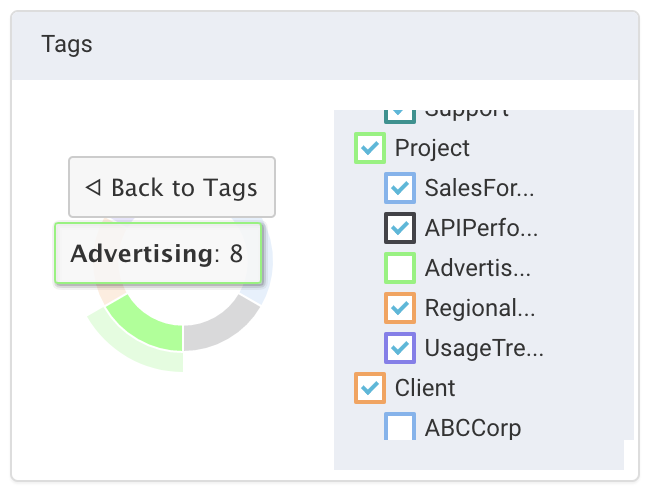
Important
Regardless of how the tags are displayed, the migration cost analysis only uses the selected values.
Example workload slices
All Tez applications.
Select Tez under Application Type.
Select All for User, Queues, or Tags.
All Spark applications on the
root.users.root queuefor all tag values forProject.Select Spark for Application Type.
Select the
root.users.root queuefor Queues.Deselect all tag keys except
Projectunder Tags.Select All for Users.
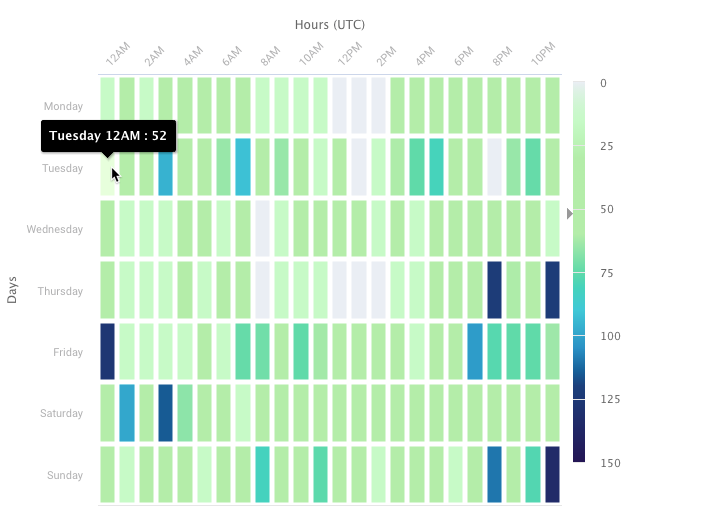
Heatmap
Click Heatmap View to view the heatmap graph, which is a 24x7 graph. This graph can be grouped and viewed for:
Job Count: This shows the total number of jobs that were running in a specific time slot.
Memory: This shows the memory consumption by the jobs running in a specific time slot.
vCores: This shows the core consumption by the jobs running in a specific time slot.
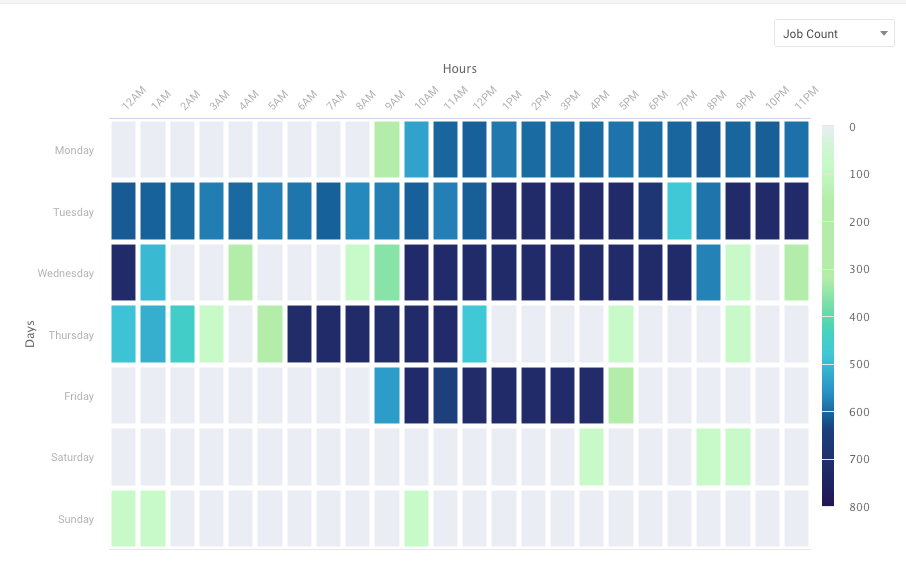
You can check the workload based on job count, memory, and vCores for an hour on a weekday and determine the best slot to run your jobs. The scale on the right shows the colors that are displayed with the ascending order of the workload.
Note
The heatmap is NOT automatically updated when you change the slice. After selecting the slices, always click Heatmap View again to update the Heatmap view.
In the following example, 52 jobs were running on Tuesday between 12 AM to 1 AM.
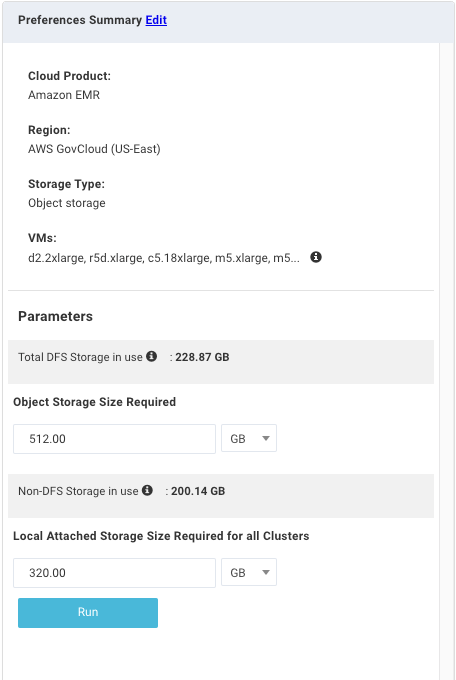
Step 2: Obtain cloud topology for the selection
You first must select your VM preferences for the cost analysis.
To edit the VM preferences:
Click the Add link. The VM preferences dialog box is displayed.
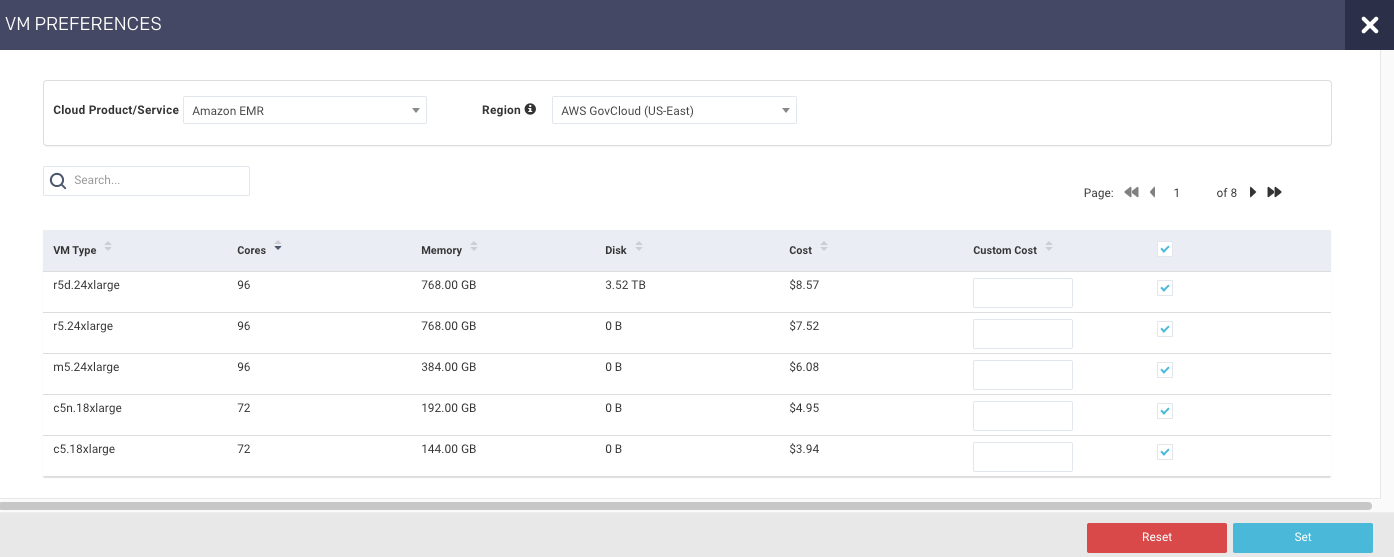
Select the following:
Cloud Product/Service
Google Compute Engine (IaaS)
Google DataProc
Amazon EC2 (Iaas)
Amazon EMR
Azure (Iaas)
Azure HDInsight
Region: Select a region. The available regions are specific to the Cloud Product/Service selected.
One or more VM types: The list is populated based upon the Cloud Product/Service and Region you chose.
To select a subset of VM types, check the box for each VM Type. To select all types, check the box in the header. Unravel maps each host to the best fit of the VM types you selected. Click Reset to clear your selections.
Tip
Refer to configuration for Migration reports to set the VMs that must be listed for selection.
(Optional) Enter a custom cost for a VM type for Unravel to use for the cost calculation for that VM type. Unravel uses publicly listed prices.
Click Run to generate the report.
The report generation's progress is shown at the top of the page, and you are notified about the successful creation of the report.
All reports (successful or failed attempts) are in the Reports Archive.
Viewing the Workload Fit report
In the report window, the left tile lists your VM settings. The Storage Type is always Object Storage. At least two and at most three tabs/reports are generated; Map to Multiple Clusters is not necessarily created.
Map to Single Cluster: Maps your workload slice to the best cluster from your selected VMs.
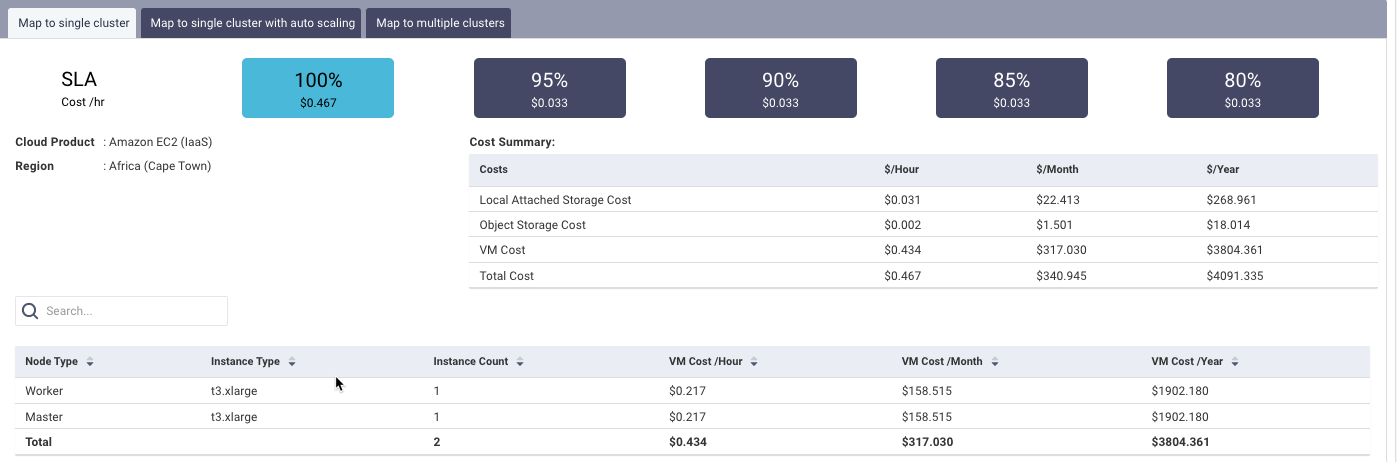
Cost Summary lists the total hourly, monthly, and yearly cost of the VM, Object Storage Cost, and the Local Attached Storage Cost.
In the table, the instance type for each of your Node Type is shown along with the count of each VM instance and their corresponding hourly, monthly, and yearly cost.
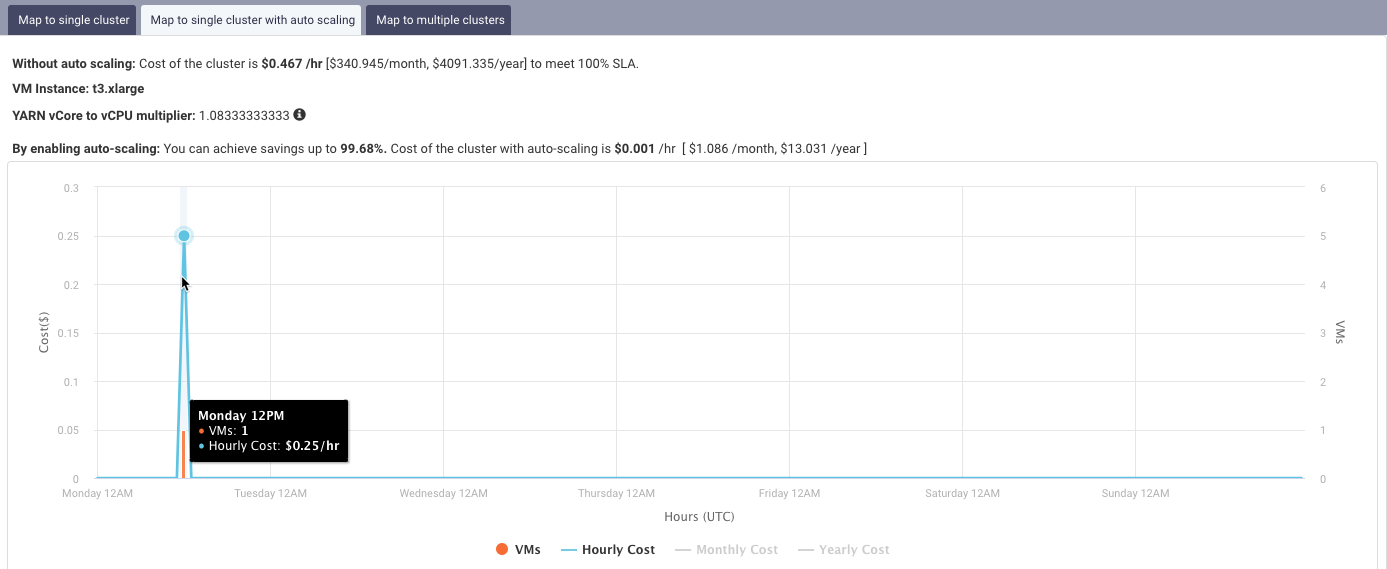
Map to Single Cluster with Auto Scaling: Compares the cost of migration if you use auto-scaling with a single cluster. The same VM user in Map to Single Cluster is used for the analysis. The chart graphs the number of VMs and their hourly, monthly, and yearly cost.
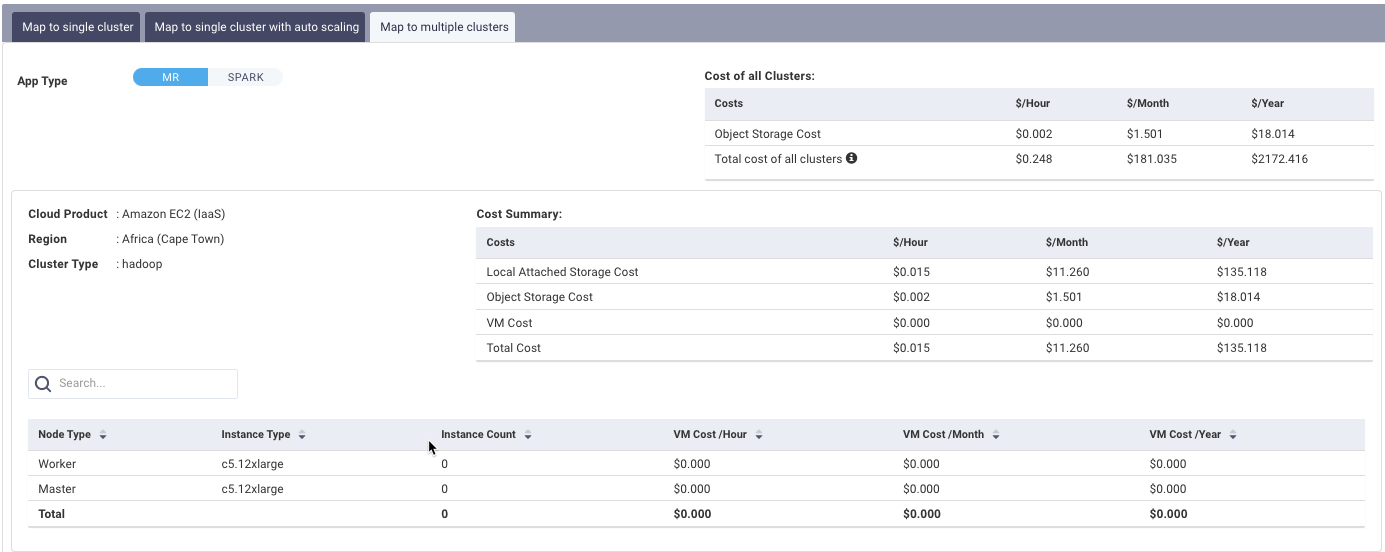
Map to Multiple Clusters: Unravel maps your clusters to multiple VMs. If you have selected multiple App Type, there is a Cluster Topology Details section for each type. Click the App Type to see the type's details. The aggregated VM and storage types for all apps are listed above the table on the right side.
Downloading the Workload Fit report in PDF or JSON format
On the Migration > Workload Fit page, click
 on the right.
 Select a format PDF or JSON. The file is downloaded and can be saved to your local machine.