Forecasting
Note
This report currently works only on Cloudera Distribution of Apache Hadoop (CDH) and Cloudera Data Platform (CDP).
The Forecasting report helps you with capacity planning for your hardware (CPU, Memory) and HDFS by analyzing your historical usage to predict usage trends. This can help you to plan and allocate your disk resources effectively. Each time you create a report, Unravel stores the new data allowing you to generate reports based upon a larger pool of data for more accurate forecasting. By default, the last forecasting report is displayed.
All reports, whether scheduled or ad hoc, are archived. Successful reports can be viewed or downloaded from the Report Archives tab.
Important
Ensure to install GNU Compiler Collection (GCC) version 4.9.3, which consists of compilers and libraries for C, C++, etc., on the Unravel node for the Capacity Forecasting report to function properly.
In case of a multi-cluster deployment, install GCC on the Unravel core node.
Also, refer to pre-requisites.
Configuring the Forecasting report
Notice
When you configure the Forecasting report on a CDH or CDP cluster, ensure that you have one of the following roles
Full Administrator
Cluster Administrator
Operator
Configurator
These roles are required only in the case of Cloudera manager.
Stop Unravel.
<Unravel installation directory>/unravel/manager stop
Only for the multi-cluster environment: Run the following command to find the
<EDGE_KEY>, which you must provide in the command when you configure the Forecasting report.<Unravel installation directory>/unravel/manager config edge show
Only for the multi-cluster environment: Select the cluster where the Forecasting report must be enabled. Specify each
<EDGE_KEY>in the multi-cluster.<Unravel installation directory>/unravel/manager config ondemand select-cluster
<EDGE_KEY>##Example: /opt/unravel/manager config ondemand select-cluster local-nodeIf there are multiple hdfs entities configured on the cluster, you must set the com.unraveldata.capacityforecasting.hdfs.entitynames property as follows:
<Unravel installation directory>/unravel/manager config properties set com.unraveldata.capacityforecasting.hdfs.entitynames <hdfs_entity_name>

##Example:/opt/unravel/manager config properties set com.unraveldata.capacityforecasting.hdfs.entitynames hdfsdevns1
Apply the changes.
<Unravel installation directory>/unravel/manager config apply
Start Unravel
<Unravel installation directory>/unravel/manager start
Generating Forecasting report
Click the
 button to generate a new report. The parameters are:
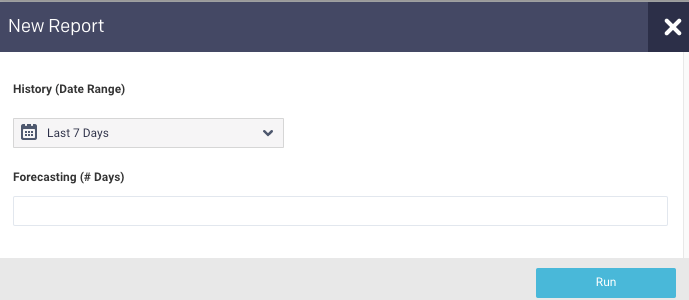
History (Date Range): Use the date picker drop-down to specify the date range to analyze the past trend for the forecasting report.
Forecasting Specify the number of days for forecasting.
Click Run to generate the report.
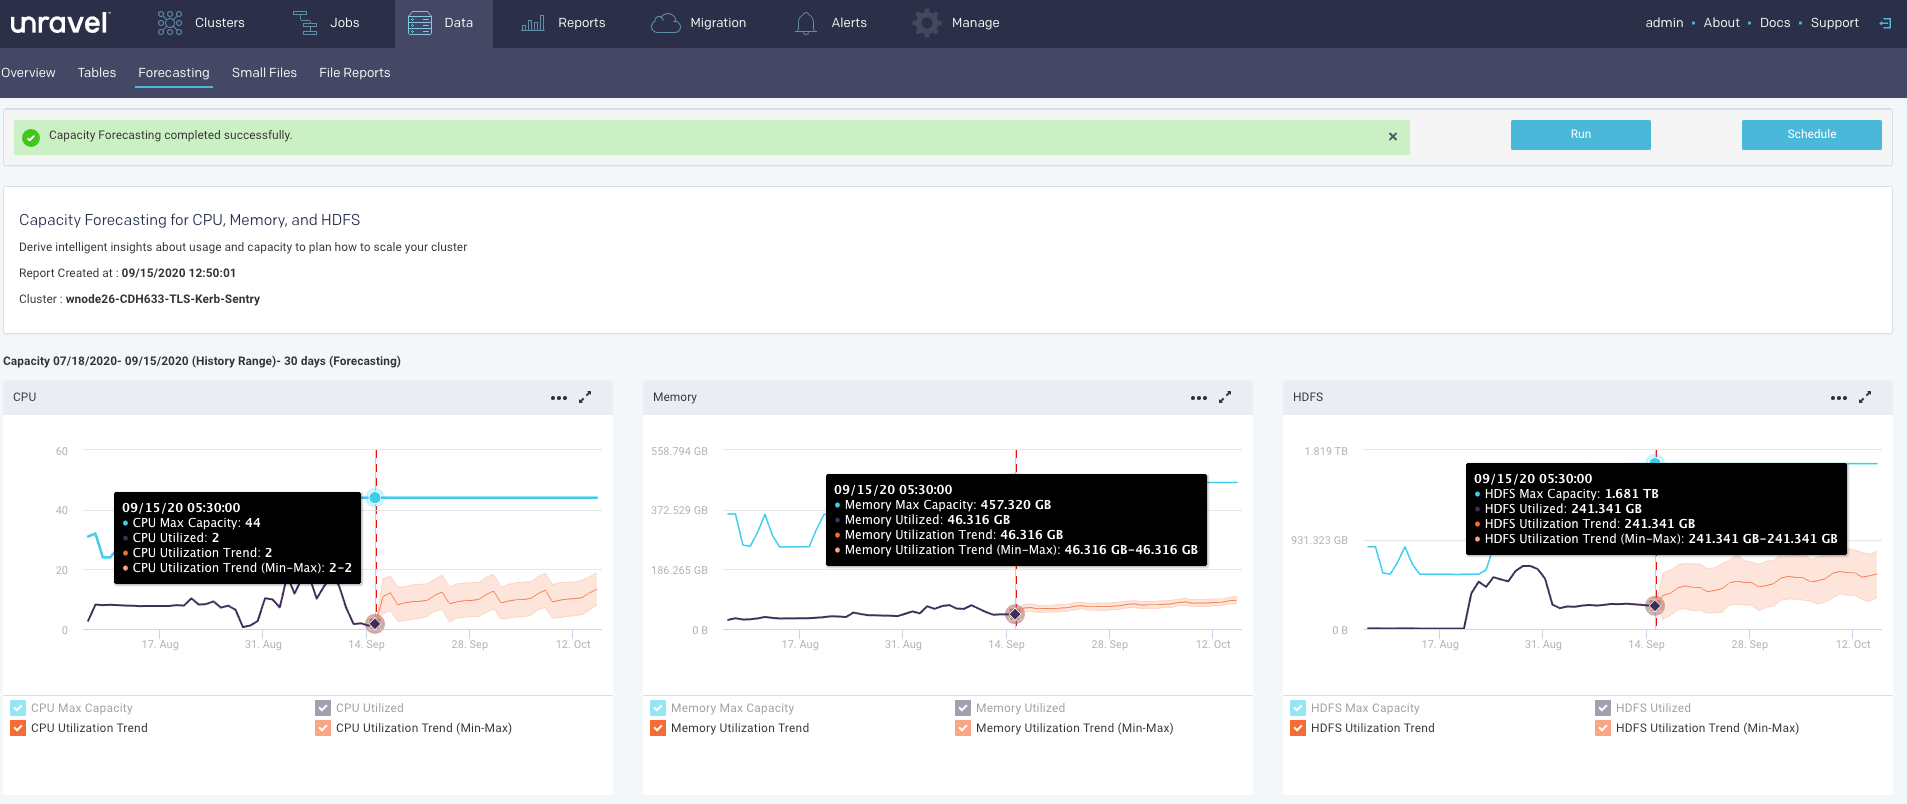
The progress of the report generation is shown on the top of the page.
A light green bar appears when the report was successful and results are displayed. Upon failure, the bar is light red and the New Report button turns orange.
These graphs display the trend (orange line) from the historical range start-date to the forecast range end-date (x-axis). The trend shows the upper and lower bounds for predicted values. Refer to the trend lines. The y-axis is determined by your actual physical CPU, memory, and disk capacity. Click
 to download the graph in a JSON or CSV format. Click
  to expand all the graphs to full width.
The following capacity forecasting reports are generated:
CPU

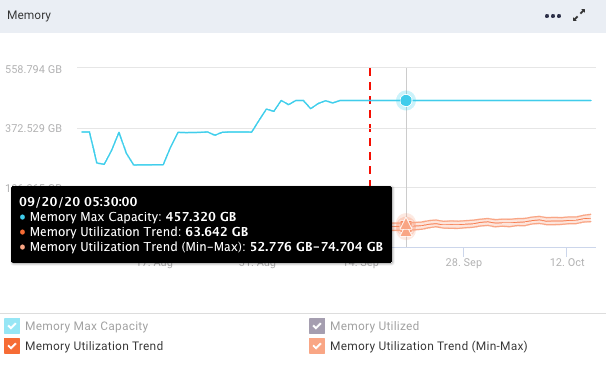
Memory
HDFS
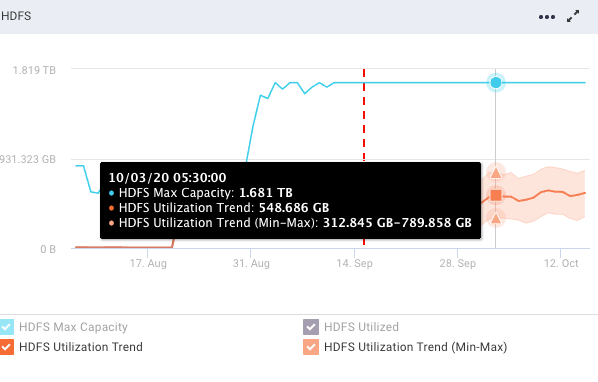
Refer the following table for the trend lines:
Trendline
Description
Vertical dotted line
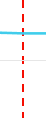
The vertical dotted line separates the regions of the historical usage/capacity and the predicted usage/capacity.
Blue line

The blue line shows the total capacity. The total capacity is extrapolated from the last observed capacity.
Black line
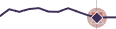
The black line shows the historical usage.
Orange line
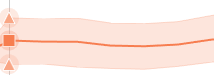
The orange line shows the historical usage trends and the predicted usages with lower and upper bounds.
Scheduling Capacity Forecasting report
Click
 to generate the report regularly and provide the following details:
History (Date Range): Use the date picker drop-down to specify the date range to analyze the past utilization trend for the forecasting report.
Forecasting Specify the number of days for forecasting.
Schedule Name: Name of the schedule.
Schedule to Run: Select any of the following schedule options from the drop-down and set the time from the hours and minutes drop-down:
Daily
Selected a day in the week.(Sun, Mon, Tue, Wed, Thu, Fri, Sat)
Every two weeks
Every month
Notification: Provide email IDs to receive the notification of the reports generated.
Click Schedule