- Home
- Unravel 4.7.8.x Documentation
- User Guide
- Cost (EMR)
- Cost chargeback (EMR)
Cost chargeback (EMR)
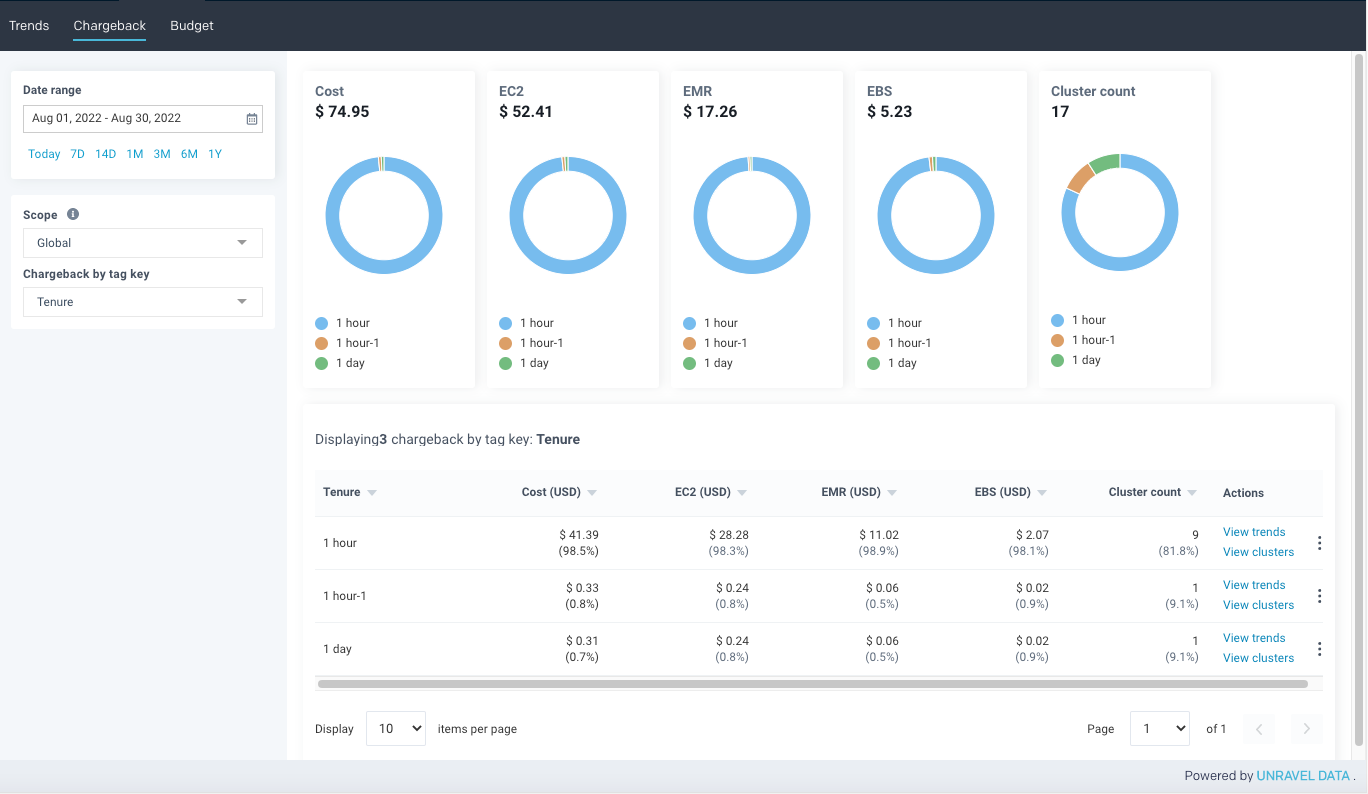
From the Cost > Chargeback page, you can view the cost chargeback of EMR for the following metrics: total cost, EBS cost, EC2 cost, EMR cost, and cluster count for a selected date range (the start and end time). The clusters are filtered between this date range. The chargeback chart data displays data based on the scope.

If you click the View chargeback link from the Trends page, the scope is imported to apply chargeback.
On the Unravel UI, navigate to Cost > Chargeback.
On the Chargeback page, select a date range from the Date Range field to view the chargeback pie charts. The selection starts from the current day. You can select any of the preset date ranges or a custom date range, which can be between 1 day (minimum) and 1 year (maximum).
From the Scope list, select one of the following options to view the chargeback graphs:
Scope
Description
Global
(Default)
The Global scope is selected by default. When the Global scope is selected, all clusters detected by Unravel are included.
Tags
Select key=value pair tags—for example, Purpose: Fraud Detection, Tenure: 1 month, and Purpose: Image Processing. You can add a maximum of up to five key=value pair tags.
From the Chargeback by tag key list, select the tag key to view the chargeback.
The chargeback table and pie charts are displayed with a breakdown of costs or the cluster count based on tag values corresponding to the selected tag key.
Important
The individual costs broken down by a tag key do not add to the aggregated cost displayed in the chart. This issue occurs for untagged clusters.
In the chargeback table, the Cost columns are sorted by the highest to the lowest cost.
Note
If you do not select a tag key in the Chargeback by tag key list, the aggregated costs (cluster count) of clusters matching the filter criteria of scope and date range are returned.
In the Actions column, click the following links:
View trend : View trends for the selected chargeback. See Viewing the cost trends of EMR.
View clusters : View insights related to clusters. See Clusters (EMR).
Notice
Known Limitation
When you click the View Clusters link on the Cost-based pages and navigate to the Clusters page, the cluster numbers shown can vary. Sometimes fewer clusters are listed, and at times no clusters are shown. This is a known limitation due to differences in the definition of the time range selector for these pages.
Cost page
Shows all the clusters that have accrued cost in the selected period, which may be running or terminated in the selected period, irrespective of their start date.
Cluster page
Shows only those clusters that have started in the selected period.
Note
The View trend and View clusters links are disabled if five tags are available in scope.
From the More Actions menu (at the end of a row), click Create budget to create a budget using the scope.
The scope of the selected chargeback is imported into the new budget. For information, see Creating a budget.
Note
The Create budget option is disabled if the five tags are available in the scope.