How to view chargeback Databricks cost
On the Unravel UI, click Clusters tab > Chargeback.
Click the date picker on the right and select a period range to list your historic job runs. For this walkthrough, you can select the Last 90 days period range. The jobs run in the specified period range are displayed.
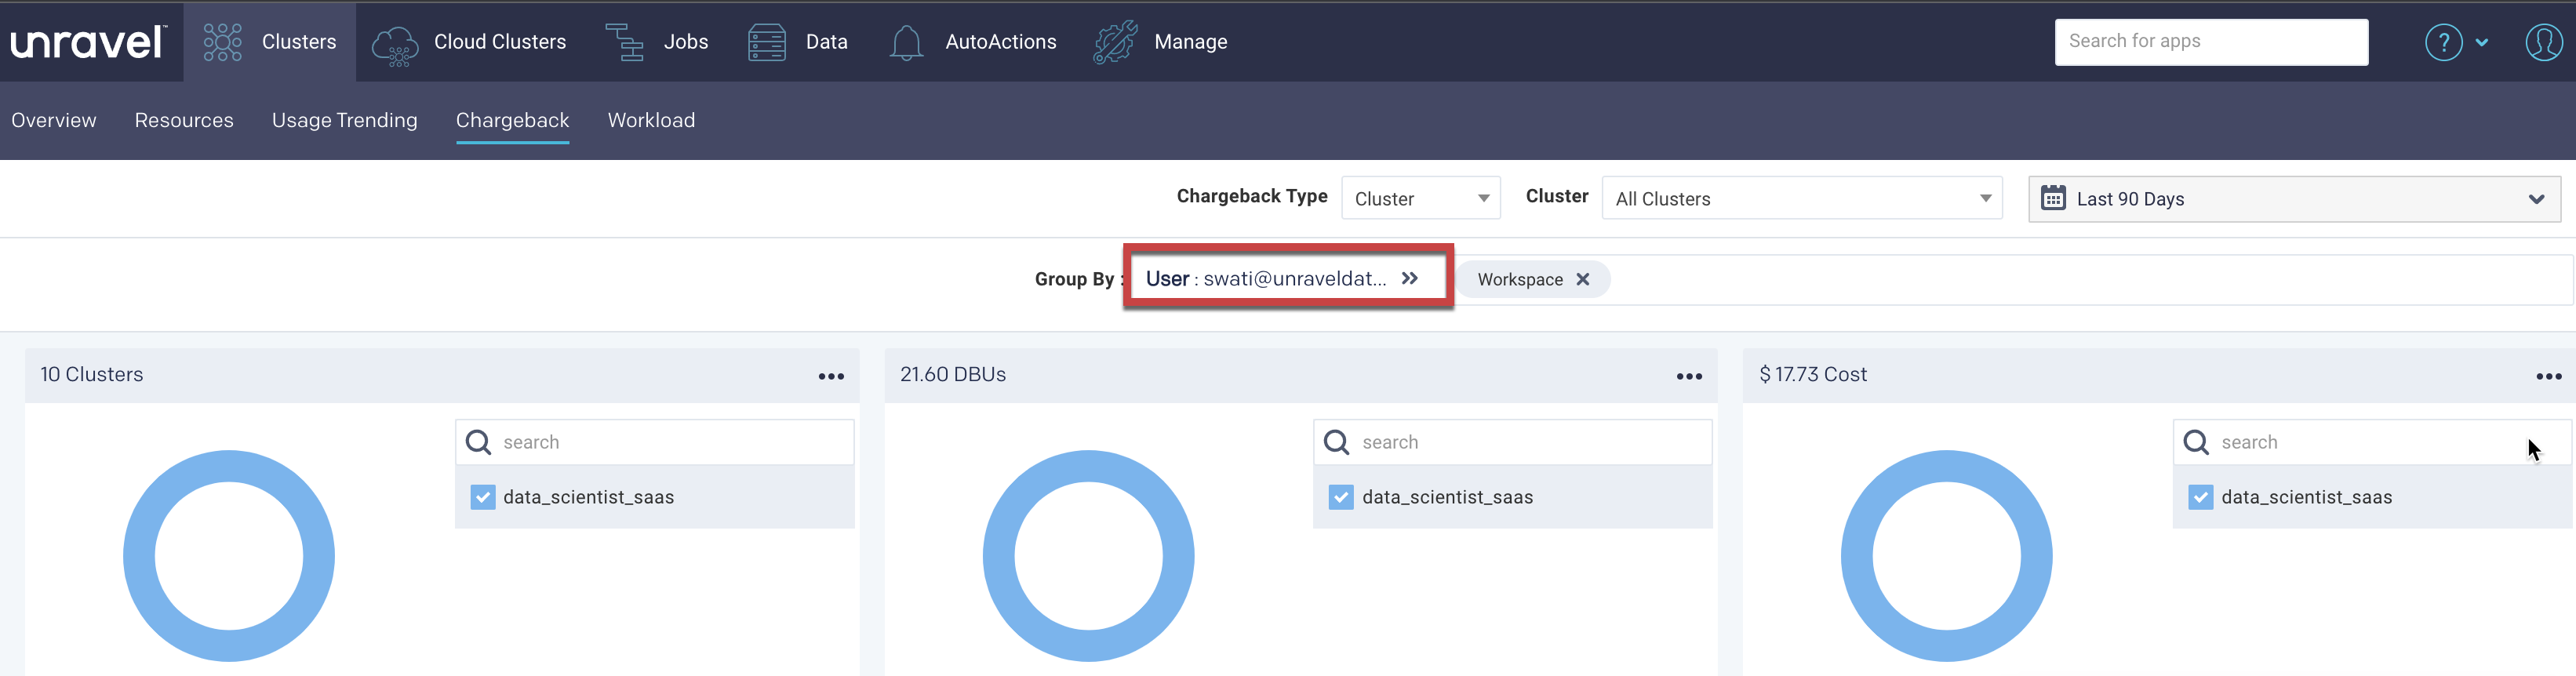
Click the Group By box to select a tag. The trends and chargeback details for the selected tag are displayed in donut charts and tables.
For example, if User is the tag selected in the Group By box, the Clusters, DBUs, Costs, and the Spark job details are displayed grouped by user.
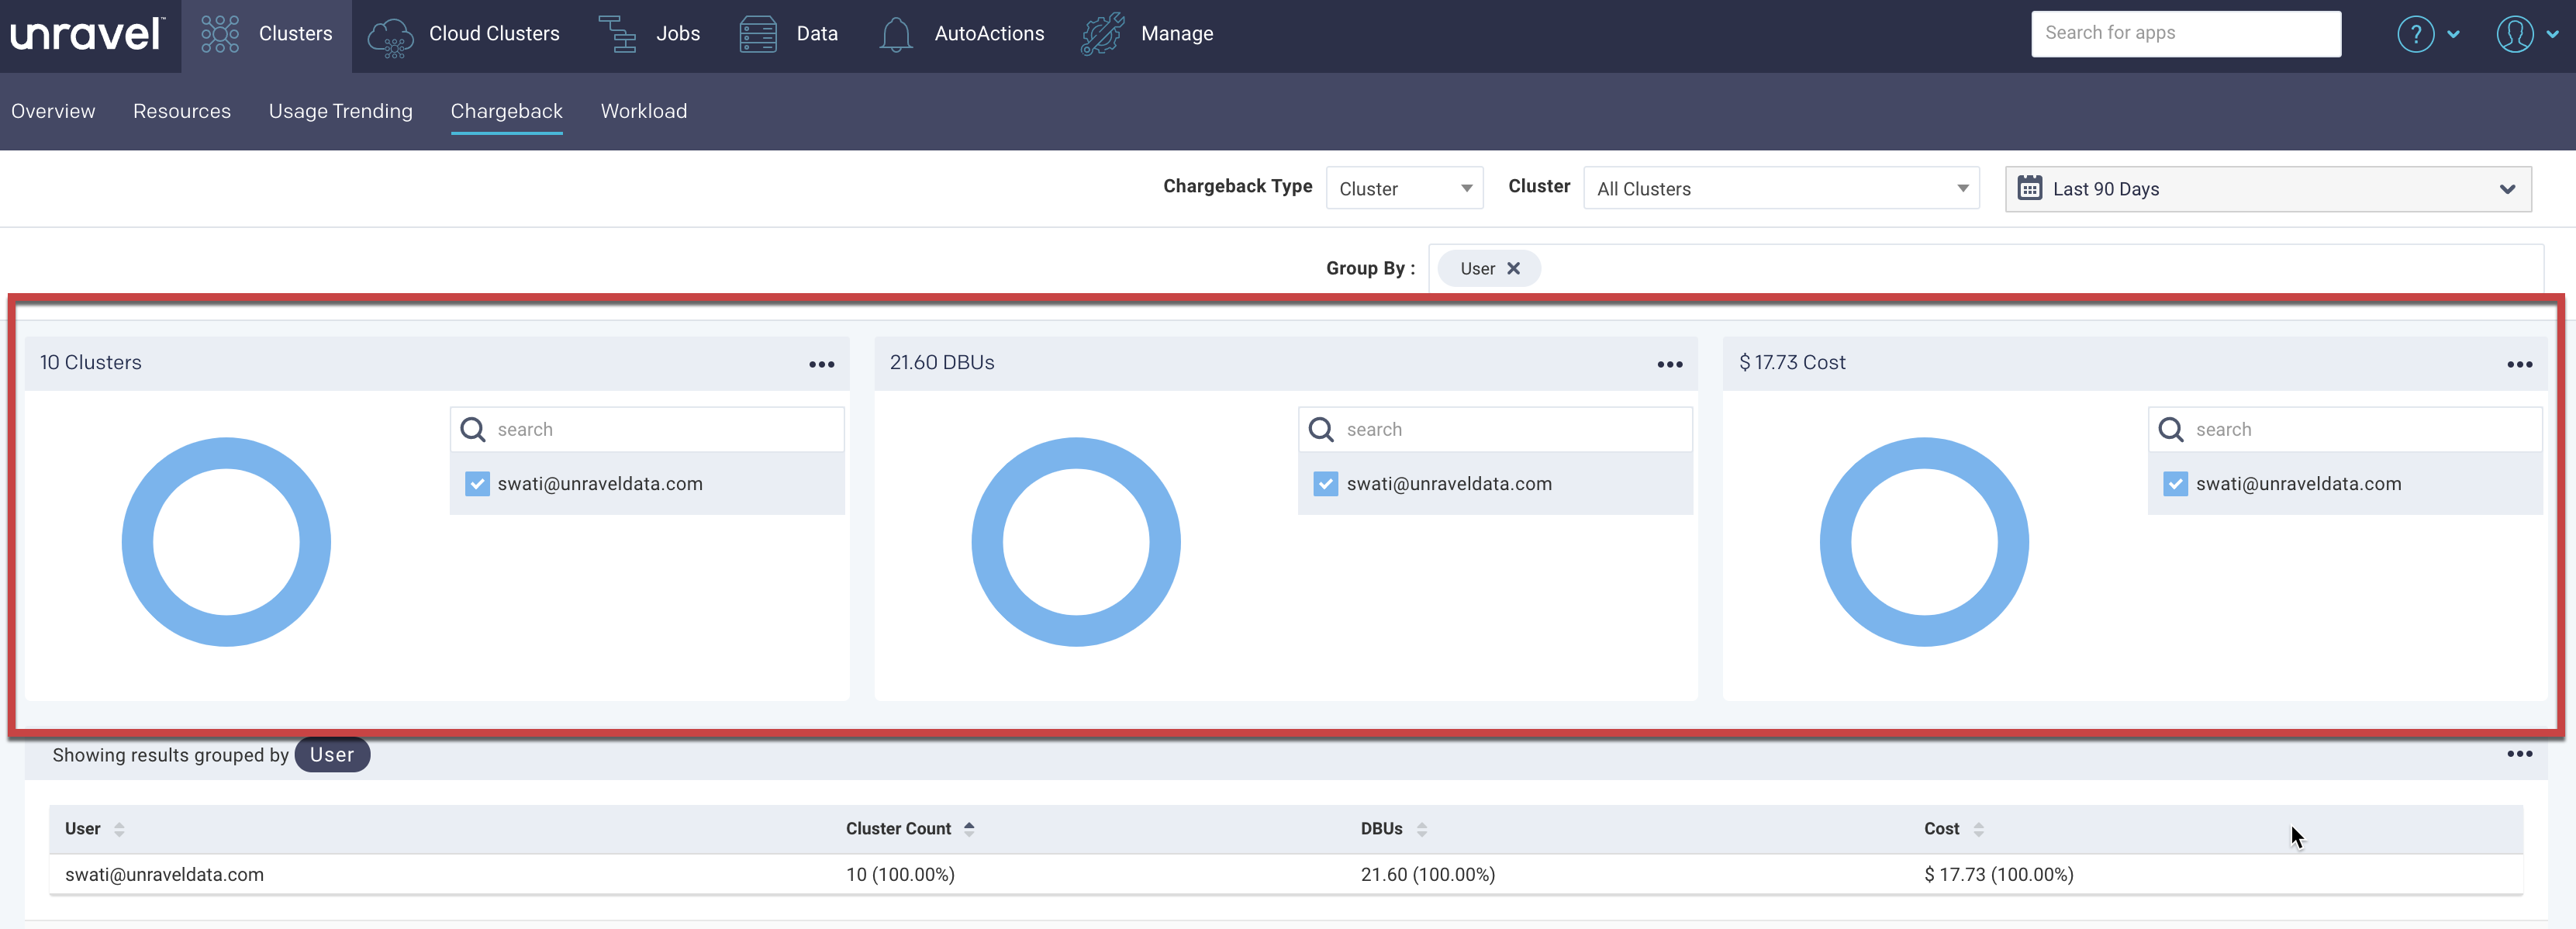
The chargeback reports clustered by the User are displayed below. You can select a user to filter further.
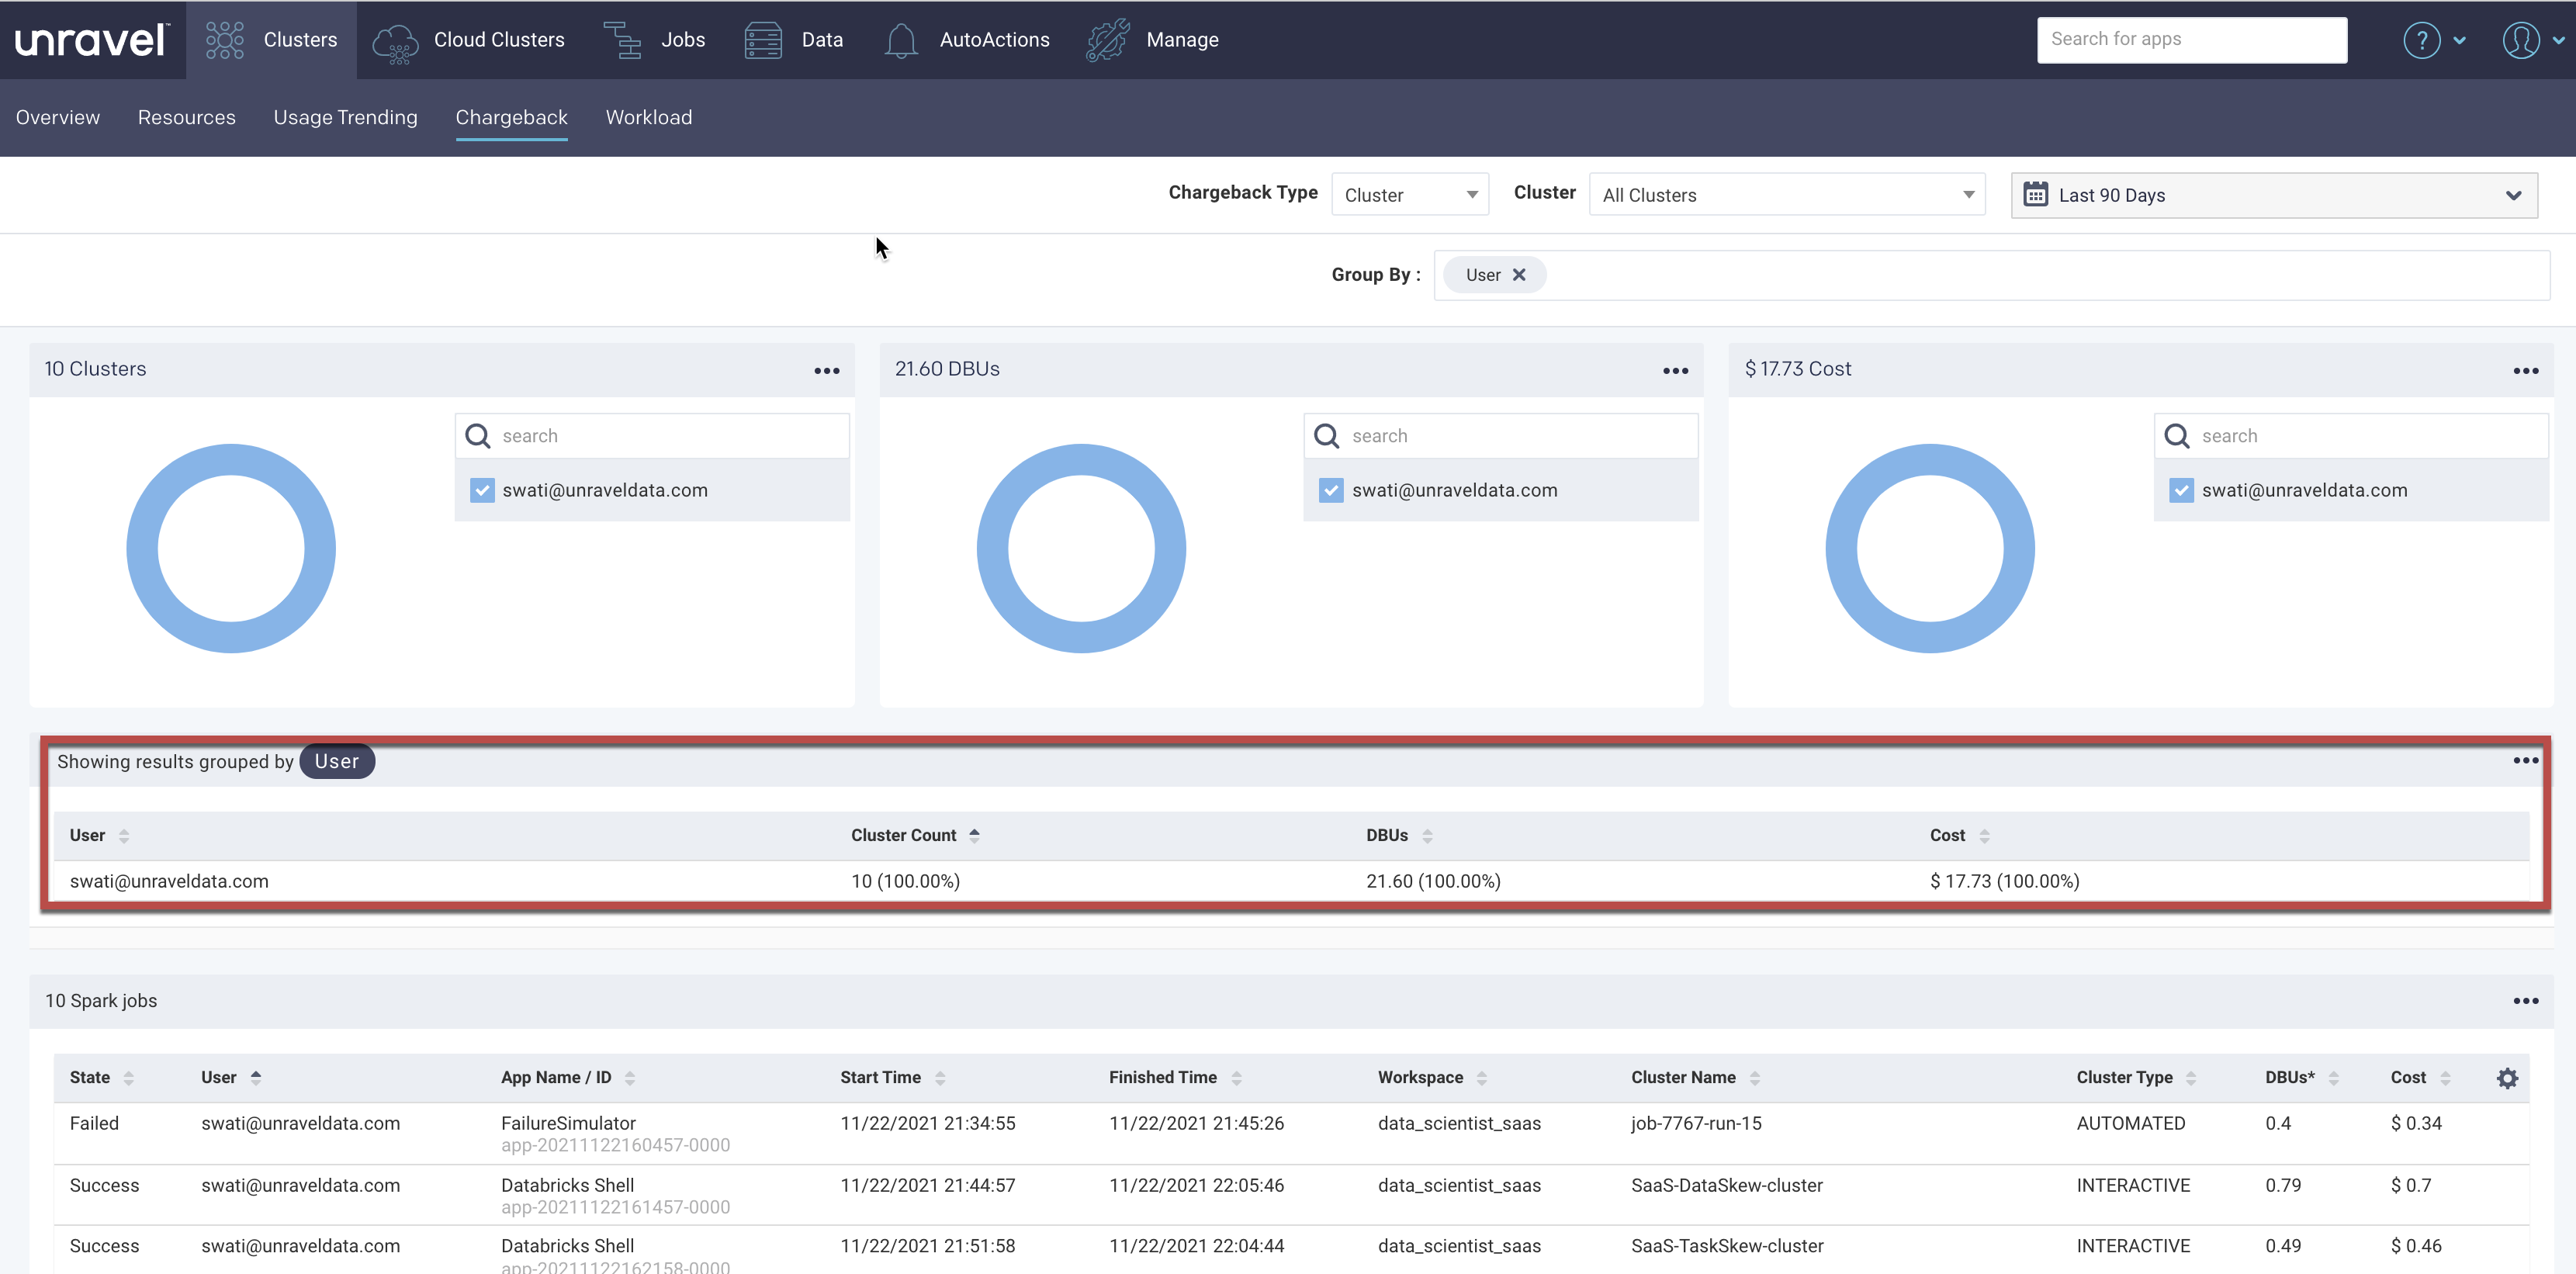
Details of this user's jobs across all workspaces and clusters, including costs, appear in the table below.
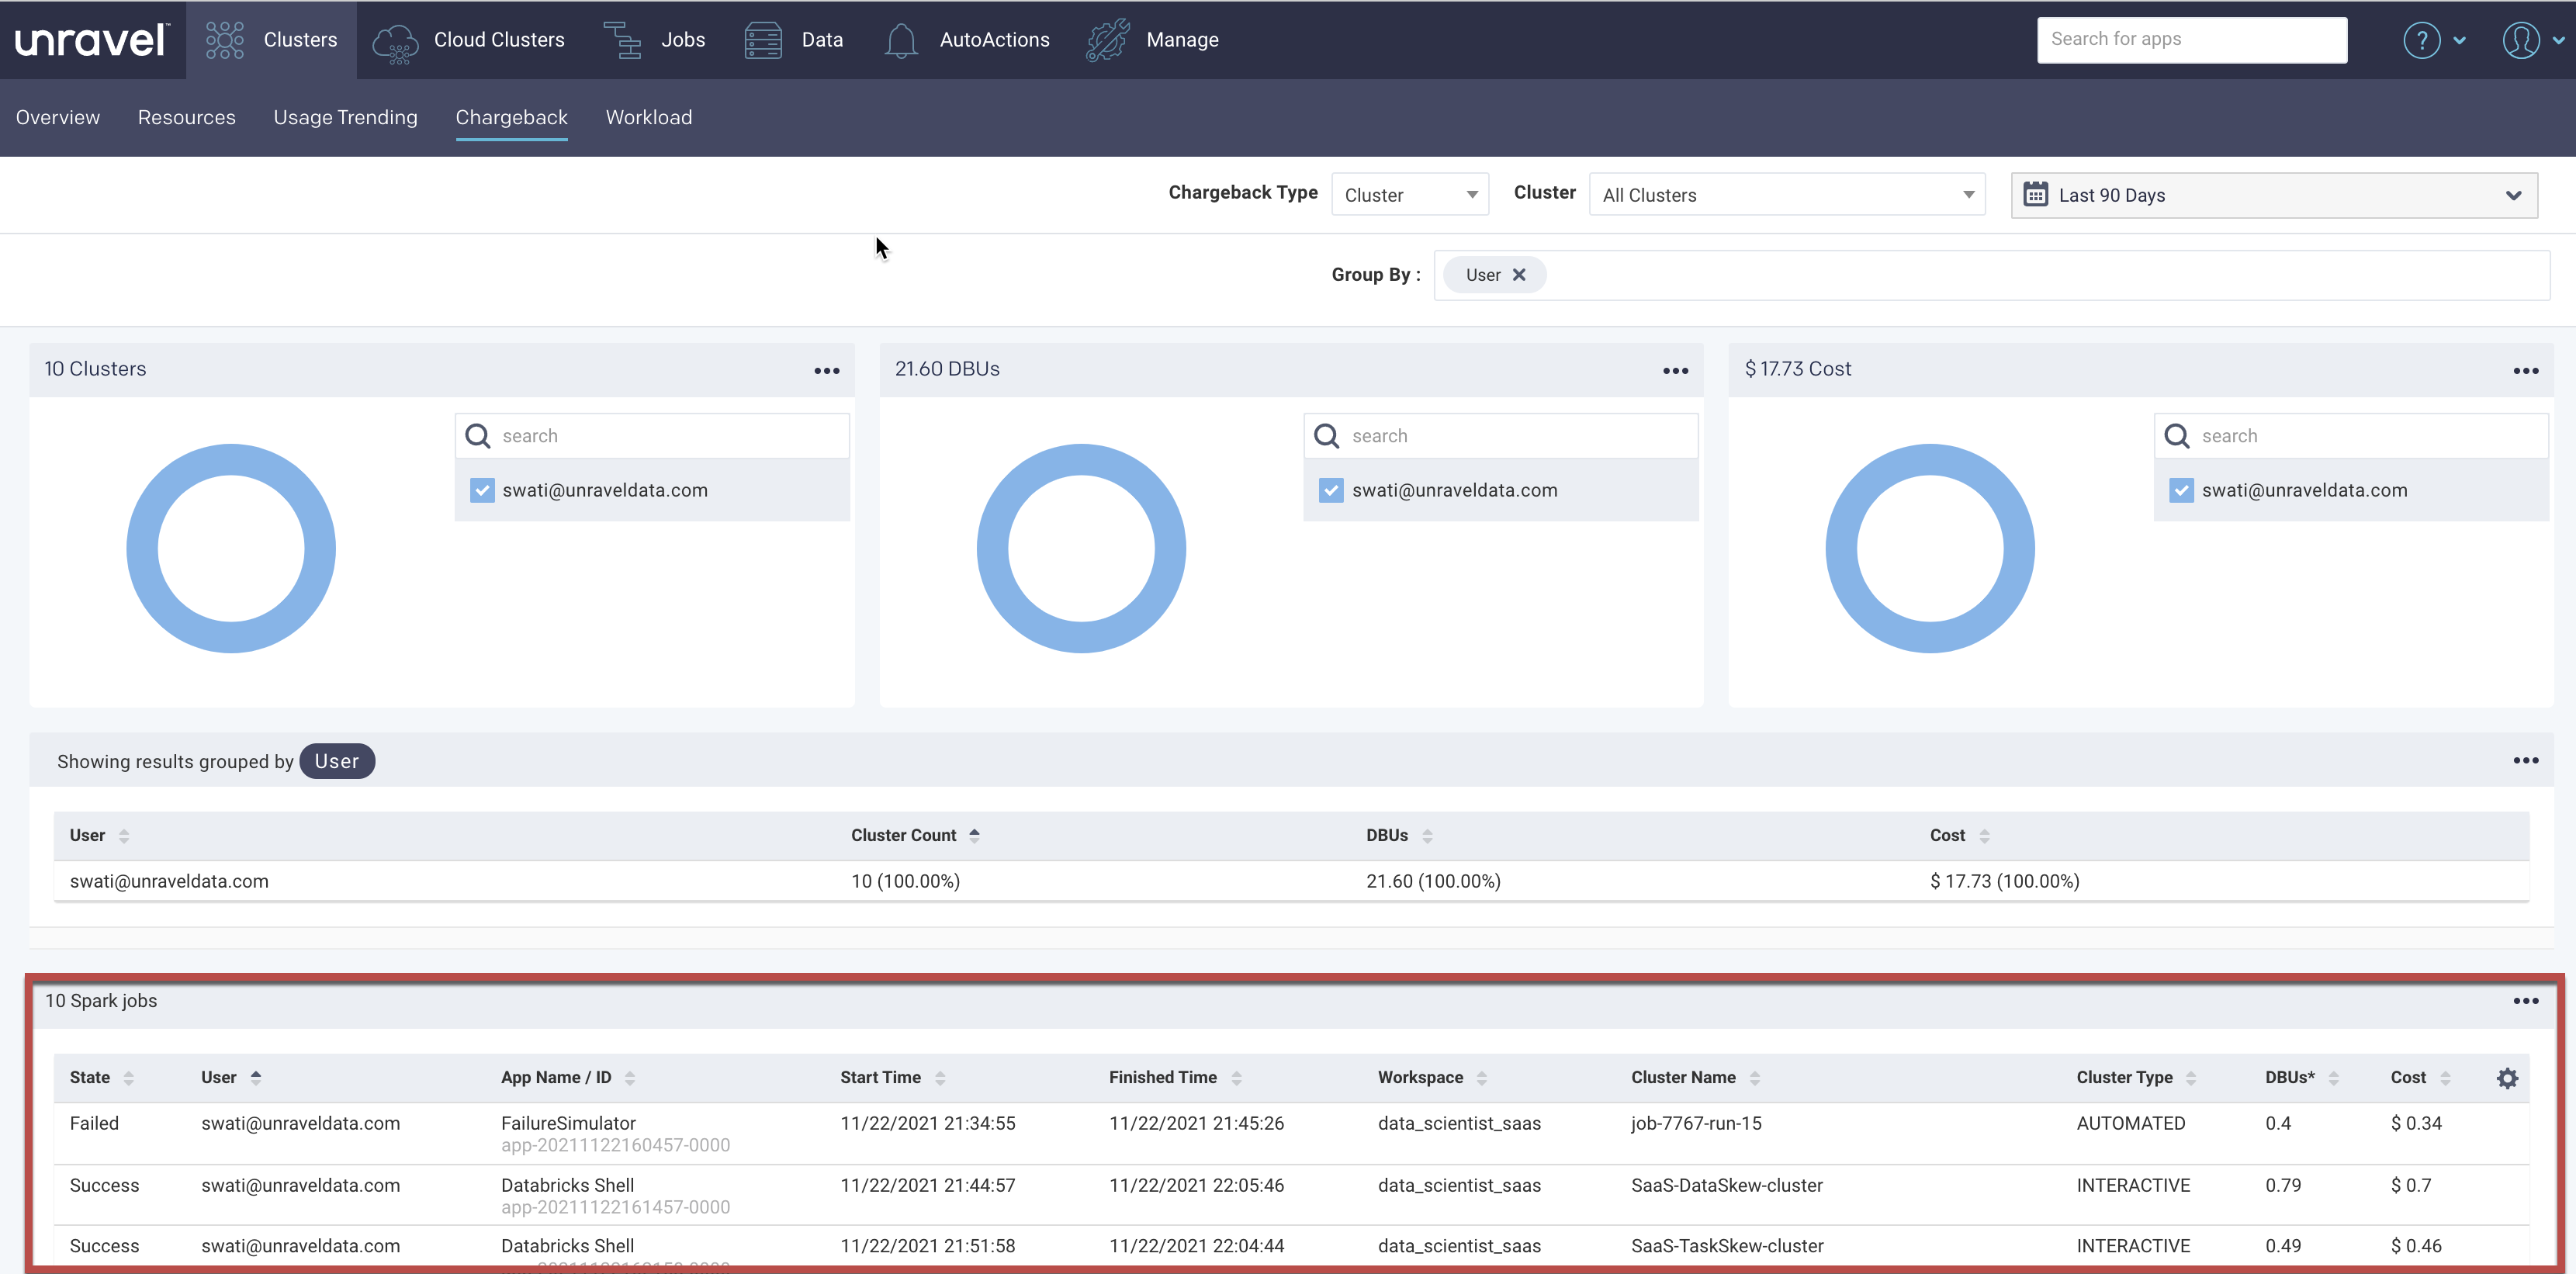
Click the Group by > User link to view all the Users again.