Applications tab (Databricks)
Note
Click here for common features used throughout Unravel's UI.
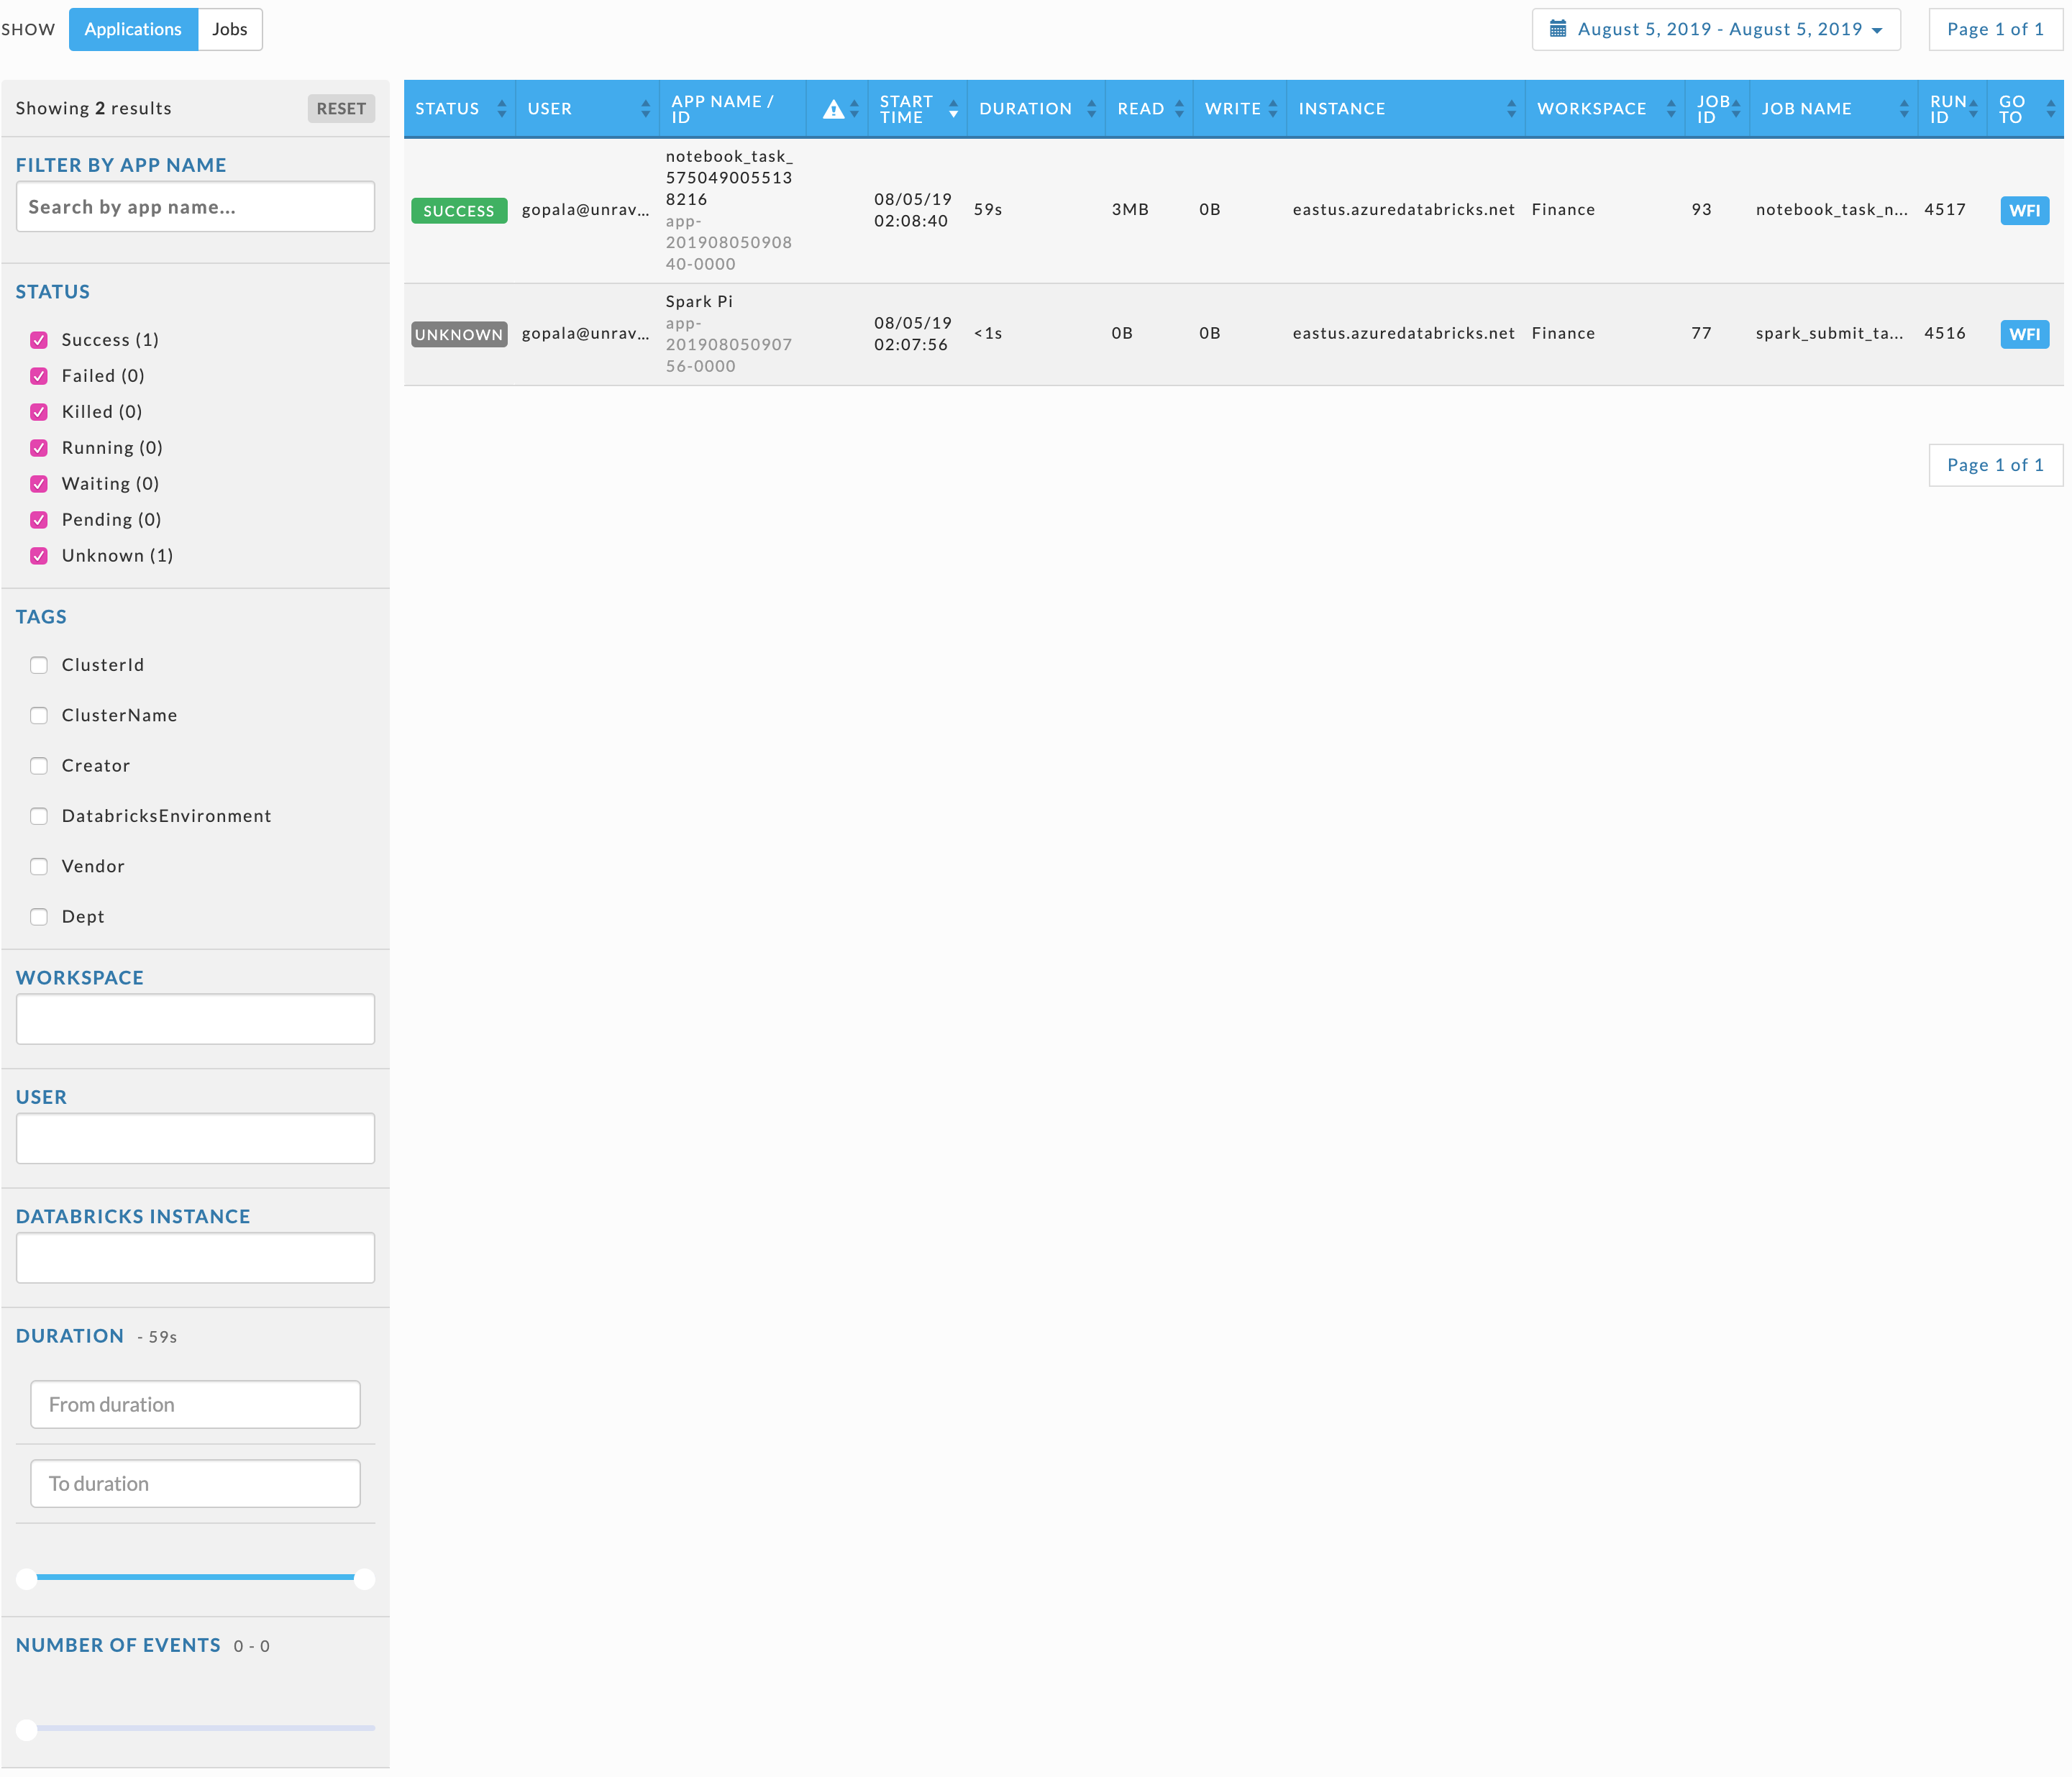
By default, this tab lists all applications for the day. The applications are sorted in descending order on START TIME. To order the results by another column, click on the sort arrows ( ) next to the column header. Click the top arrow to sort the column by ascending order and the bottom for descending order. The column the list is currently sorted on has the sort choice highlighted (
 ).
).
Because these apps are in the cloud there is no TYPE, CLUSTER ID, or QUEUE for the application.
The columns are:
STATUS: application status.
USER: name of the user who submitted the app.
APP NAME/ID
Notification Column (
 ) : a fine-tuning (
 ) indicates Unravel has tuning recommendation for the applications.
START TIME: start time, day and time.
DURATION: total time taken by the application.
READ: total data written by the application.
WRITE: total data read by the application.
INSTANCE: name of the Data brick Instance Id.
WORKSPACE: workspace name.
JOB ID
JOB NAME
RUN ID
GOTO: links to the application's workflow.
You can filter applications by:
Selecting a date and time range of the applications to display using the date picker above the table.
Using the pagination boxes, to the right above and below the table, to view the pages.
The left sidebar allows you to filter the applications by:
APP NAME
STATUS
TAGS: the following tags are always available. Click the check box next to the tag and then click in the text box for the valid values. You may select none to all the options available.
ClusterID
ClusterName
Creator
Databricks/Environment
When there are user specific tags these will also be listed.
WORKSPACE
USER
DATABRICKS INSTANCE
DURATION
NUMBER OF EVENTS: the range of events is shown, i.e., 0-4. You can select a range by using the slider to specify the upper and lower bounds.
Click anywhere within the application's row to bring it up in its APM.