Sessions tab (on-prem)
Note
Click here for common features used throughout Unravel's UI.
Note
This Report does not work with PostgreSQL. You must be using MySQL and have the OnDemand package installed.
Sessions allows you to run your application expressly to tune its performance for either:
Speedup: decrease the application's time (end-to-end duration) and resources (shortening the application's duration is first priority).
Reliability: in attempting to reduce resources Unravel prioritizes memory allocation to ensure the application doesn't fail due to "out of memory" exceptions.
Why use sessions when Unravel already offers insights and recommendations on an application's run?
You direct the tuning goal.
You can:
You can provide multiple runs of an application to provide a larger data pool for Unravel to analyze.
Have Unravel apply the recommendations for you and run the newly configured application.
See the effects, both positive and negative, the tuning has on an application's run.
Compare the various runs' configurations.
Repeatedly tune the application until Unravel has no more recommendations.
Your session is saved and can be run again, e.g., new runs added, cluster configuration changed.
You can tune:
Spark
Hive on MapReduce
Sessions can serve simply as a tool to compare two (2) runs of the same application.
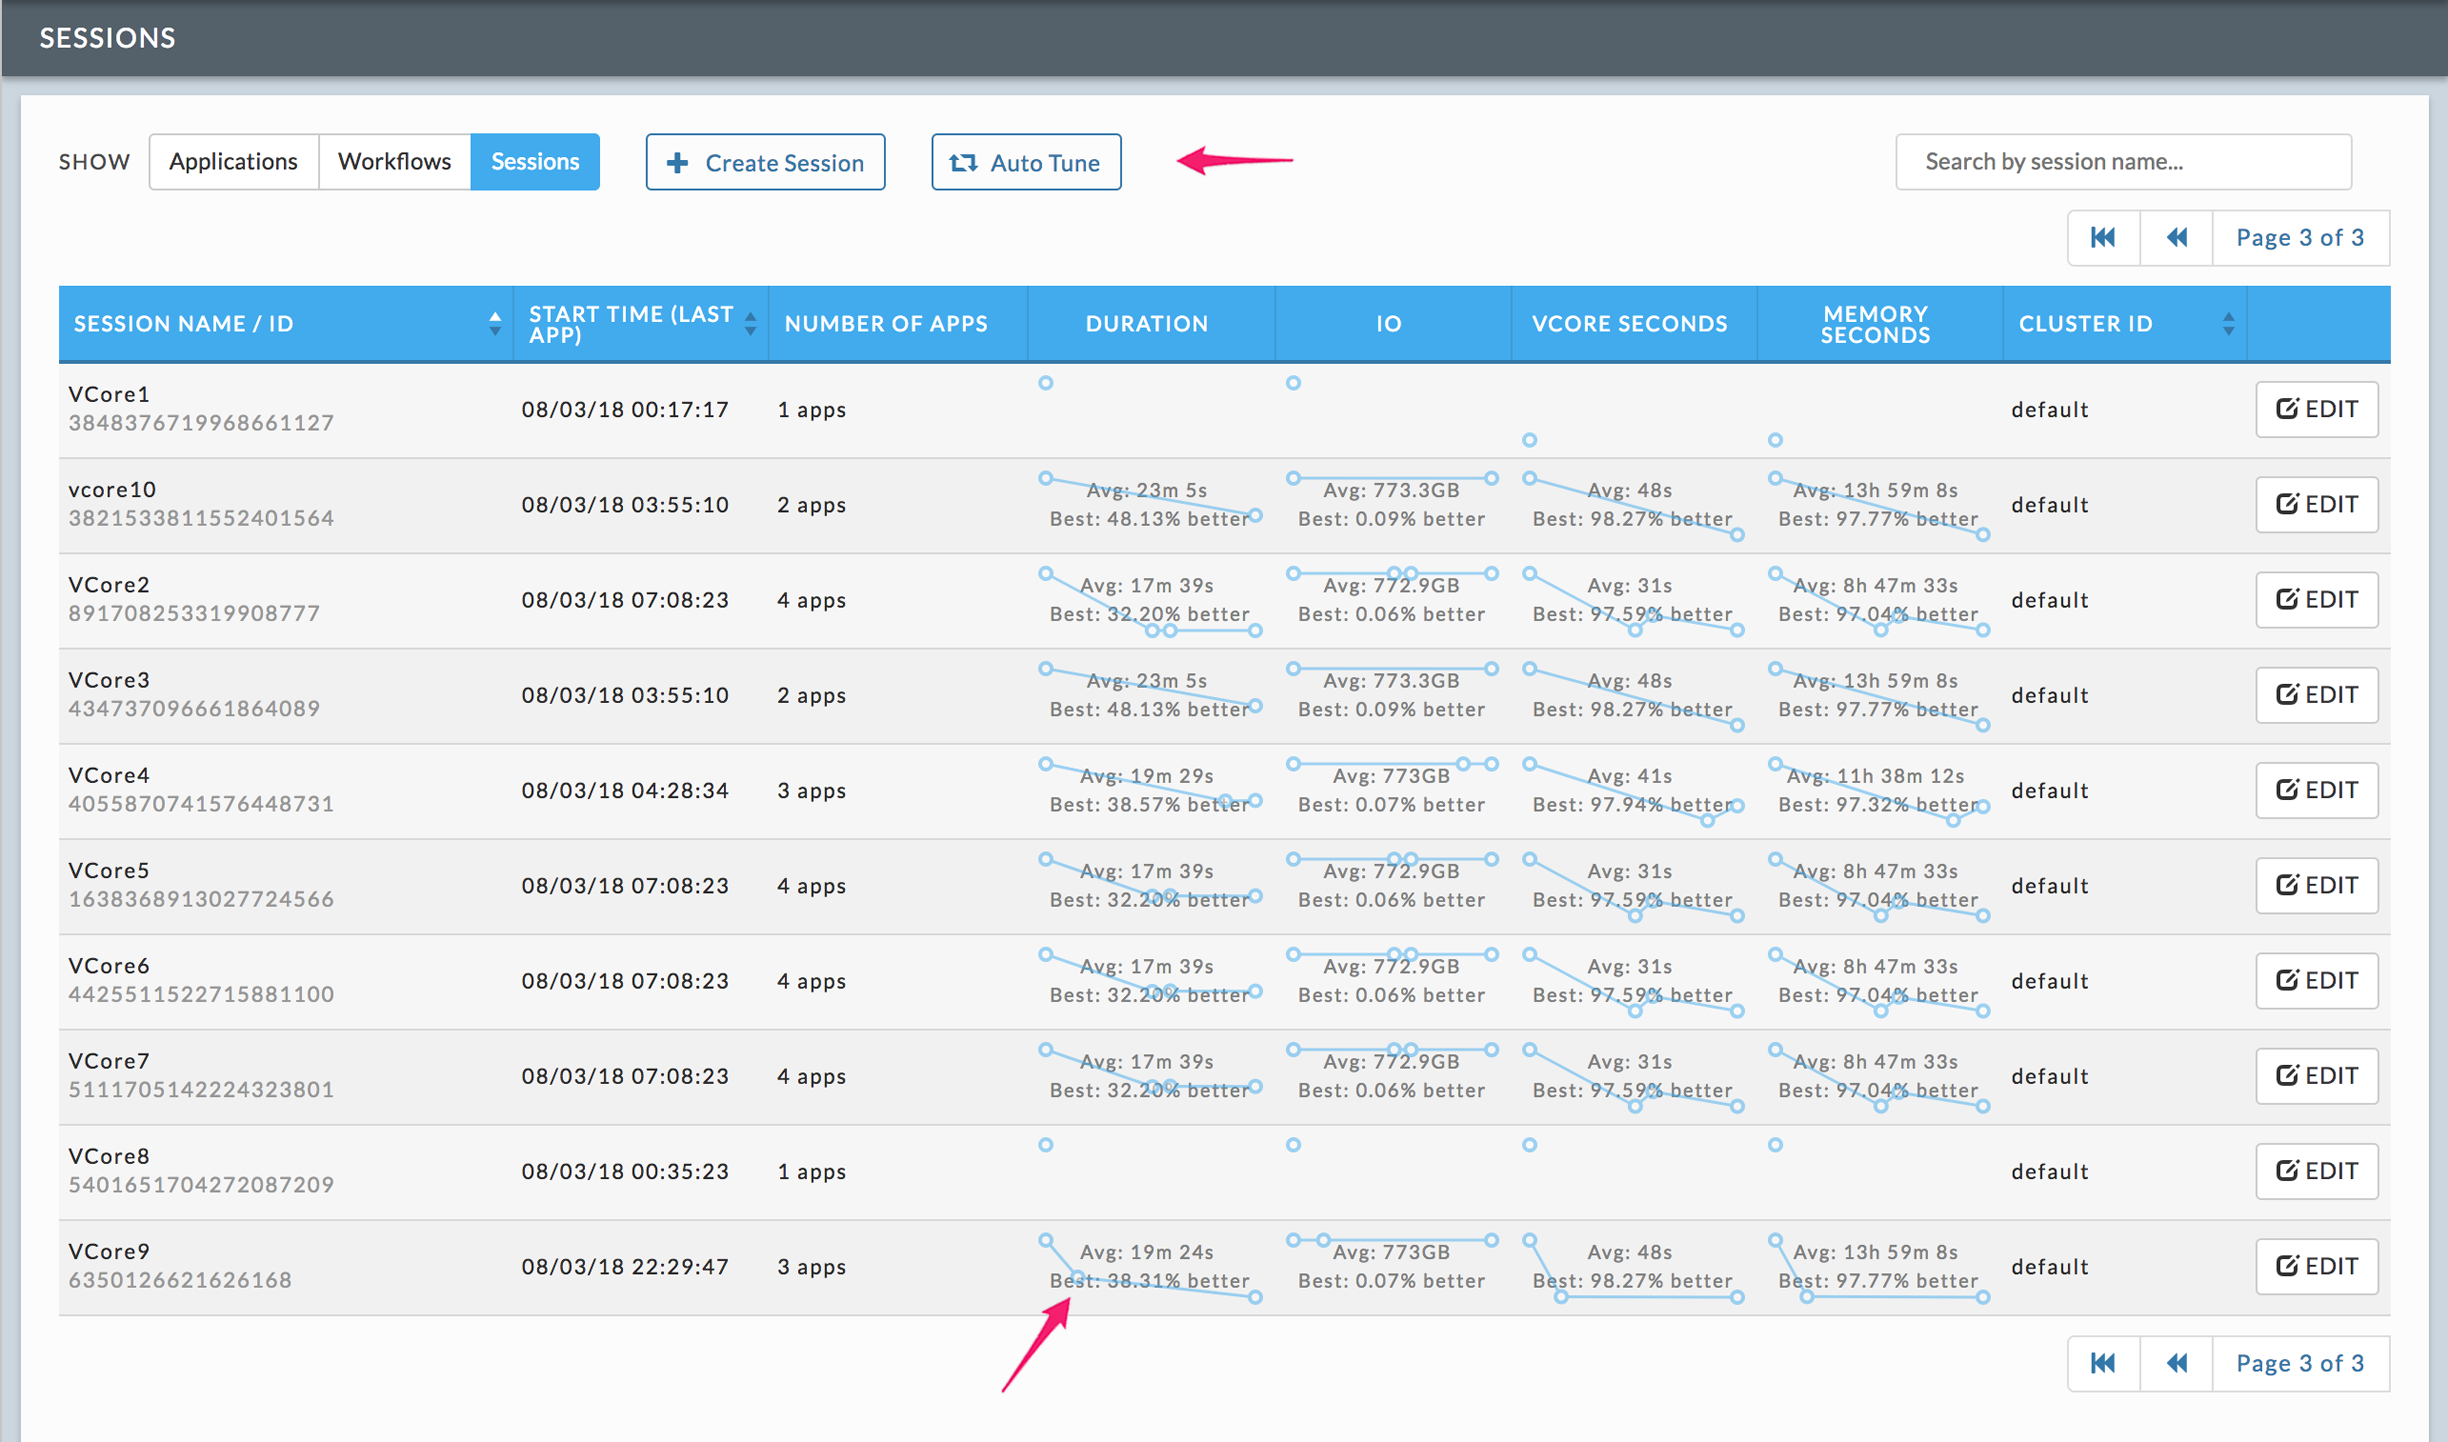
The Sessions tab opens displaying all current sessions sorted on Sessions Name in ascending order. The Start Time is the time of the most recent application run. Number of Apps is the number of runs inside the Session. Some of these runs were added when the Session was created and some were created by Sessions after it applied the recommendations.
The four (4) KPI's Duration, IO, vCore Seconds, and Memory Seconds are essentially what the fine-tuning hopes to minimize. The column contains a trend line which plots all the apps (vertices) contained in the Session. Beneath the trend line the average and the best value is noted. For example, VCore9, has 3 apps, for Duration the average is 19 m 24 s and the best time was 38.31% better than this. You can not draw the conclusion that the same app performed best for each KPI. Finally, the Cluster ID is listed. You can sort the table on Session Name, Start Time, and Cluster. Click on the edit button to edit the session.
You can search for a session by name. Enter the string in the search box; any session name matching or containing the string will be displayed.
Creating a session
You can use sessions
Manually - you actively control the analysis and application of recommendations, or
Automatically - sessions performs the iterations without your intervention until it reaches the maximum allowed runs or finds no more recommendations
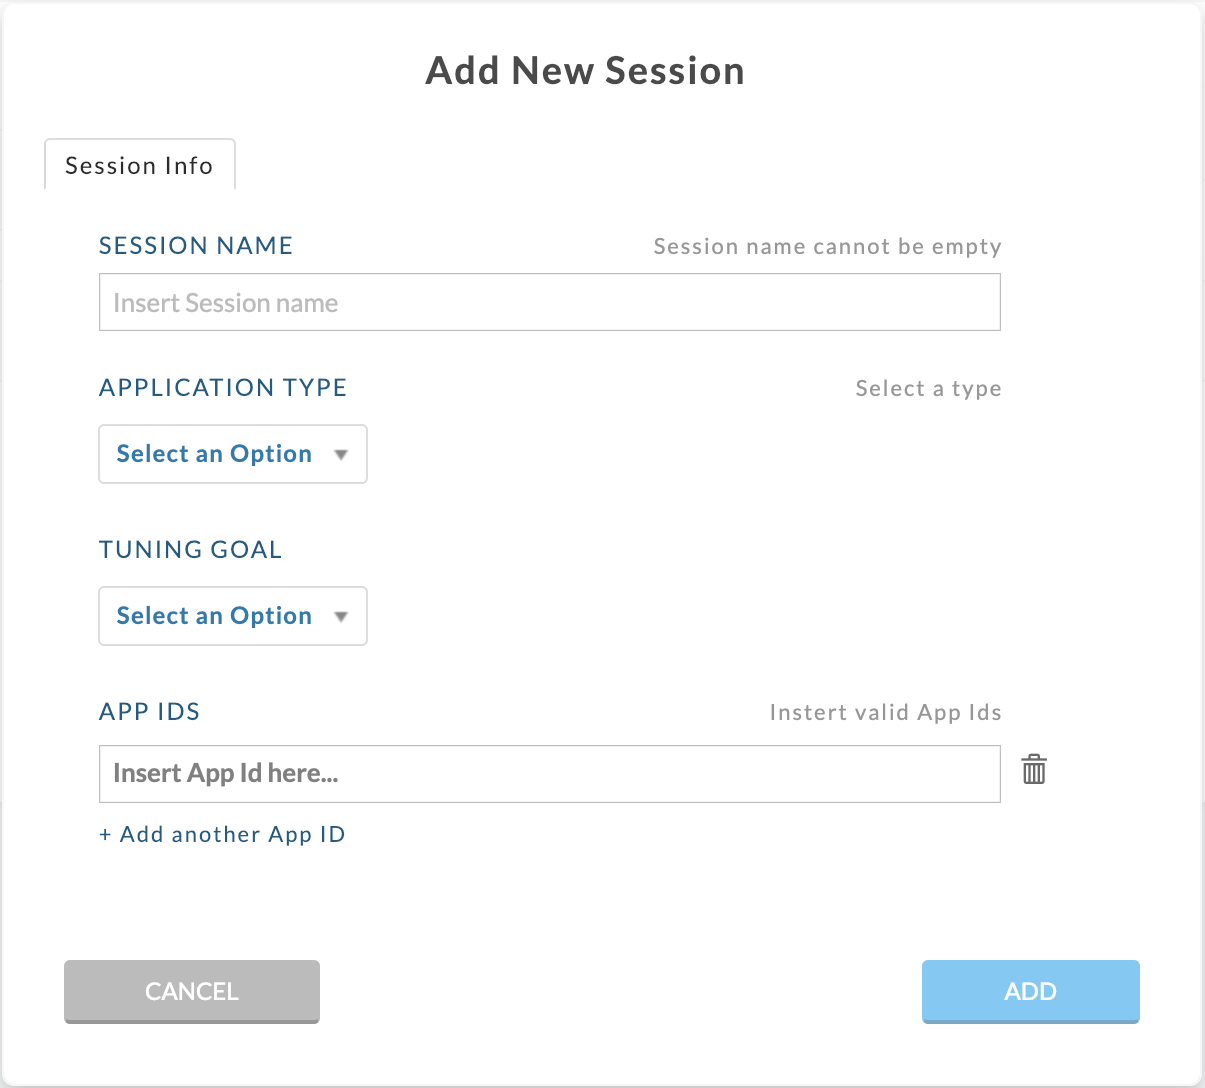
Click Create Session. You must name your session, it does not have to be unique, but we recommend you do so. Chose the Application Type and Tuning Goal from the pull-down menu and the tuning goal. Add the App IDs of the application(s) you want to tune. Click +Add another App ID to add more apps. Click  to delete an App ID. Click Add to create the session.
 |
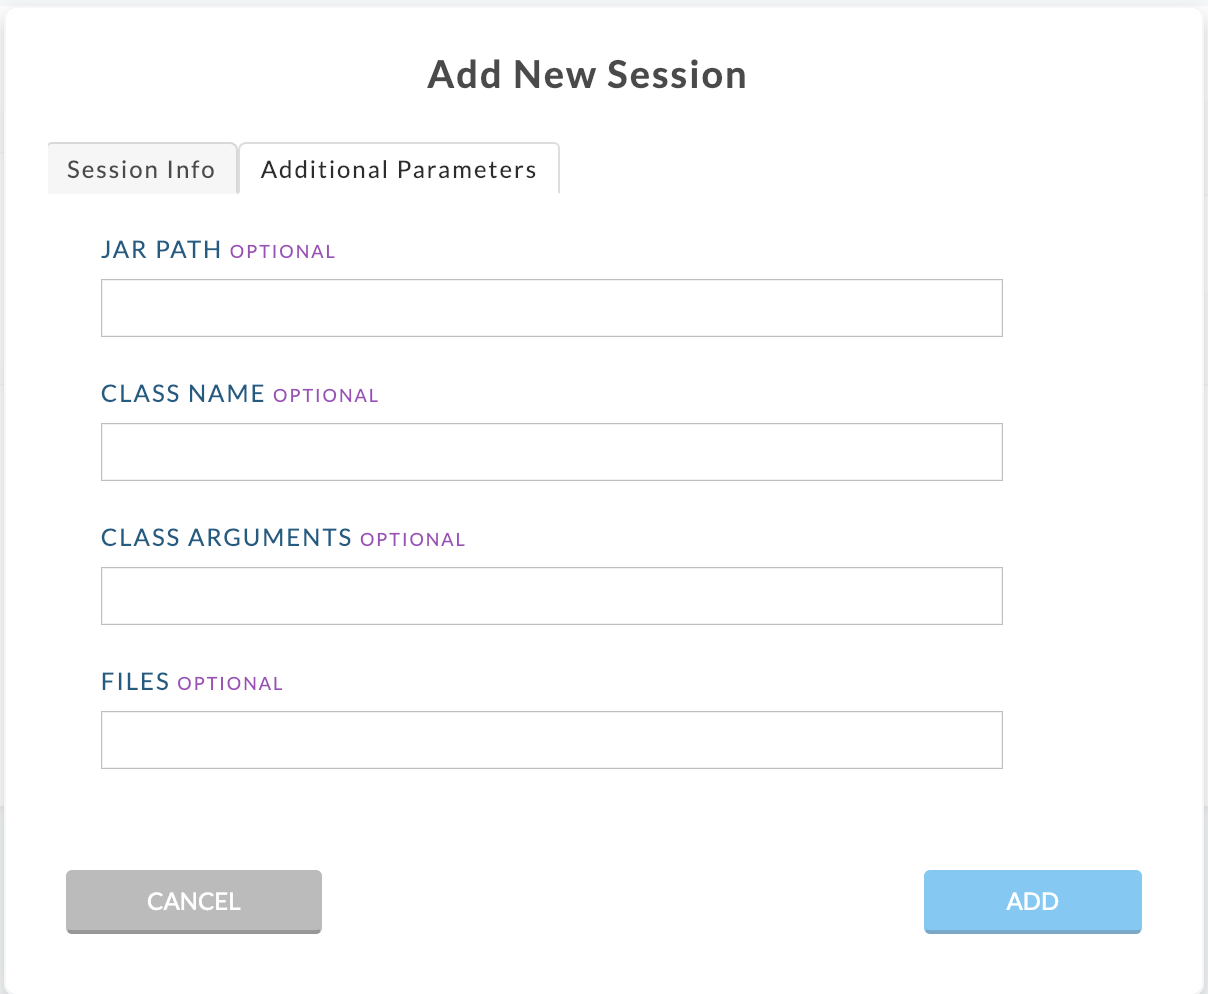
If you are tuning a Spark App you can optionally supply the JAR path, Class Name, Class Arguments, or Files.
 |
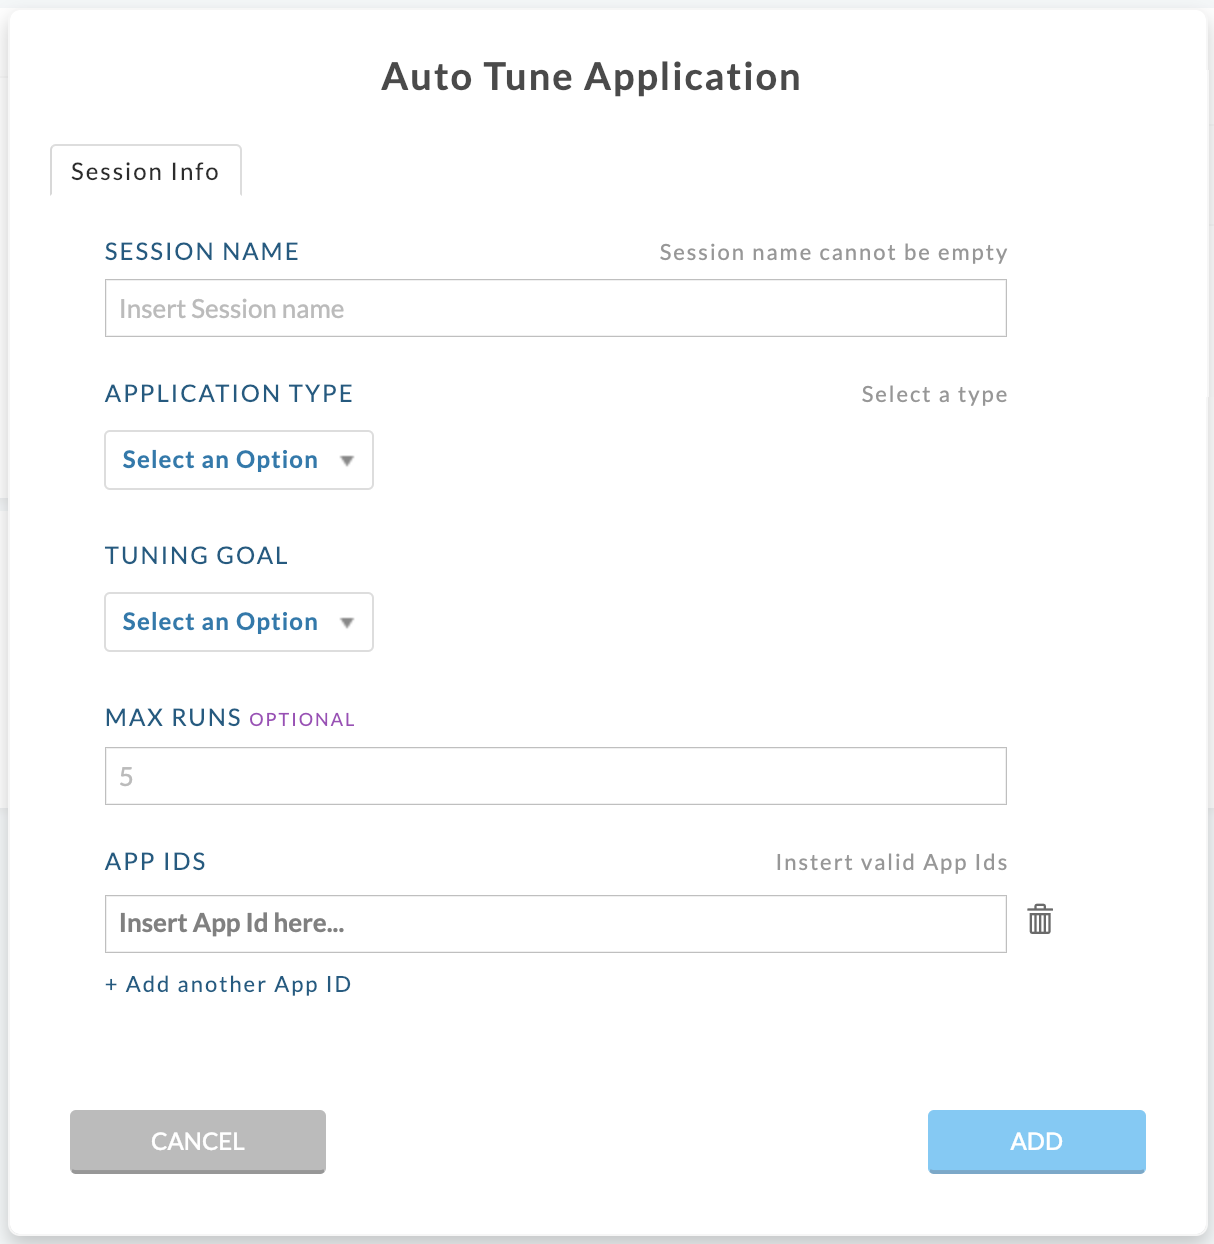
You have the additional option to specify the maximum number of runs. If not specified, it iterates for five (5) runs. When specified, the iteration stops at the maximum number or lack of recommendations, whichever comes first.
 |
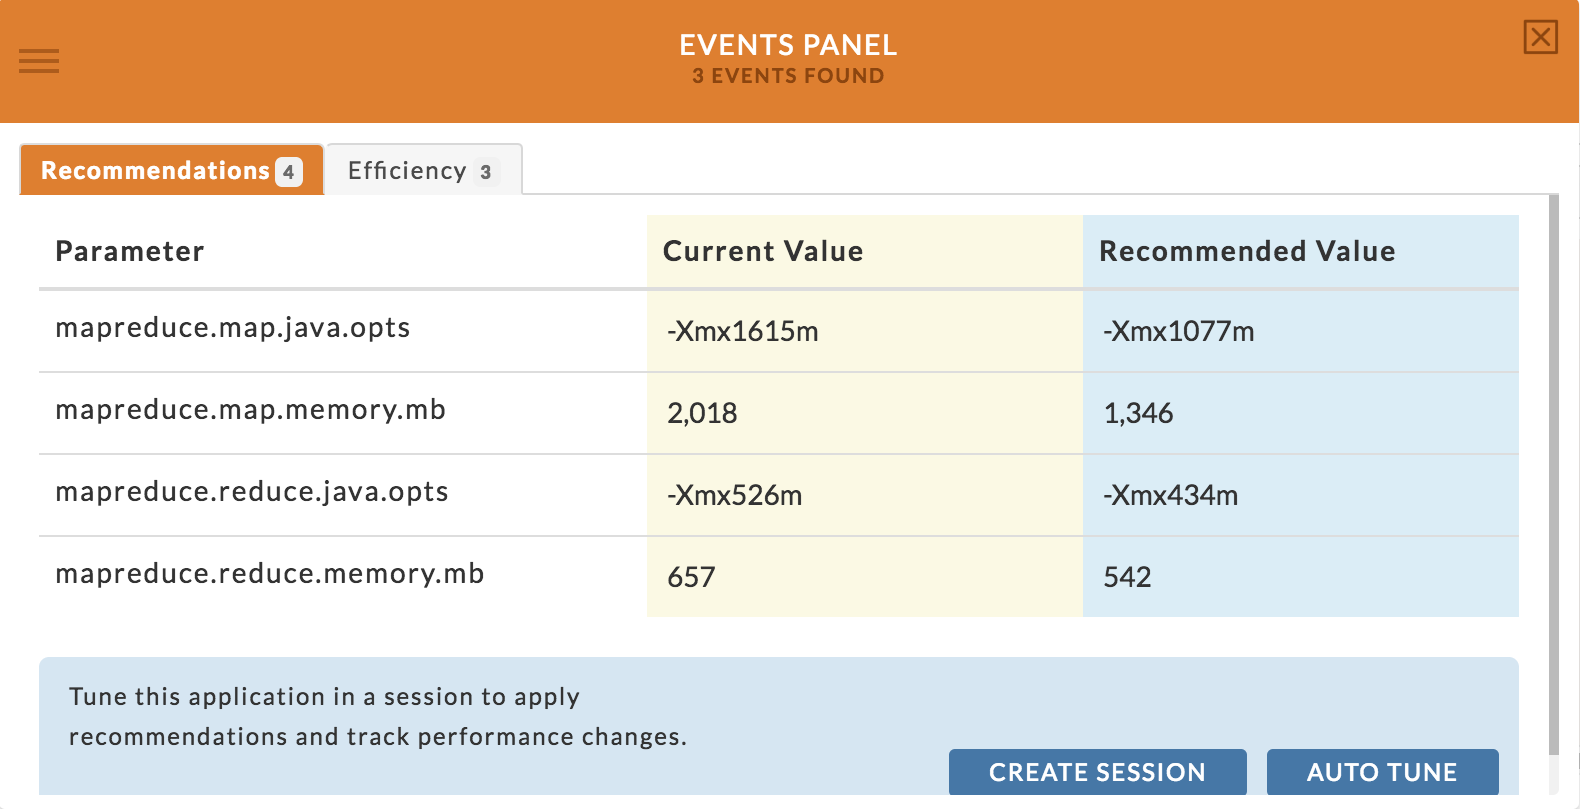
If an application has events with recommendations you can create a session directly from the recommendations tab. You can create either a manual or auto tune session. Click the type of session you wish to create and a session modal is filled in except for the session name.
 |
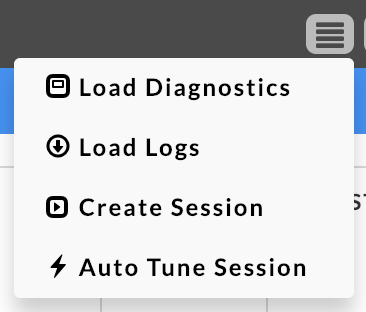
Once a Spark Application has completed, you may select to Create a Session or Auto Tune Session from the Actions tab.
 |
Session
The Session's APM layout is similar to all APMs. Instead of KPIs reflecting the Application, Session's KPIs are trend graphs showing the various runs' resource usages measured when tuning, duration, IO, and resources. The example below is a session view immediately after creation.
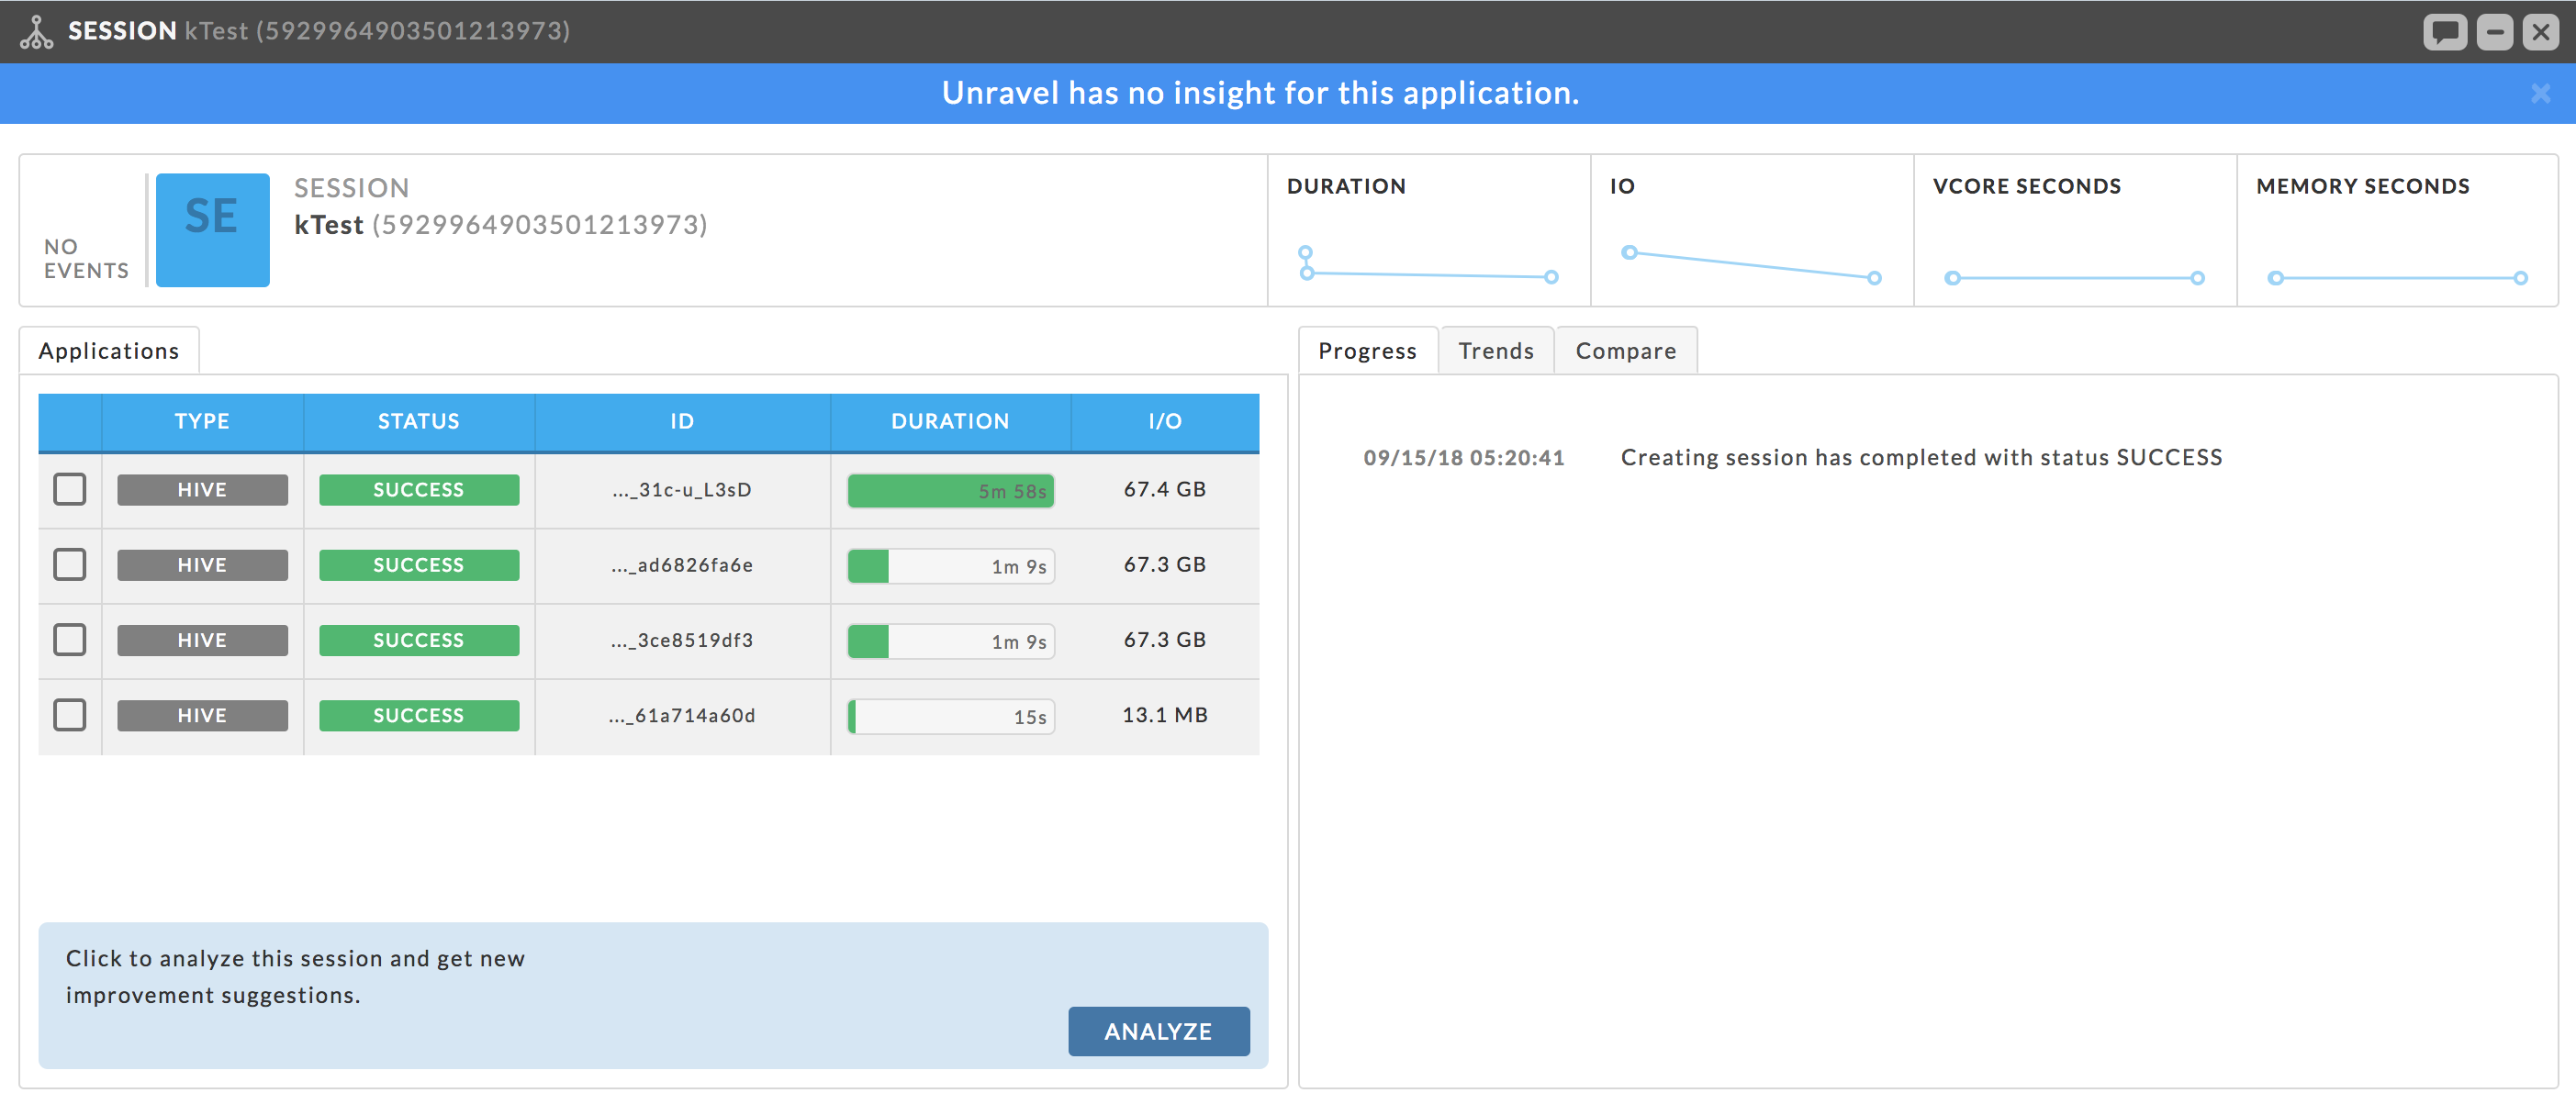
The left tab, Applications, is the list of runs; initially it is whatever was loaded when the session was created. As analysis and application of recommendations occur more runs are added.
Right tabs
Progress Tab - Keeps a log of all the activity. See example above.
Trends - Expanded graphs of Duration, IO, and Resources.
Compare - Allows you to compare two (2) runs.