Best practices for end-to-end monitoring of Kafka
It can be difficult to understand what is happening in your Kafka cluster and to successfully root cause/troubleshoot problems. In order to help you do this, Unravel provides insights and visibility throughout all levels of your cluster. This includes the ability to drill down into apps acting as consumers processing data streams. Unravel's Kafka monitoring and insights are built-in; no configuration is required once you have connected Unravel to your Kafka cluster.,
In the following examples are some of the best practices for using Unravel to monitor your Kafka environments. It is assumed you have basic knowledge of Kafka concepts and architecture.
Your starting point in Unravel is Operations > Usage Details > Kafka. It displays the overall health of the cluster and provides immediate access to your cluster's brokers and topics.
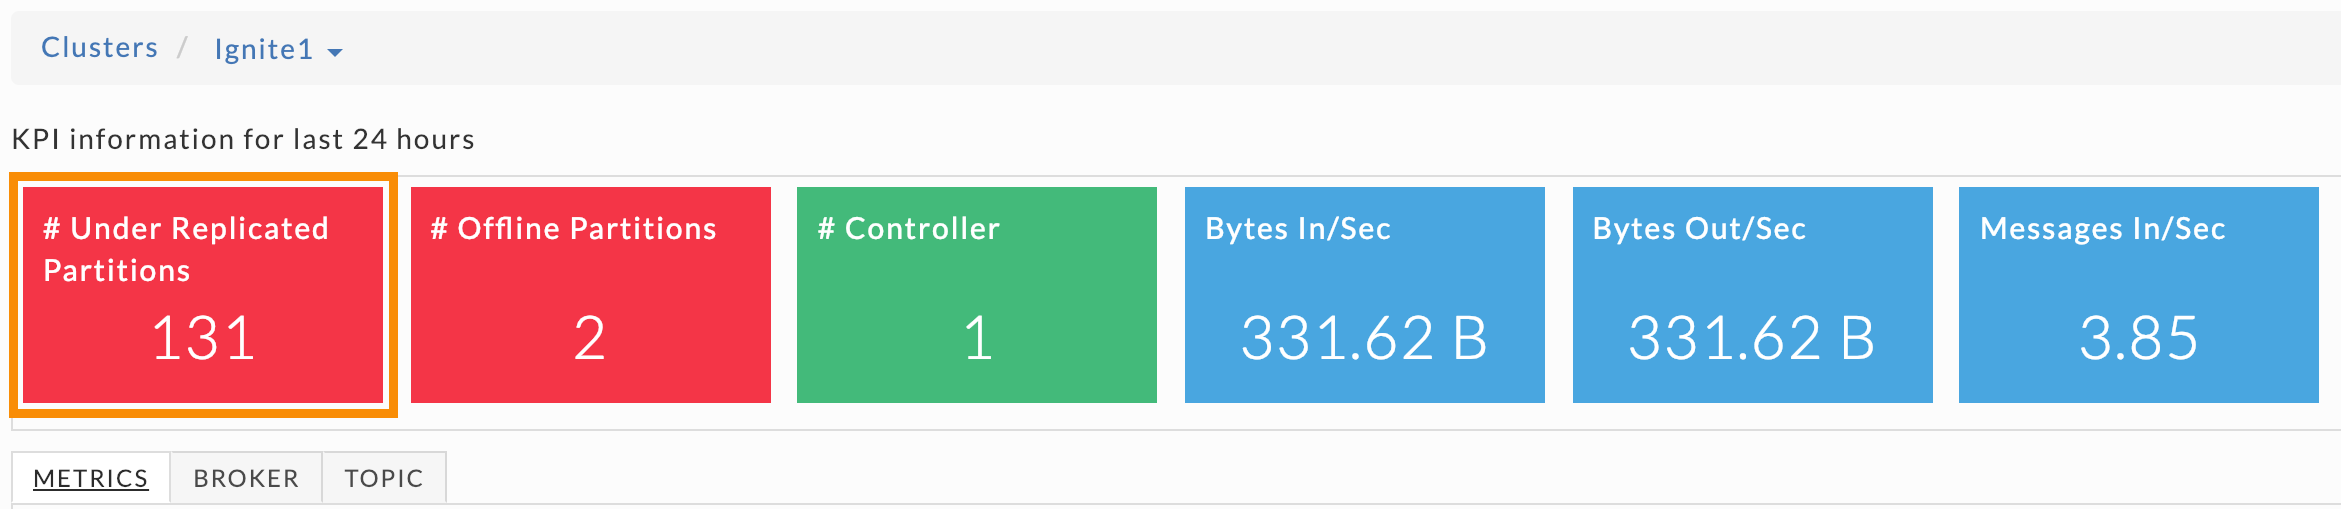
Unravel provides six cluster-wide KPIs to give you an immediate view of the Kafka cluster's overall health and IO. The first three KPIs provide information on your clusters' partitions and controllers. They are color-coded so you can quickly ascertain their health.
Green = Healthy
Red = Unhealthy, alert for metrics and investigation required
The next three KPIs are data IO metrics and are always blue. Beneath the KPIs are three tabs, Metrics, Broker, and Topic. The Metrics and Broker tabs have the same graphs but contain different data, cluster-wide, and broker specific data respectively.
These KPIs and the data graphs help you root cause existing problems or identify potential issues. Immediate access to your cluster's brokers and topics allow you to quickly drill down and locate the problematic areas. Below we examine a few scenarios.
Under replicated partitions
 |
A healthy cluster has no under replicated partitions. If this KPI is greater than zero, your replication isn't occurring as fast as configured. This under replication:
Adds latency as consumers don't receive their needed data until messages are replicated.
Suggests you are more vulnerable to data loss if you have a master failure.
If you have under replicated partitions, it typically points to a problem with one or more brokers. You should root cause the problem immediately to avoid any data loss.
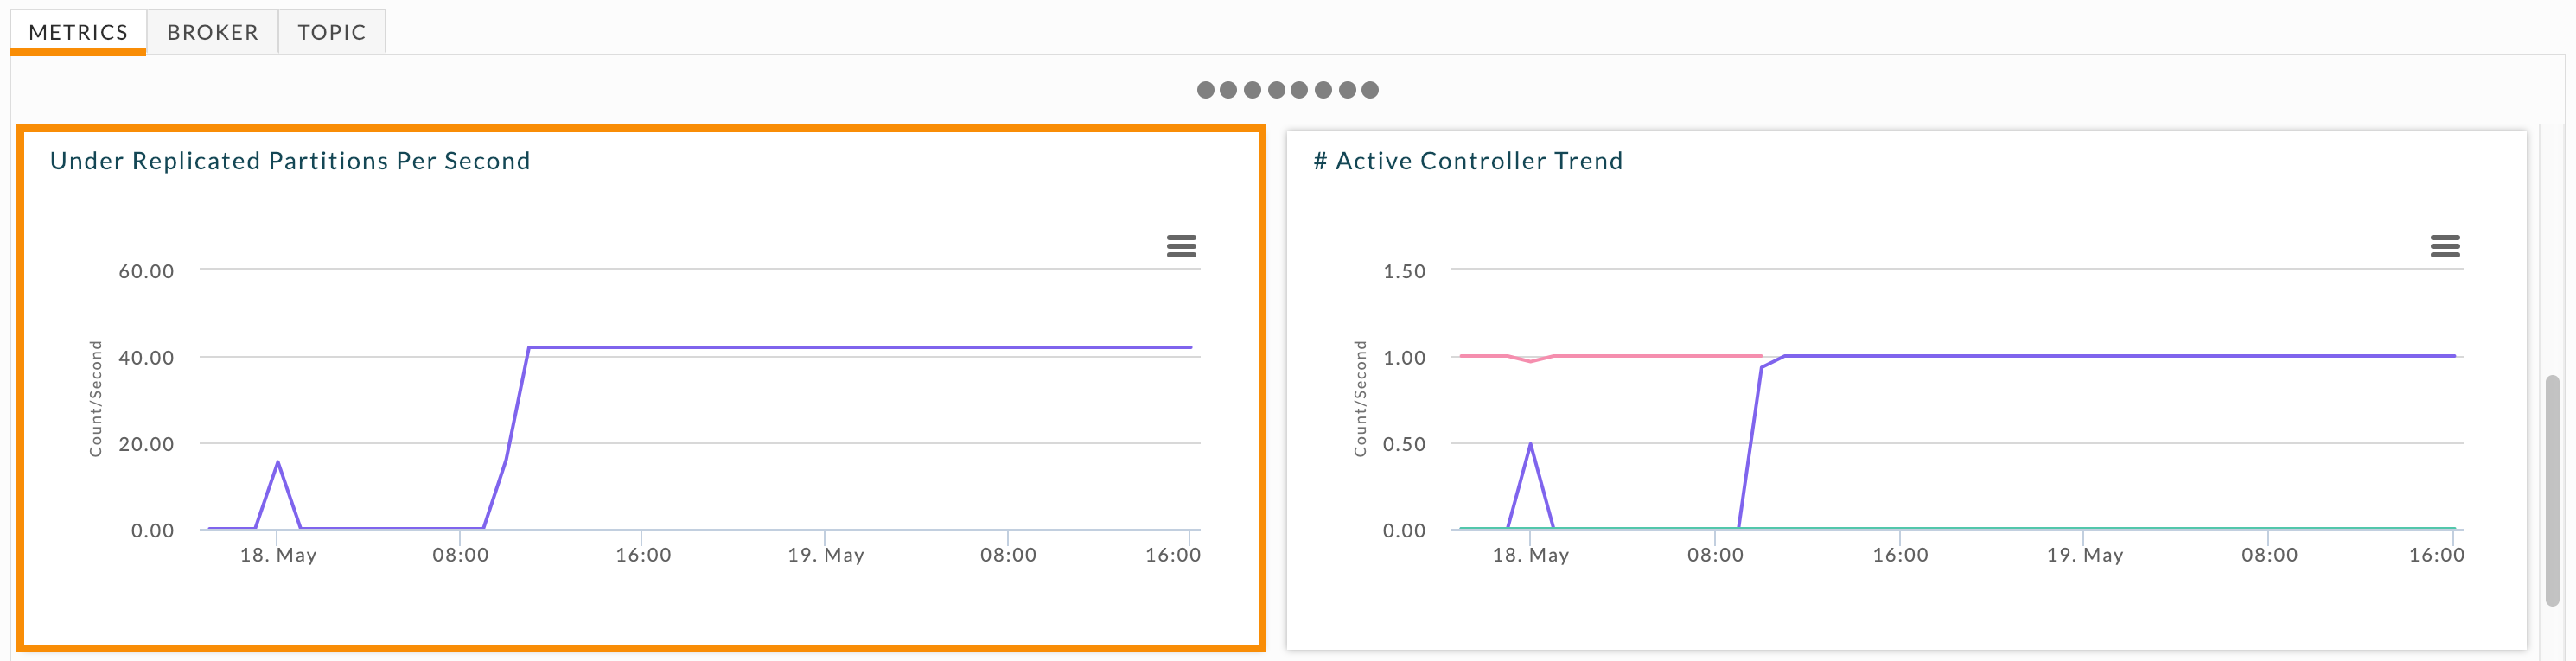
First, you need to understand how often the under replication is occurring. Scroll down in the Metrics tab to locate the Under Replicated Partitions graph to see the under replication over time across the cluster.
When you see current or consistent under replication drill down into the brokers. Click the Broker tab for the list of brokers and their KPIs. Brokers having problems will have 1 or greater listed in Under Replicated Partitions column. Click each broker with under replicated partitions and scroll down to its Under Replicated Partitions graph.
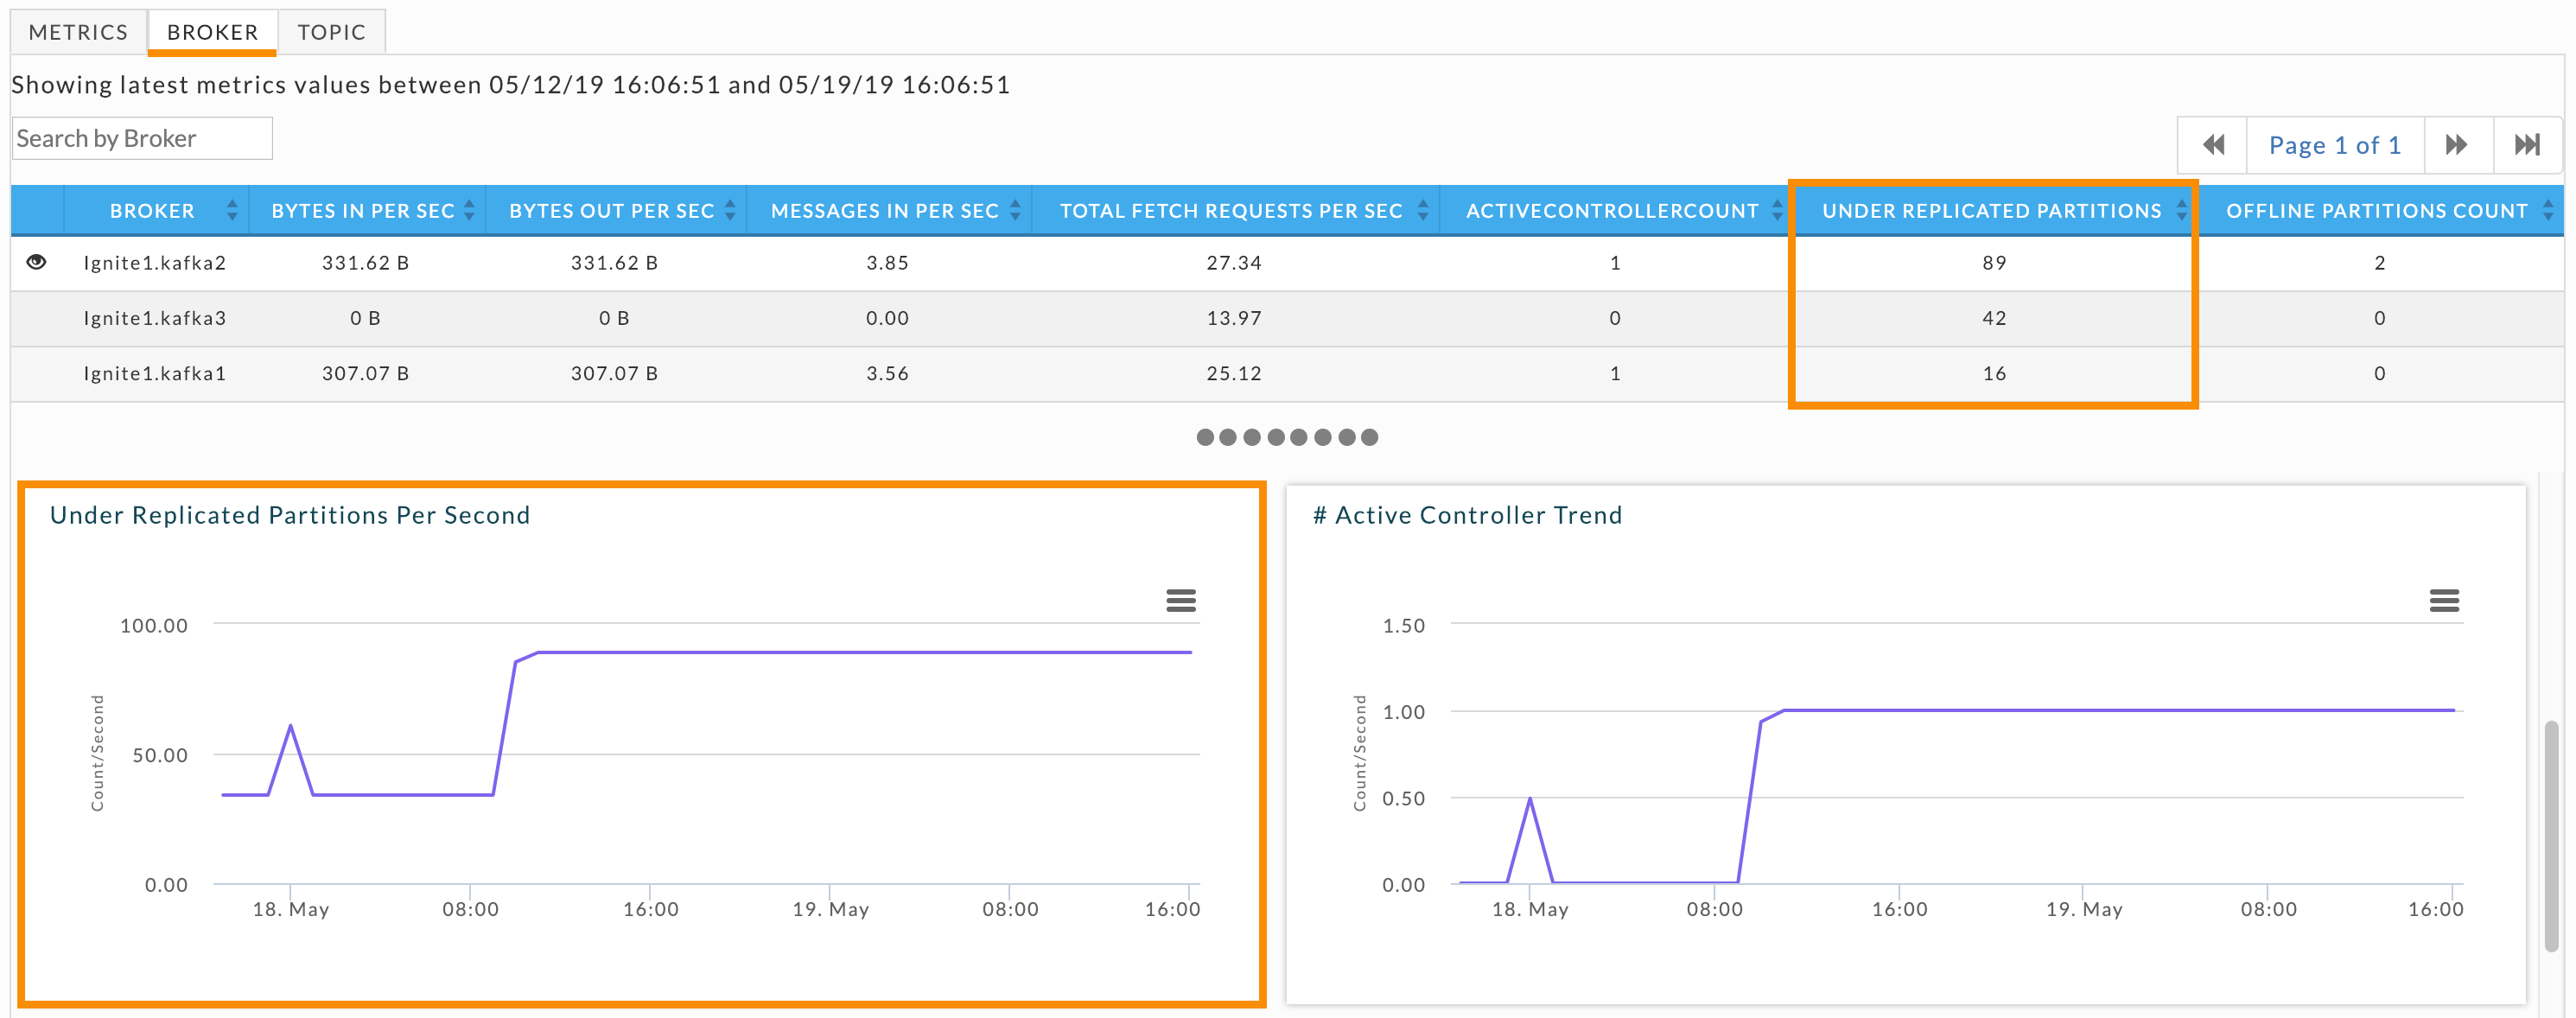
Once you have identified the problem brokers, examine each of their logs to determine the root cause.
Log flush latency
Log flush latency is important; it is also related to under replicated partitions.
The longer it takes to flush the log to disk, the more the pipeline backs up, and the worse the latency and throughput. When latency goes up, even as small an increment as 10ms, end-to-end latency balloons which can lead to under replicated partitions
The Log Flush Latency, 99th Percentile graph lets you keep track of the cluster's latency. At any given point in time, 99% of the log latency is less than this value. Scroll down in the Metrics tab to see the cluster's log latency graph. If the latency is fluctuating dramatically or is consistently high, you need to identify the broker that is contributing to it.
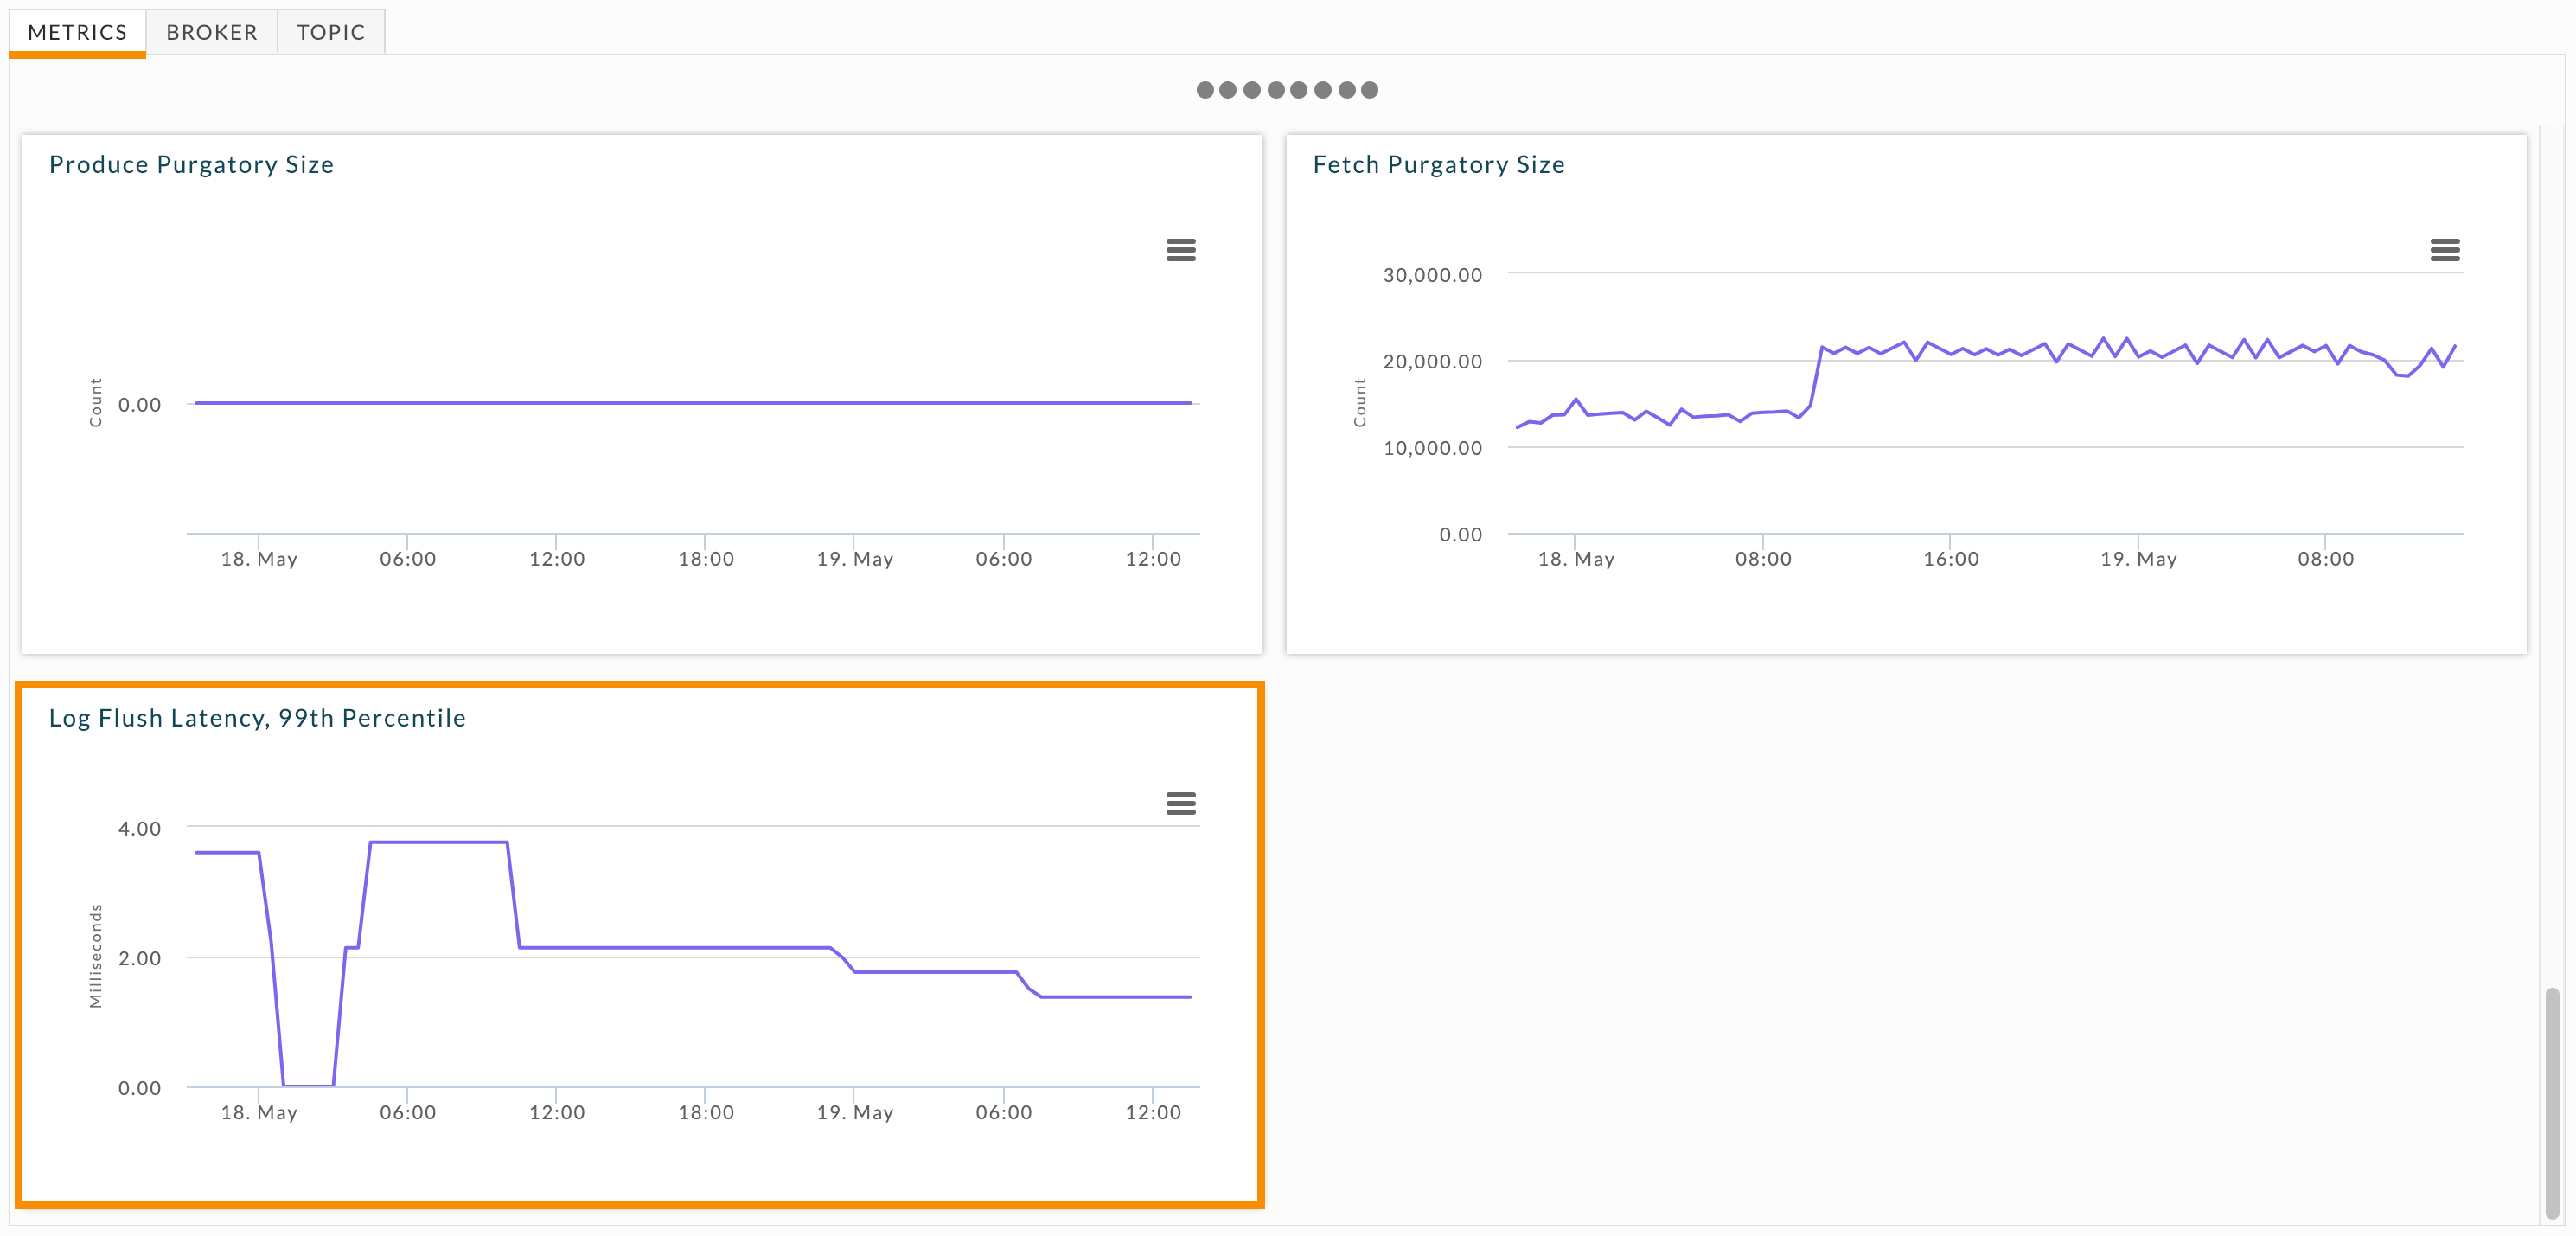
Click the Broker tab so you can examine individual brokers. Unlike under replicated partitions, the broker table doesn't include a log flush latency KPI. You must examine each broker individually. Click each broker and then scroll down to its Log Flush Latency, 99th Percentile graph.
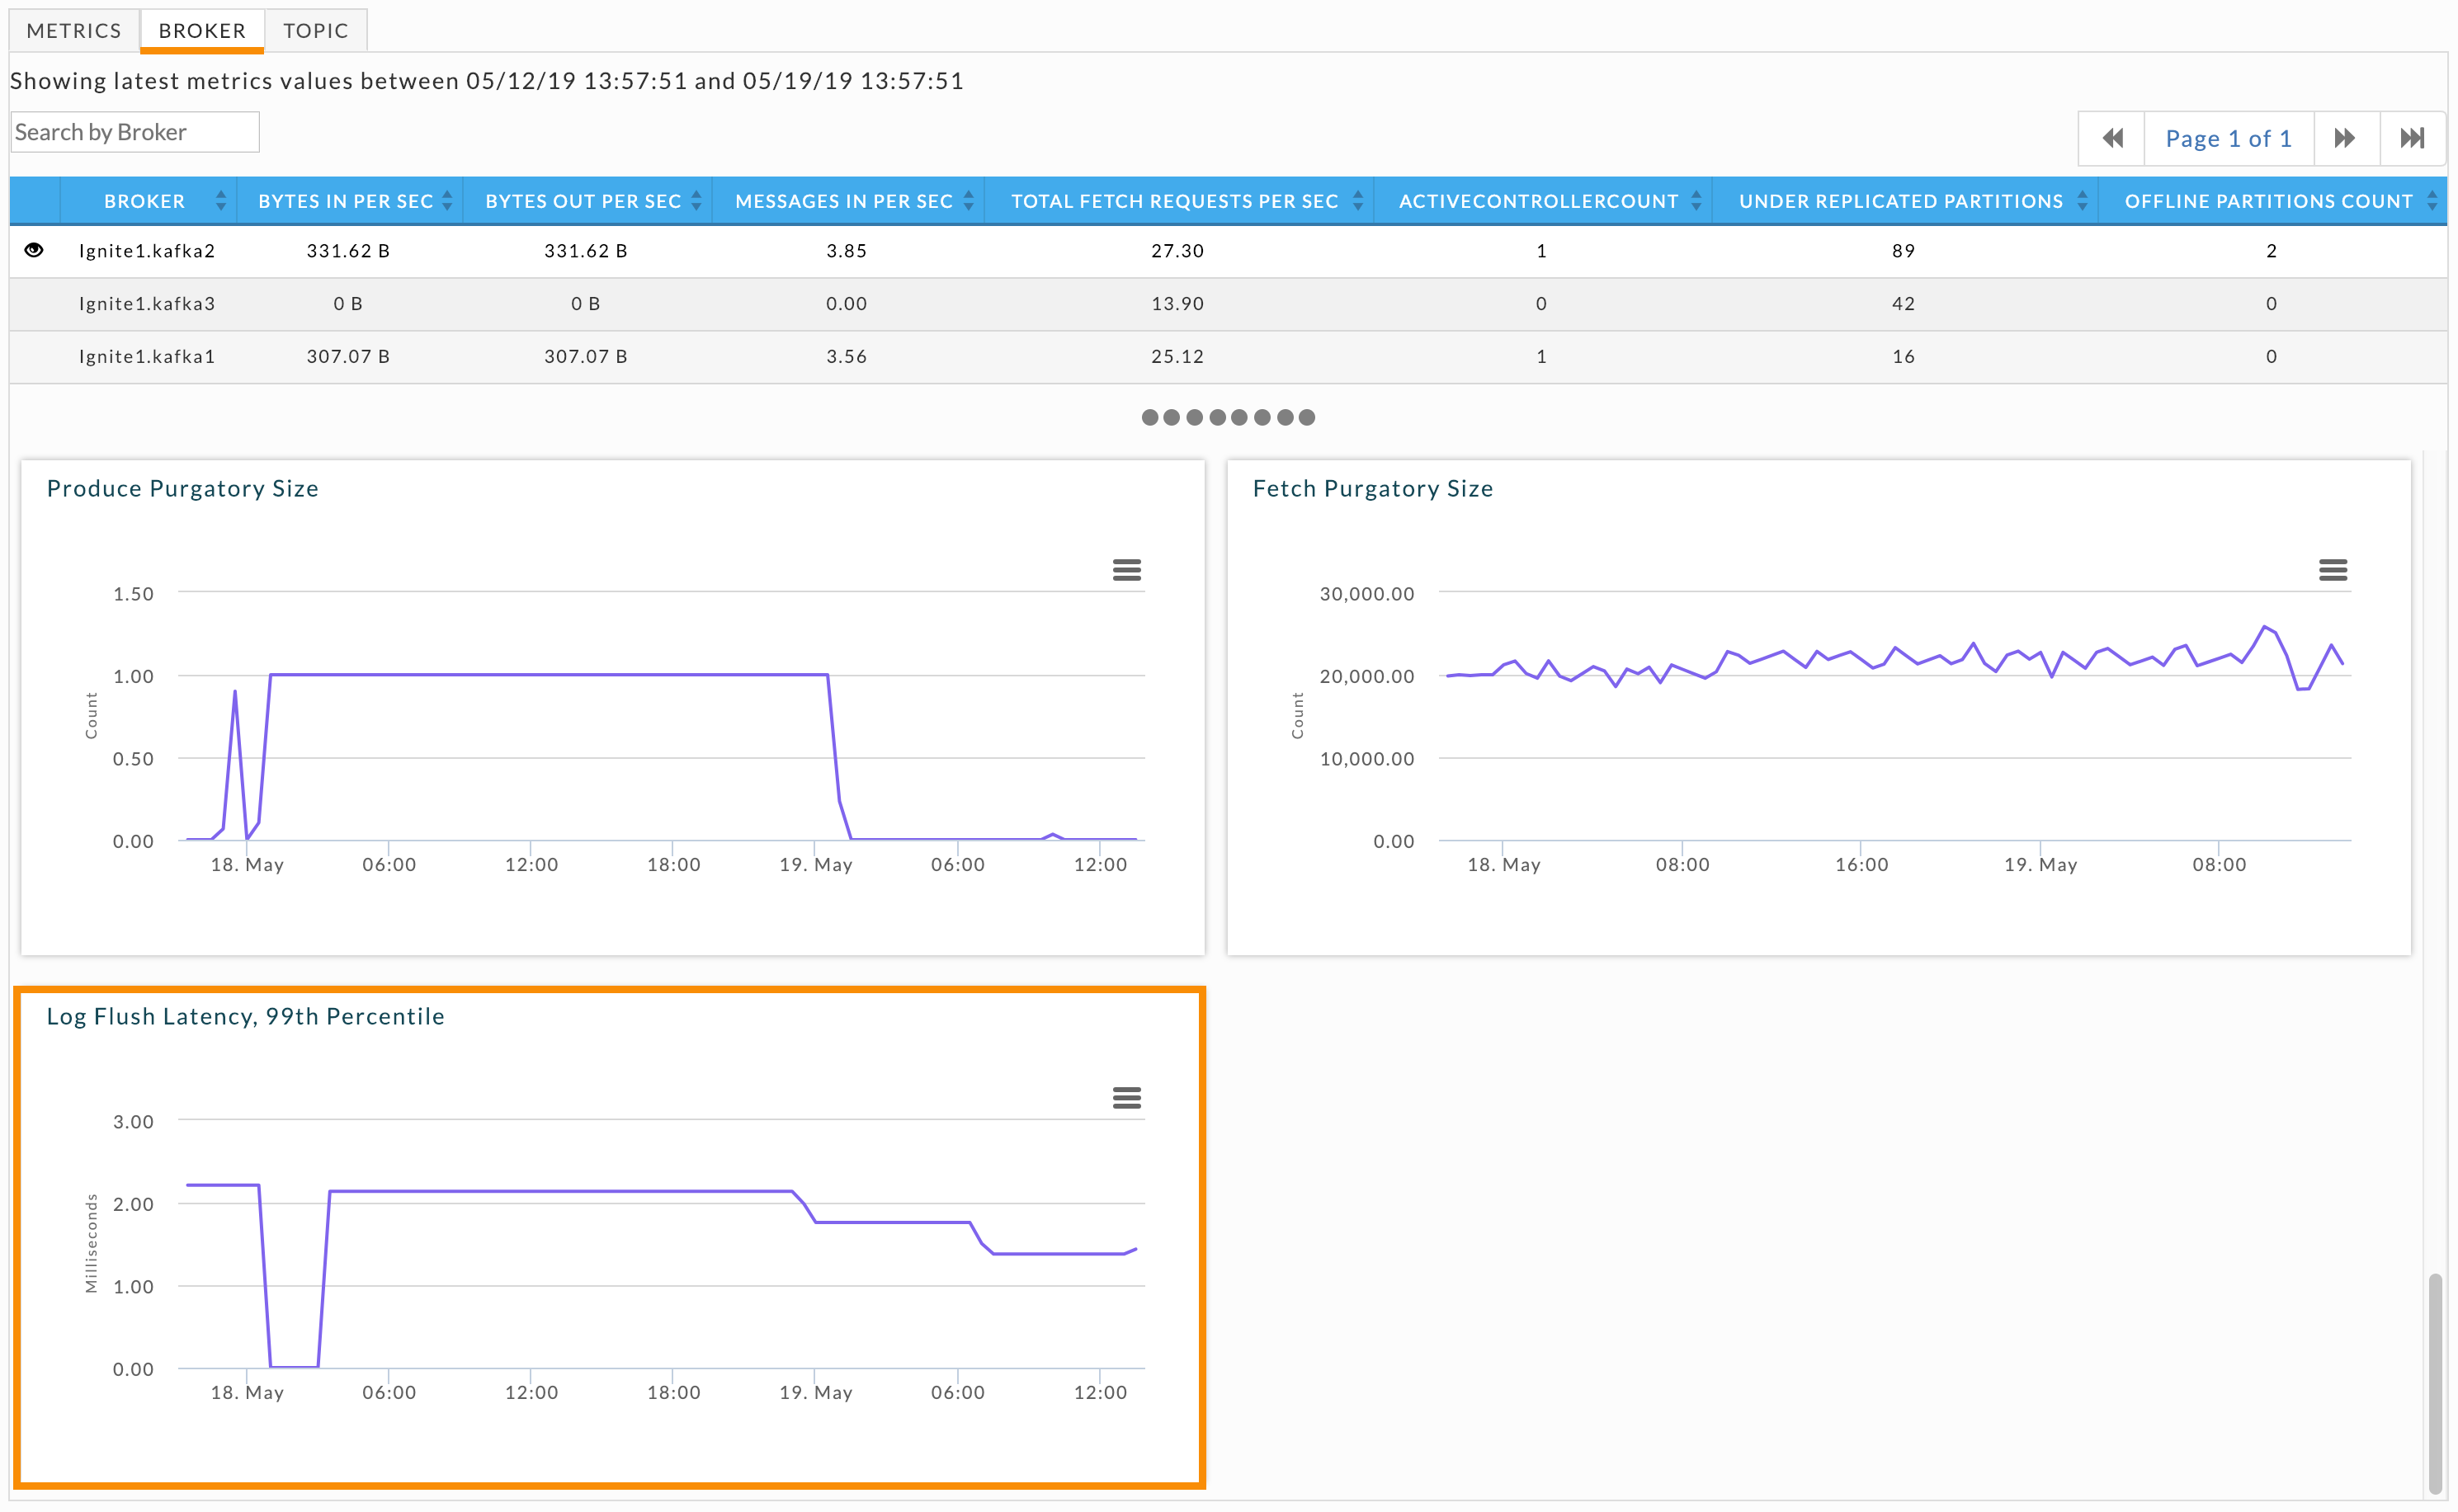
Problematic brokers have latency graphs with dramatic fluctuations or consistently high latency. After identifying these brokers, examine their logs to gain insight into the problem. If your cluster can keep up with the amount of data coming in, consider adding more brokers. Another possibility is that the node is "bad", e.g., the hard drive is going bad; if that is the case you should swap the node out for a healthy one. Regularly monitoring this graph can help you see trends which could lead to problems.
Offline partitions
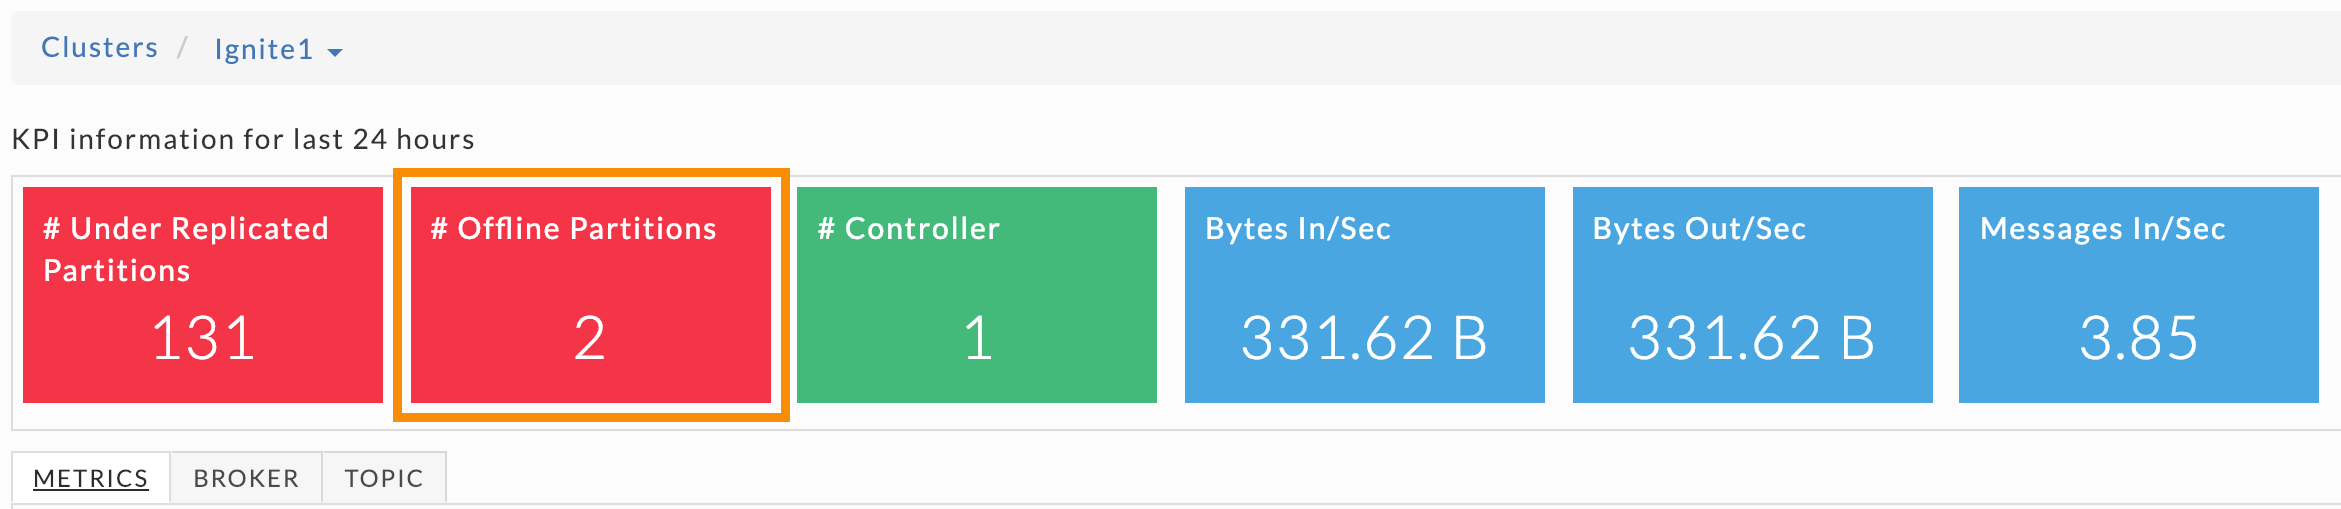
This KPI is the total number of offline topic partitions. A healthy cluster doesn't have any offline partitions. Offline partitions can occur if:
The brokers with replicas are down.
Unclean leader election is disabled and the replicas aren't in sync. In this case, none can be elected leader. (This may be desirable to ensure no messages are lost.)
When you have offline partitions you should immediately root cause the problem. Scroll down in the Metrics tab to locate the # Offline Partition Count graph and examine the offline partition number over time.
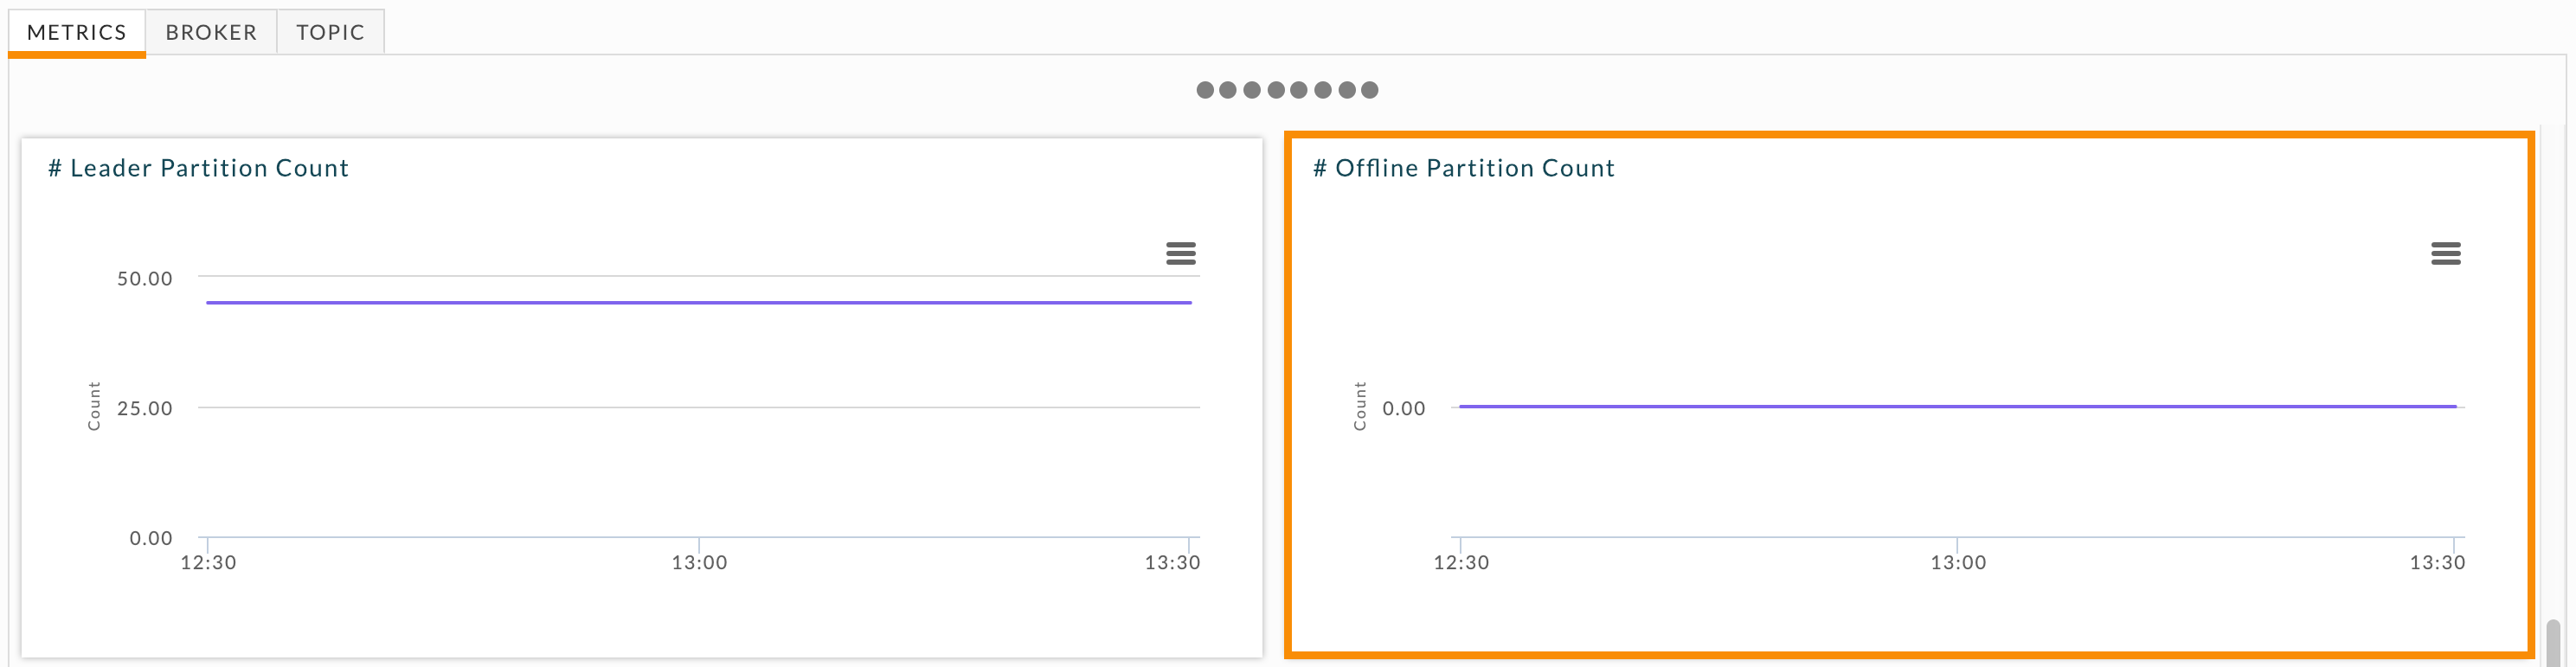
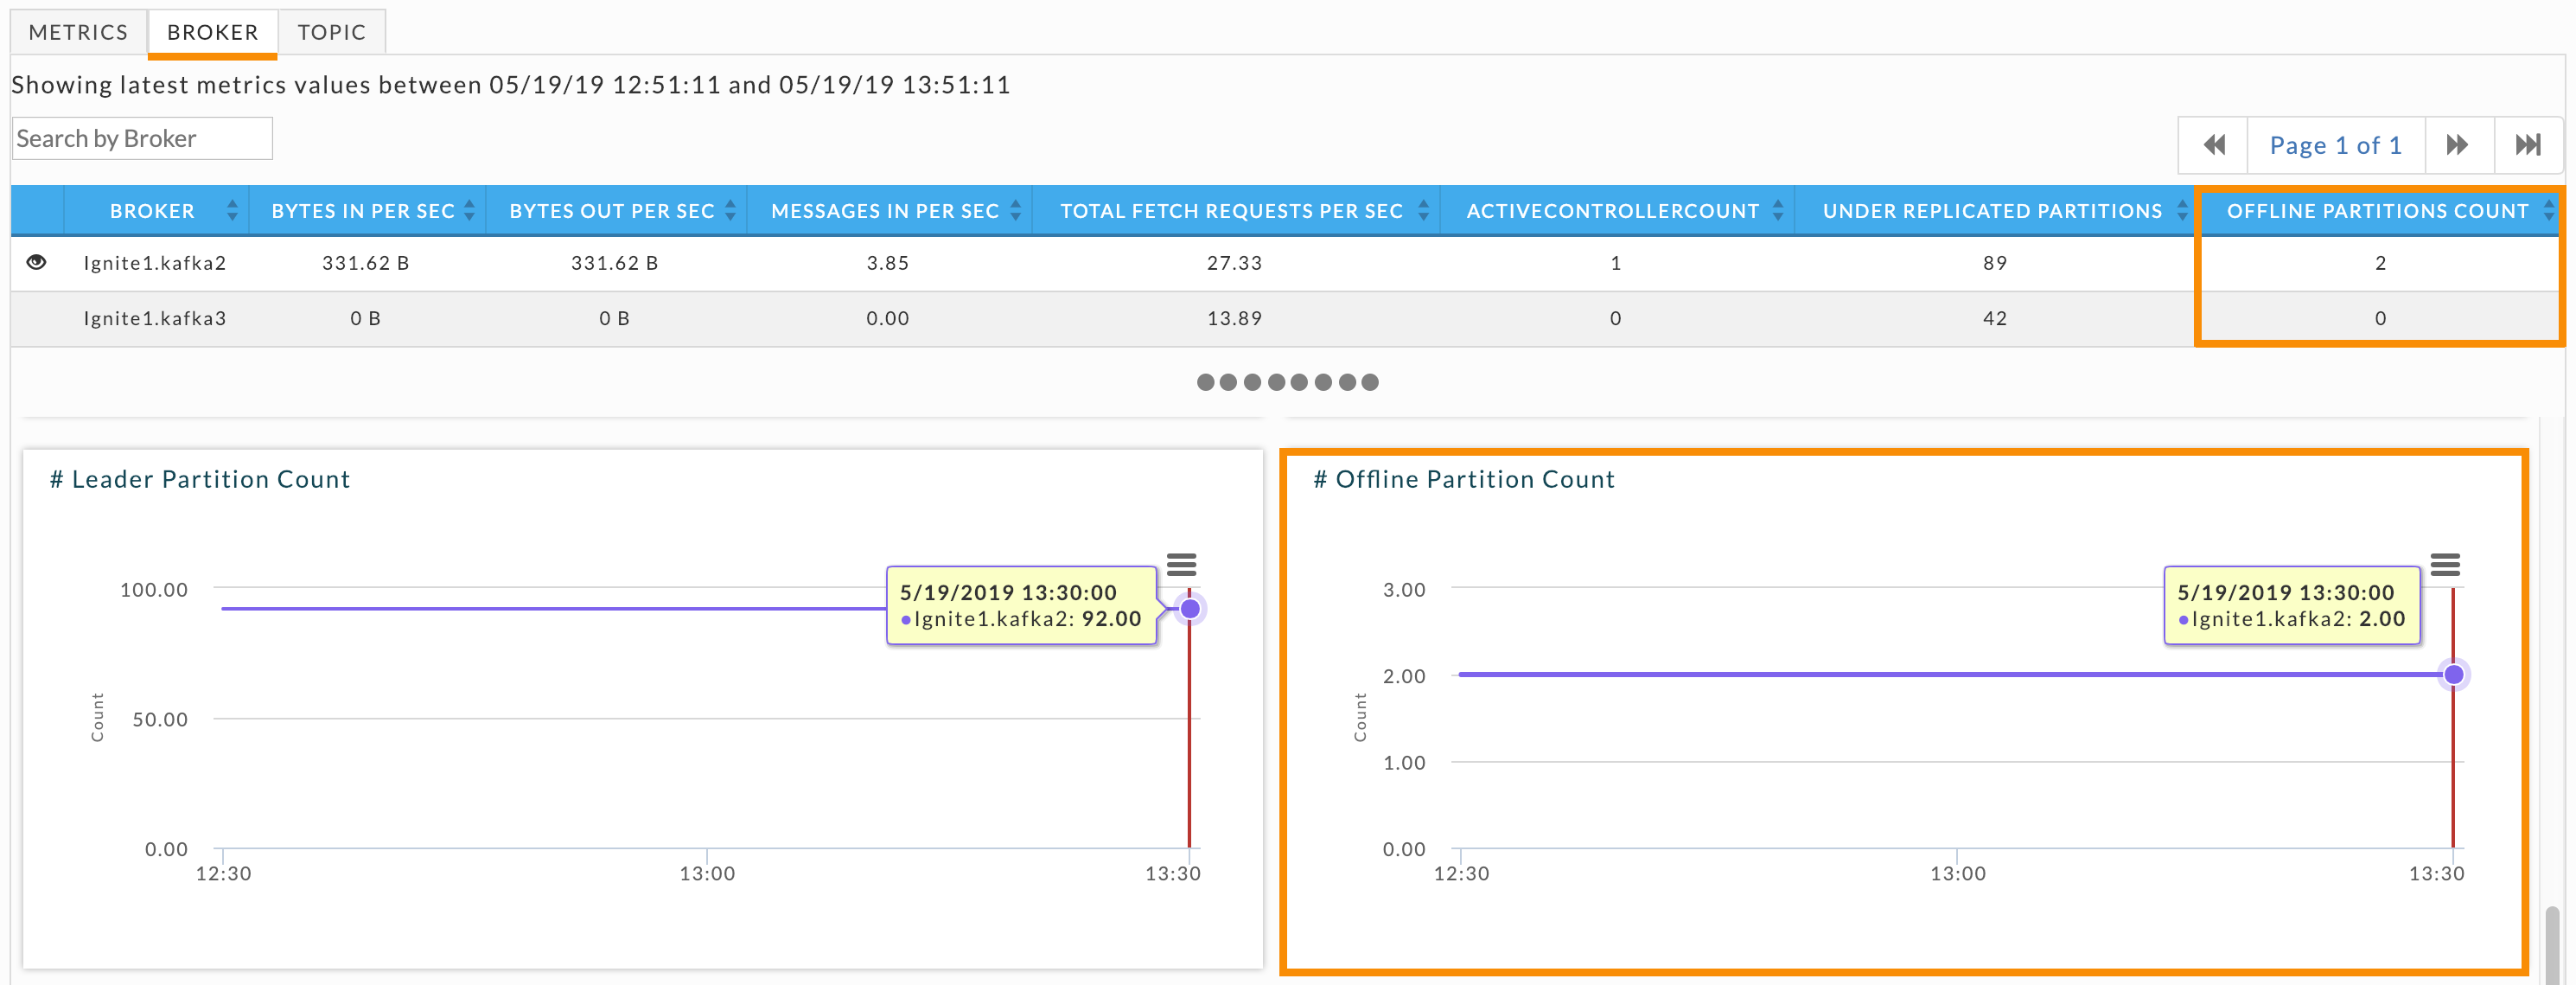
If you have currently have offline partitions, drill down into the brokers. Click the Broker, and check Offline Partitions Count for each broker. Click each broker with offline partitions and examine its # Offline Partition Count graph. It graphs the number of offline partitions over time and you can see whether the partition is currently offline, were briefly offline, or were offline for an extended period of time. After identifying the problem brokers, examine each broker's log to determine the cause of the problem.
Controller health
The # Controller KPI can indicate potential problems with your cluster.
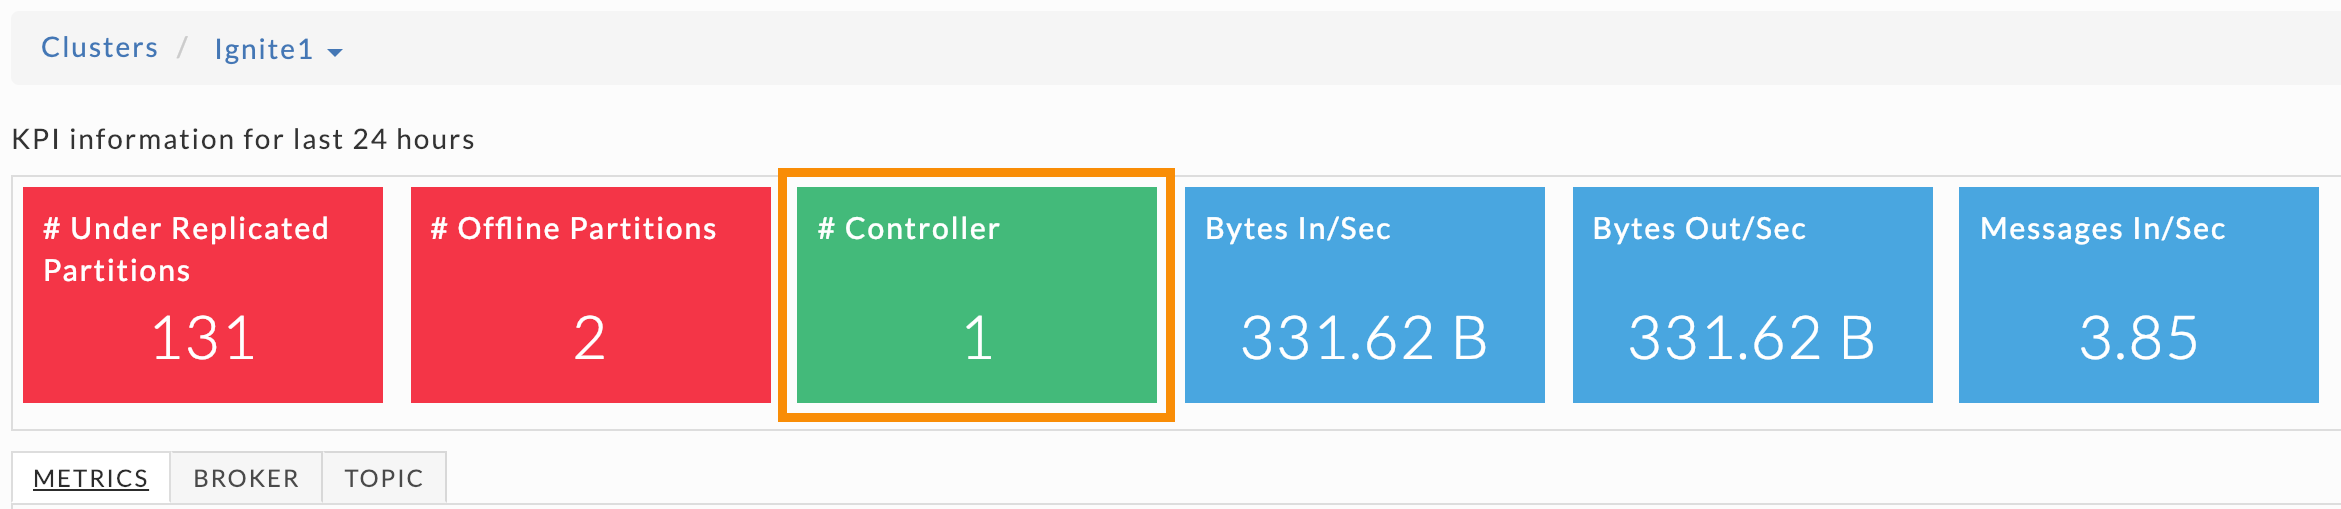
If the # Controller is:
0: There is no active controller. You want to avoid this since data can potentially be lost.
1: There is one active controller. This is the preferred state. During a steady-state there should be only one active controller per cluster.
Greater than 1: This is inconclusive and it's important to find out what is occurring. If this only persists for about a minute, it likely means the active controller switched from one broker to another. If this persists for longer, troubleshoot the cluster for "split-brain".
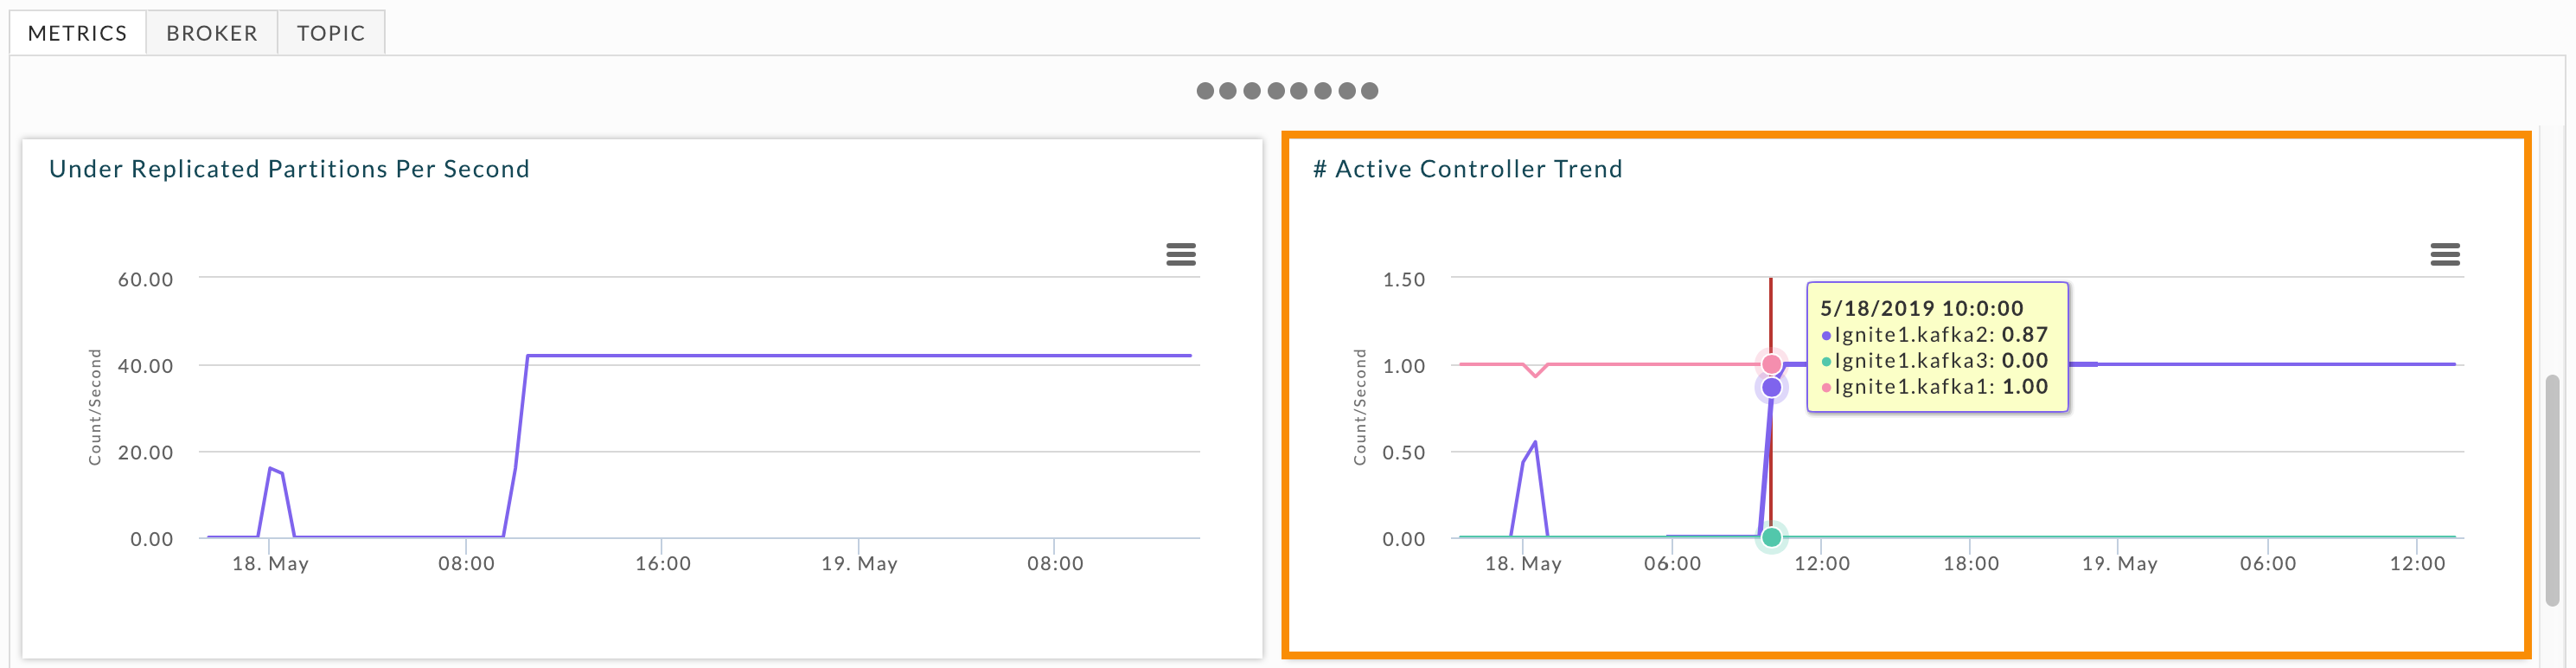
The # Active Controller Trend graphs all brokers and their status as the active controller. You can swiftly see where your cluster has problems. When the number of active controllers is greater than one for longer a minute or so, you should investigate the brokers' logs. Hover over the graph to see what brokers were active controllers simultaneously. You can view this graph for each broker individually in the Broker tab. When needed, examine the relevant brokers' logs for further insight. In this example, there are three points where the controller number is greater than one. The first two incidents were for a brief period, while the third was the active controller being switched from one broker to another. You don't need to investigate the latter, but you might want to investigate the former.
Cluster activity
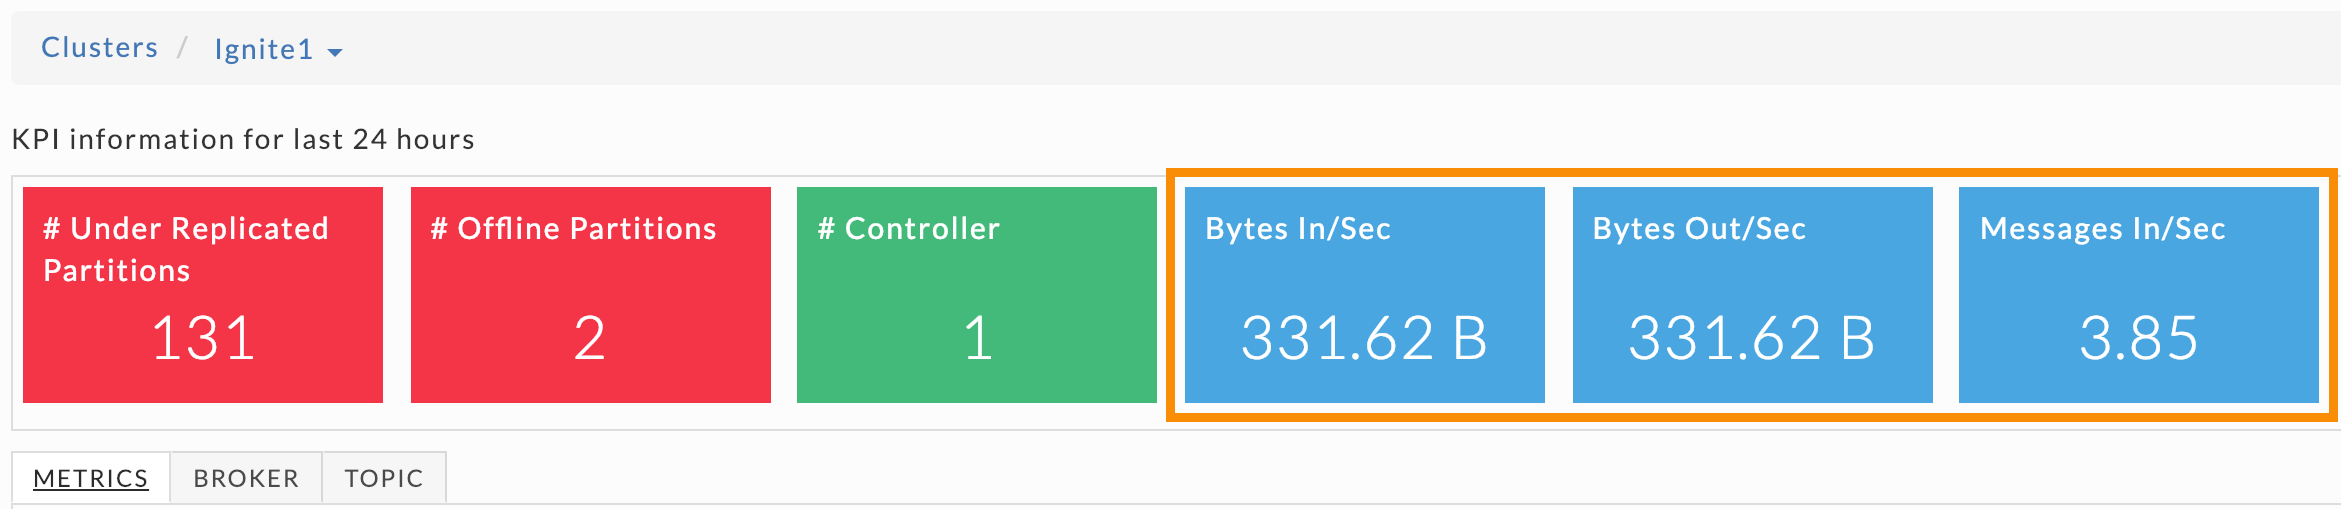
The last three KPIs show cluster activity within the last 24 hours. They are always colored blue because they are counts and therefore neither healthy nor unhealthy. These KPIs are useful in gauging your cluster's activity for the last 24 hours. As with the other KPIs, you can view their information graphically.
These metrics can be useful in understanding cluster capacity, and to:
Determine if you need additional brokers to keep up with data velocity.
Evaluate the performance of topic architecture on your brokers.
Evaluate the performance of partition architecture for a topic.
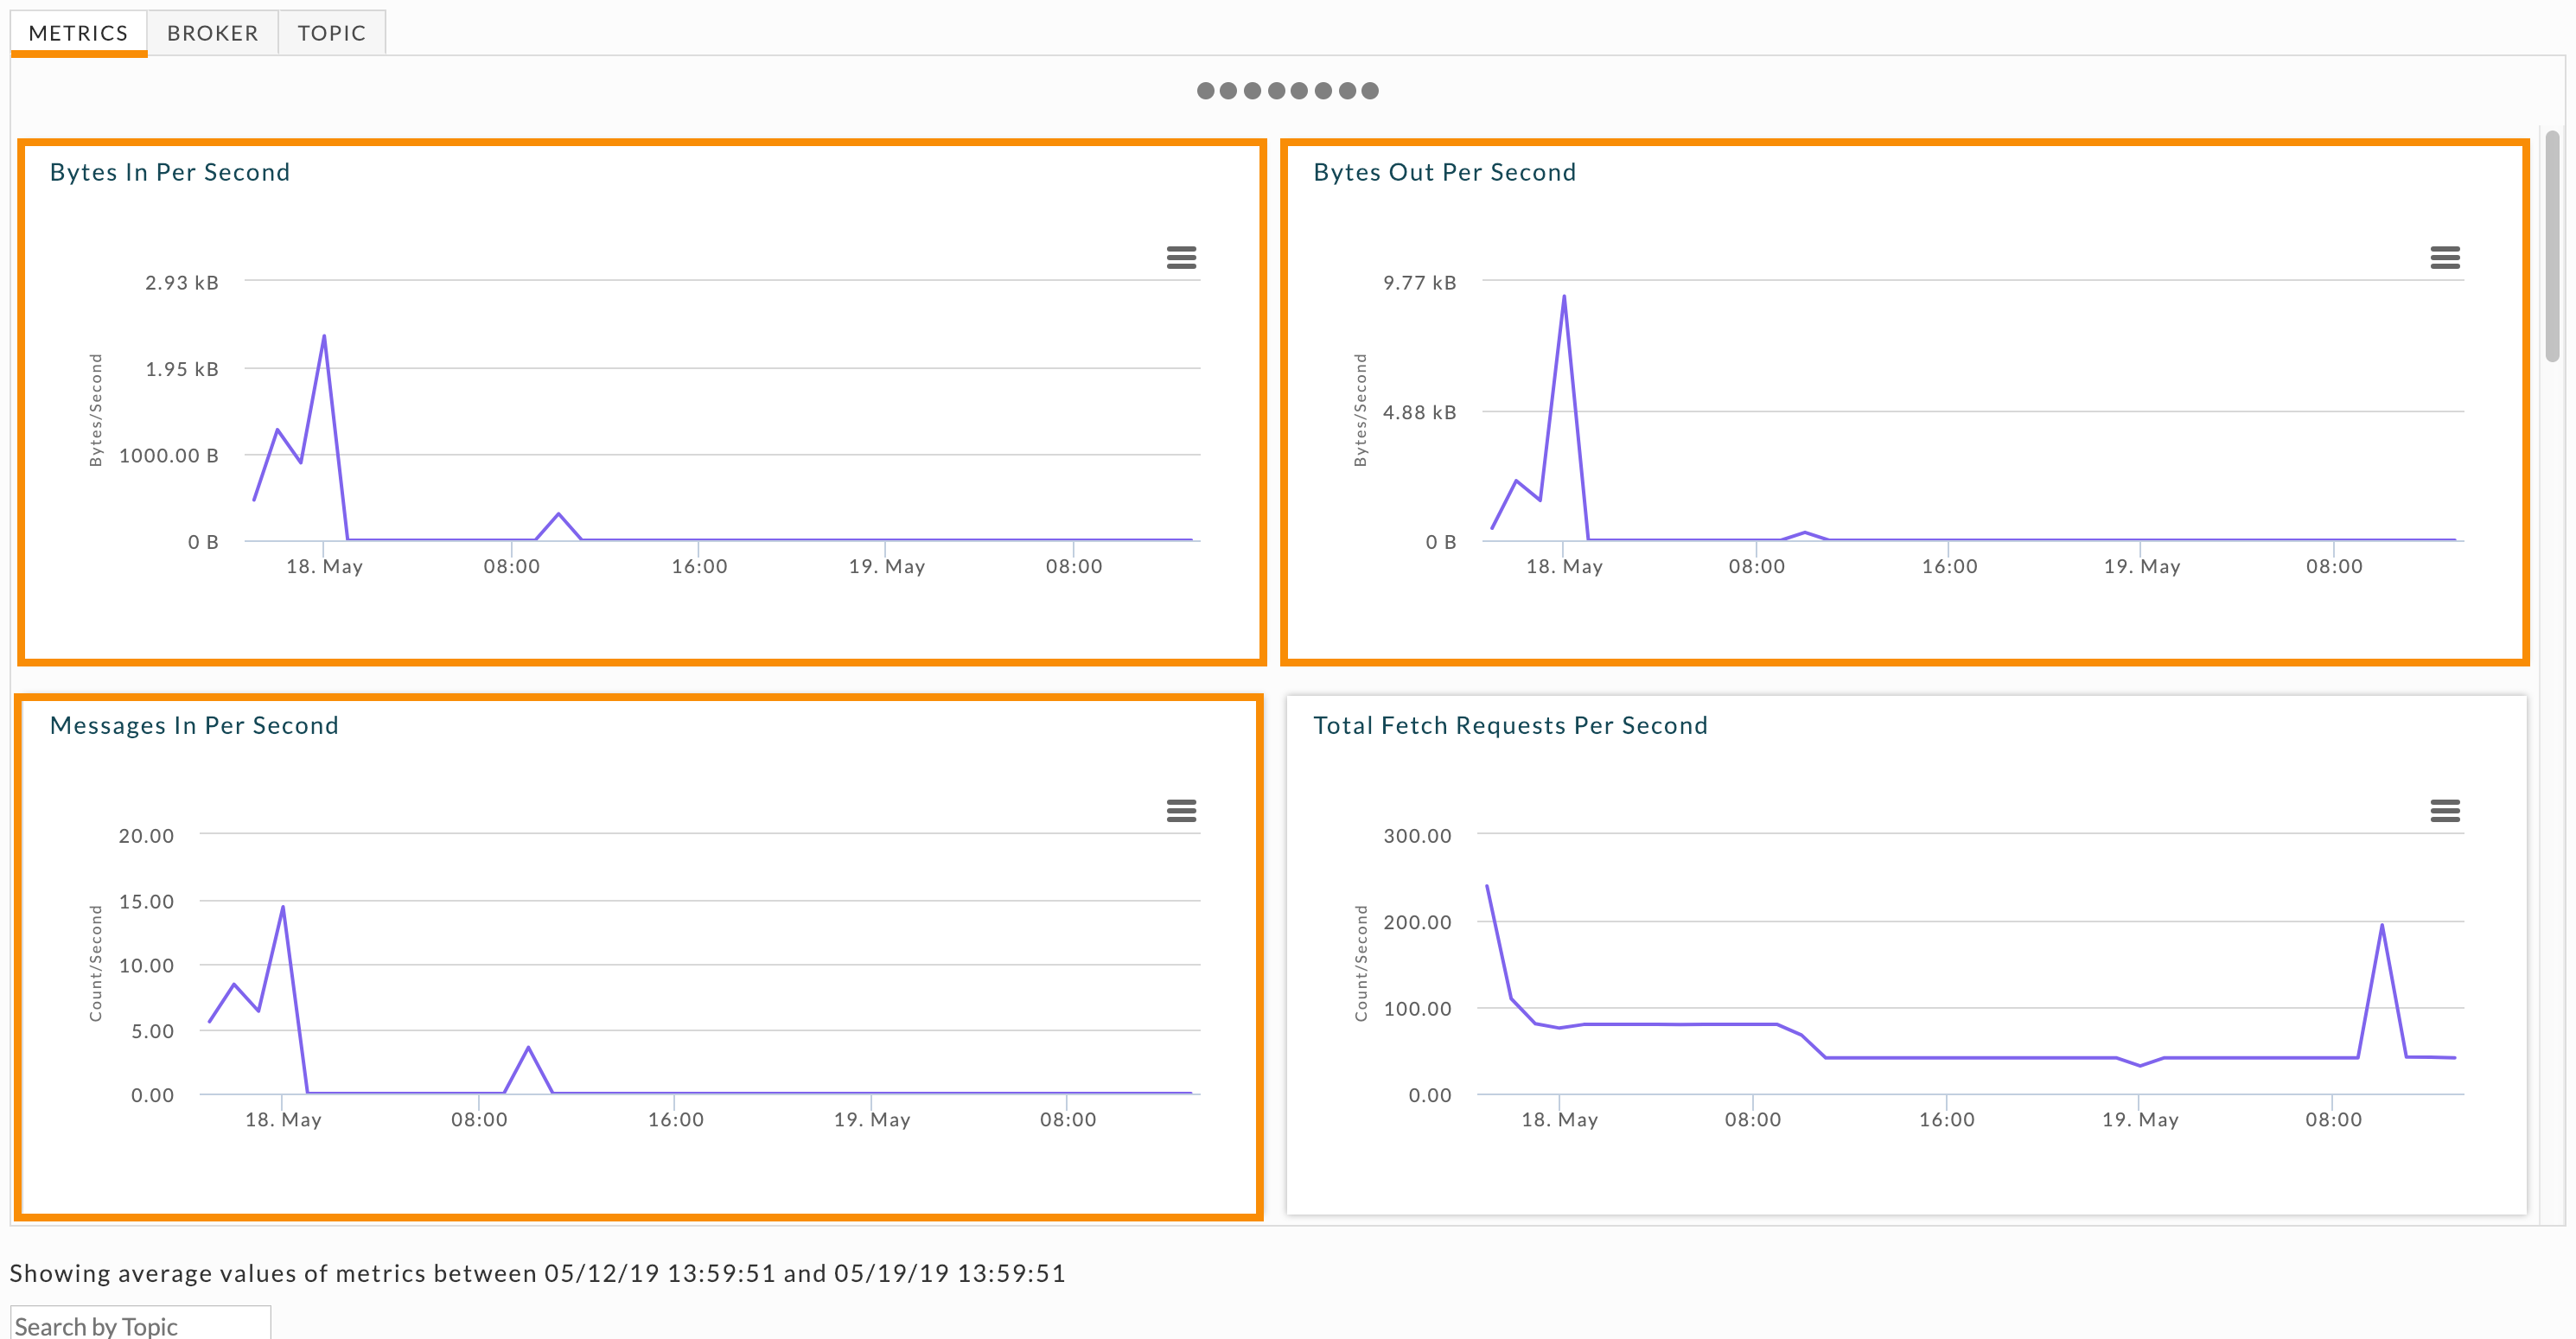
These metrics are graphed over time and you can view them across the cluster, by broker, or by topic. Shown here are the Metrics graphs for the KPIs. Click the Broker or Topic tabs to see the metrics across a specific broker or topic.
Topic partition strategy
This section provides best practices for using Unravel to evaluate your topic/broker performance.
A common challenge is providing an architecture for the topics and partitions in your cluster which can, and will, support the data velocity coming from producers. Typically, adjustments have tended to be a "shot in the dark" because of a lack of relevant data. Unravel provides detailed information to shed light on how your architecture is performing, which, in turn, can help you to re-configure your architecture for better performance.
Producer architecture
It can be a challenge in deciding how to partition topics on the Kafka level. Producers can choose to send messages via key or use a round-robin strategy when no key has been defined for a message. Choosing the correct number of partitions for your data velocity is important to ensure you have a real-time architecture that is performant.
You can use Unravel to get a better understanding of how your current architecture is performing. Then, use the insights to guide you in choosing the number of partitions.
Click the Topic tab and scroll down for the list of topics in your cluster. You can quickly identify topics with heavy traffic and where you should examine your partitions' performance.
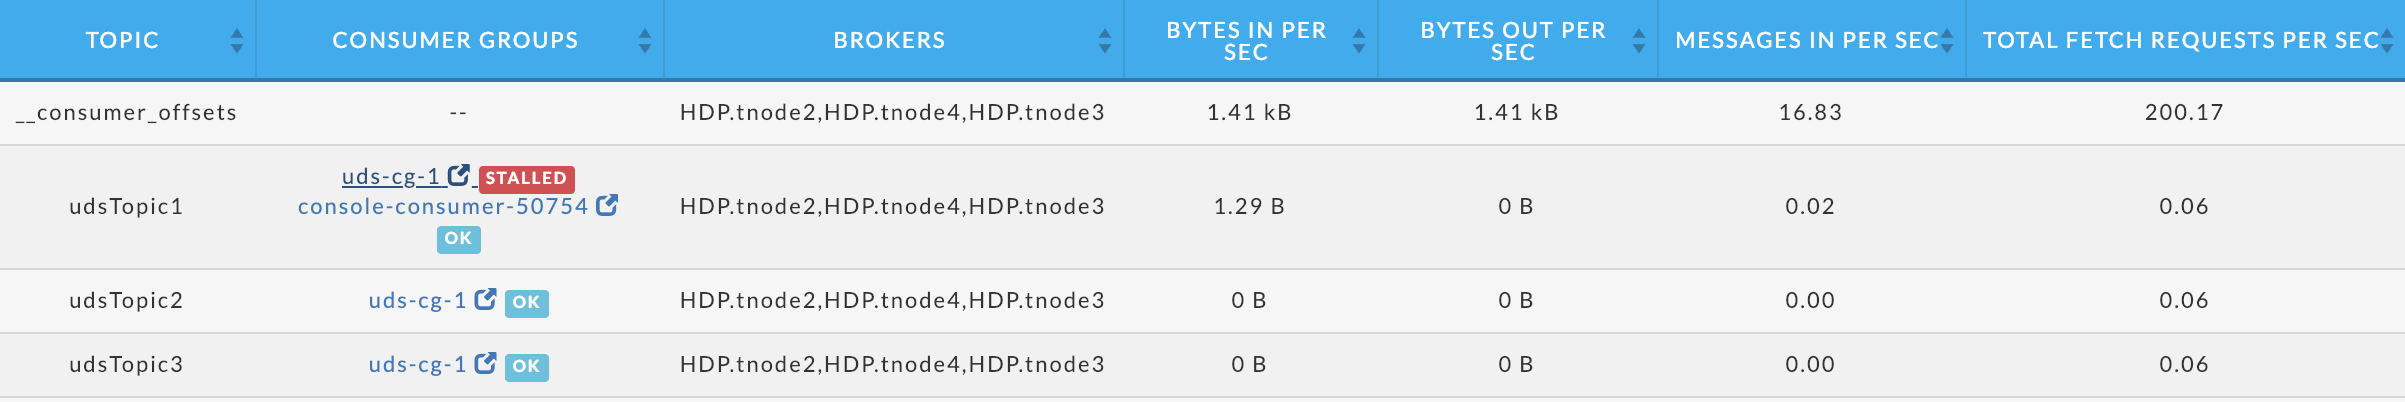
For topics that are experiencing heavy traffic or are in trouble, click its consumer. You can then see the consumer's topic list and the health of each topic. Use this information to help you determine the correct number of partitions.
Consumer group architecture
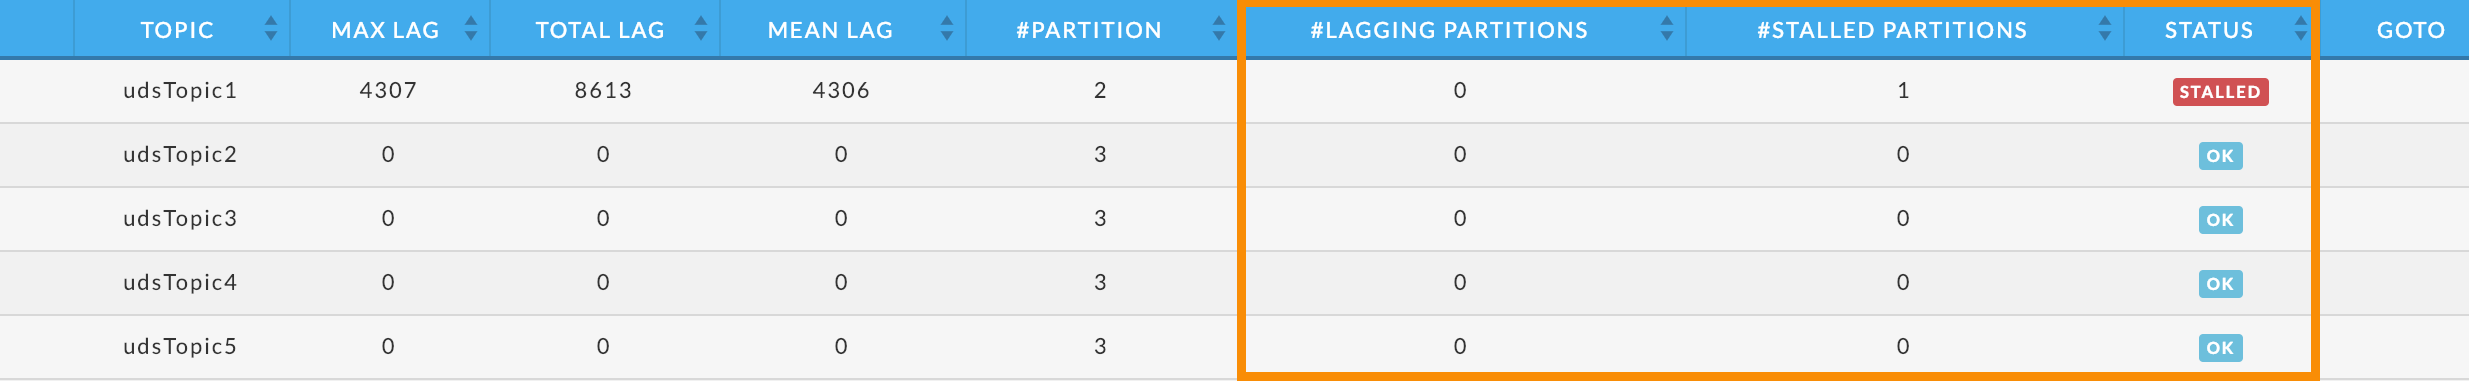
You can make changes on the consumer group side to scale according to your topic/partition architecture. Unravel provides a convenient view for each topic's consumer groups so you can quickly see the health status of each consumer group in your cluster. When the consumer group is a Spark Streaming app Unravel can provide insights for it, thereby providing an end-to-end monitoring solution for your streaming apps.
See Kafka Insights for a use case on monitoring consumer groups, and lagging/stalled partitions or consumer groups.