Tez details page
A Tez application can have multiple Hive queries. Each Hive query is represented in a DAG. The Tez applications details page provides a comprehensive view of the behavior of Hive queries on Tez applications. Each hive query can be drilled to its corresponding DAGs (Directed Acyclic Graphs).
The Tez details page displays the details of both the Live Long and Process (LLAP) and the non-LLAP queries for Tez apps.
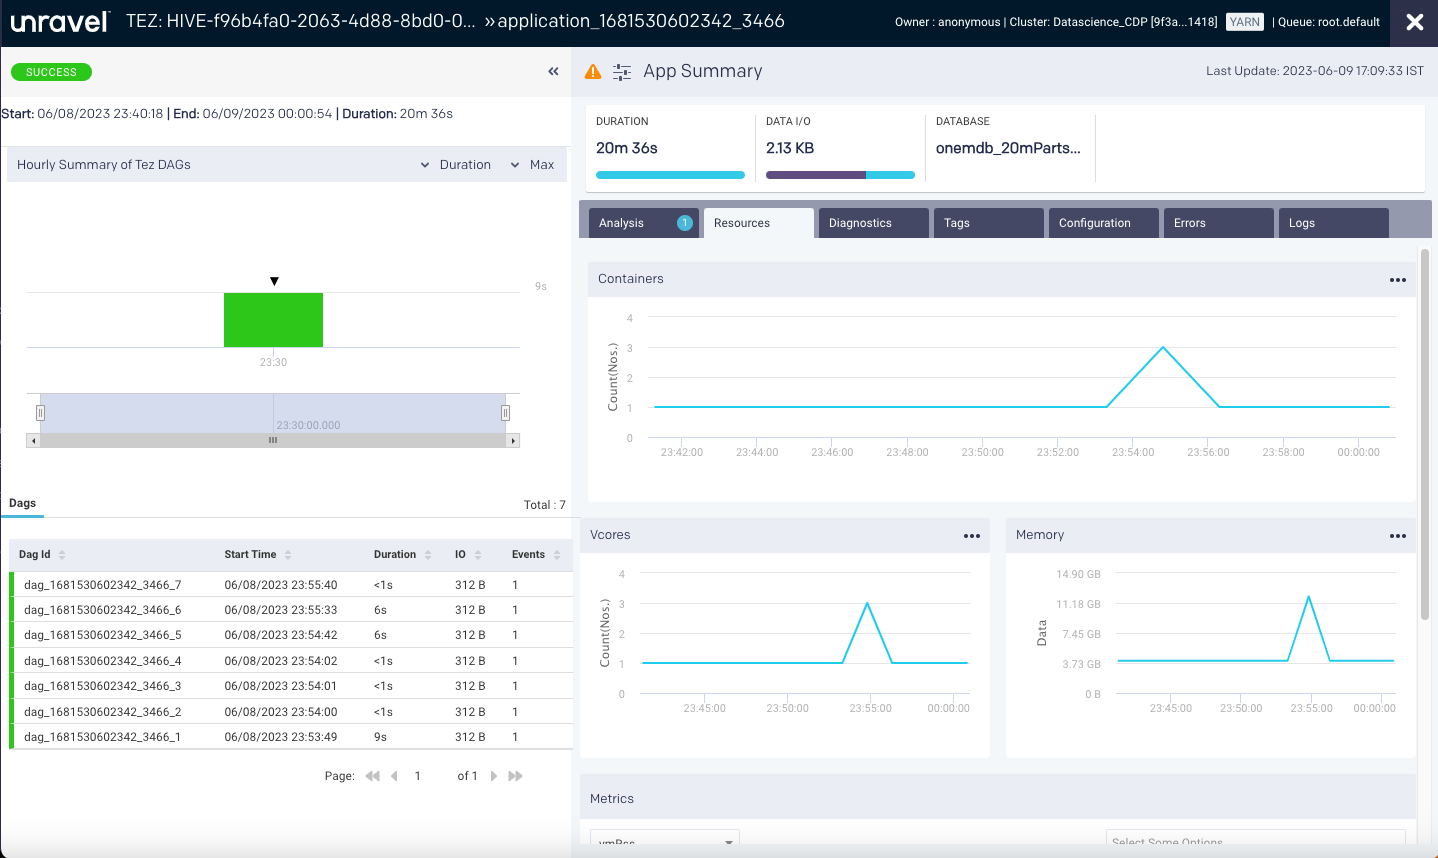
From the Tez details page, you can monitor the following KPIs of a hive query:
DAGs: Successful, failed, and killed DAGs on an hourly basis.
Duration: Total time taken by the query.
Data I/O: Total data read and written by the query.
Database: Name of the database.
Tez App details
When you open a Tez app details page, the following details of the application are displayed on the upper section of the Tez details page.

Item No. | Description |
|---|---|
1 | Name or ID of the Tez application. |
2 | Details of the Tez app owner, cluster ID, cluster name, and Queue. |
3 | Icons that indicate an issue or tuning suggestions for the Tez app. |
4 | Status indicator for the Tez app. Displays whether the app was successful, failed, or killed. |
5 | Start time of the application run. End time of the application run. Duration of the application run. |
6 | Indicates the navigation drill-down into each DAG. The DAG ID is displayed. You can click |
7 | Duration of the Tez application/Hive query Data input/output of the Tez app/Hive query Start time of the Hive query as indicated for each DAG. End time of the Hive query as indicated for each DAG. Link to the Hive query details. |
The following tabs are visible on the right section of the Tez details page:
The resources contain the following charts:
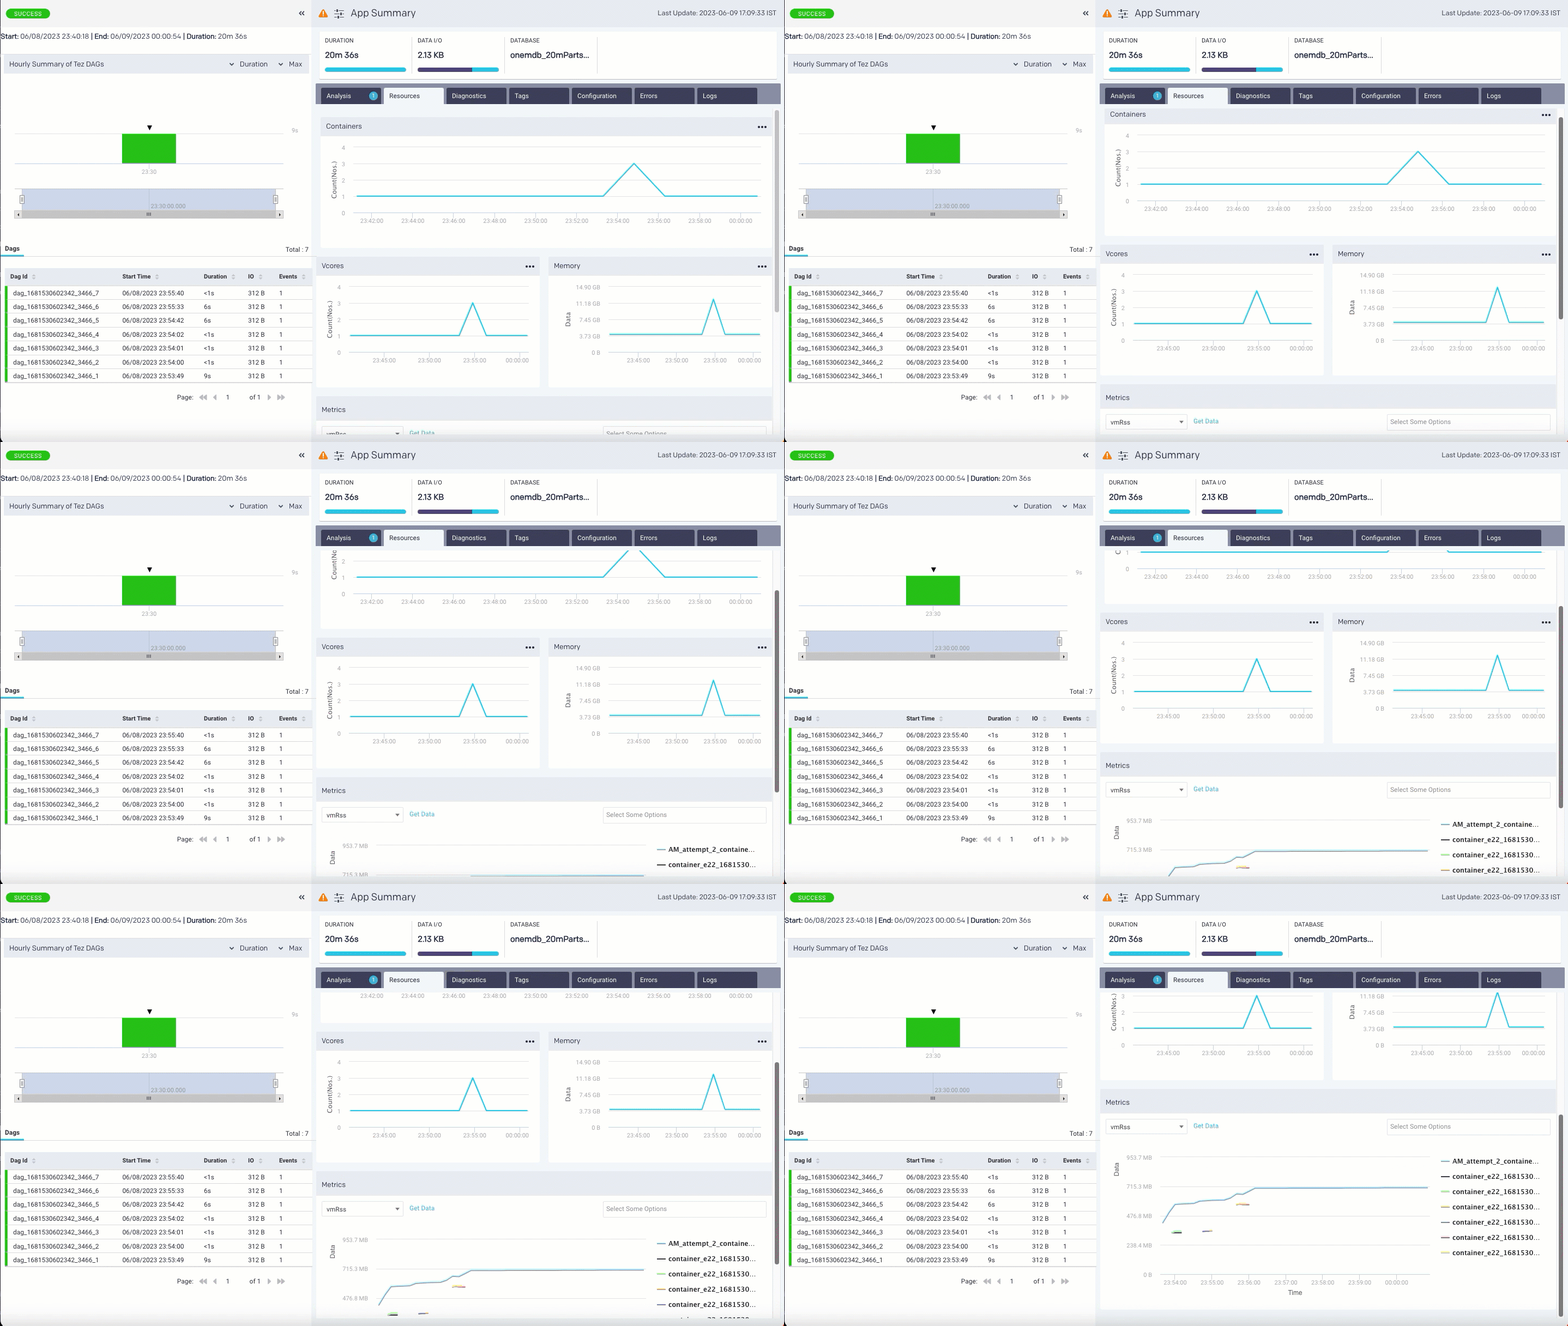
Containers: Graphs the number of containers used for the query execution in a Tez app.
vCores Graphs the vCores used for running the Hive queries in a Tez app.
Memory: Graphs the memory used for running the jobs.
Metrics: The details of the following metrics of the application are plotted in a graph:
OS Memory
CPU Utilization
Java Memory
Click Get Data to get the raw data of the graph.
Warning
The data on the Resources tab is populated for Tez applications if their duration is greater than or equal to 90 seconds. If the application duration is less than 90 seconds, then the data might not be populated for such applications, depending on the Resource Manager polling cycle.
This tab lists the diagnostics messages received from the Yarn resource manager.
Note
For failed or killed apps, check the Errors tab to view error messages.

This tab lists the tags used in the Tez application. Refer to Tagging.

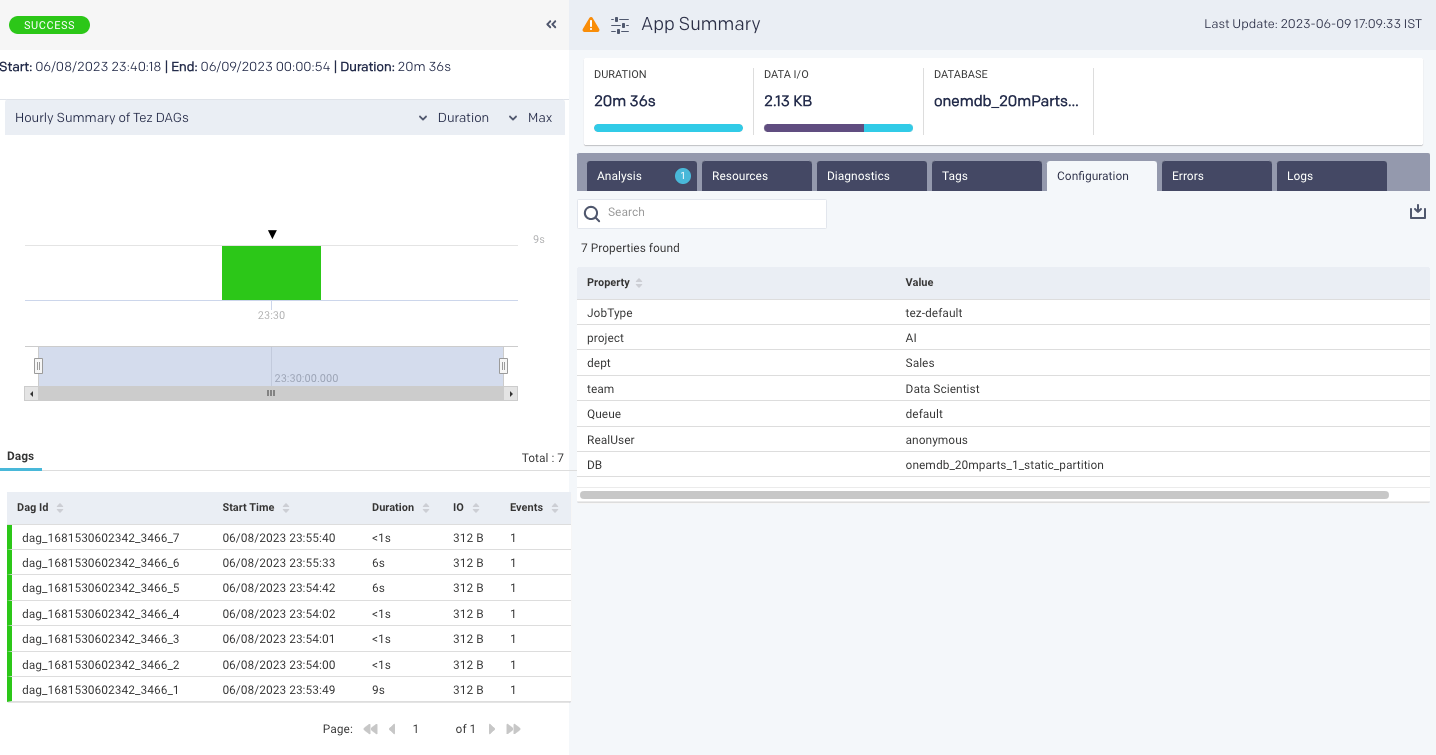
This tab lists all the configurations that are set for Hive queries.
This tab lists the errors that you encounter during the job run.
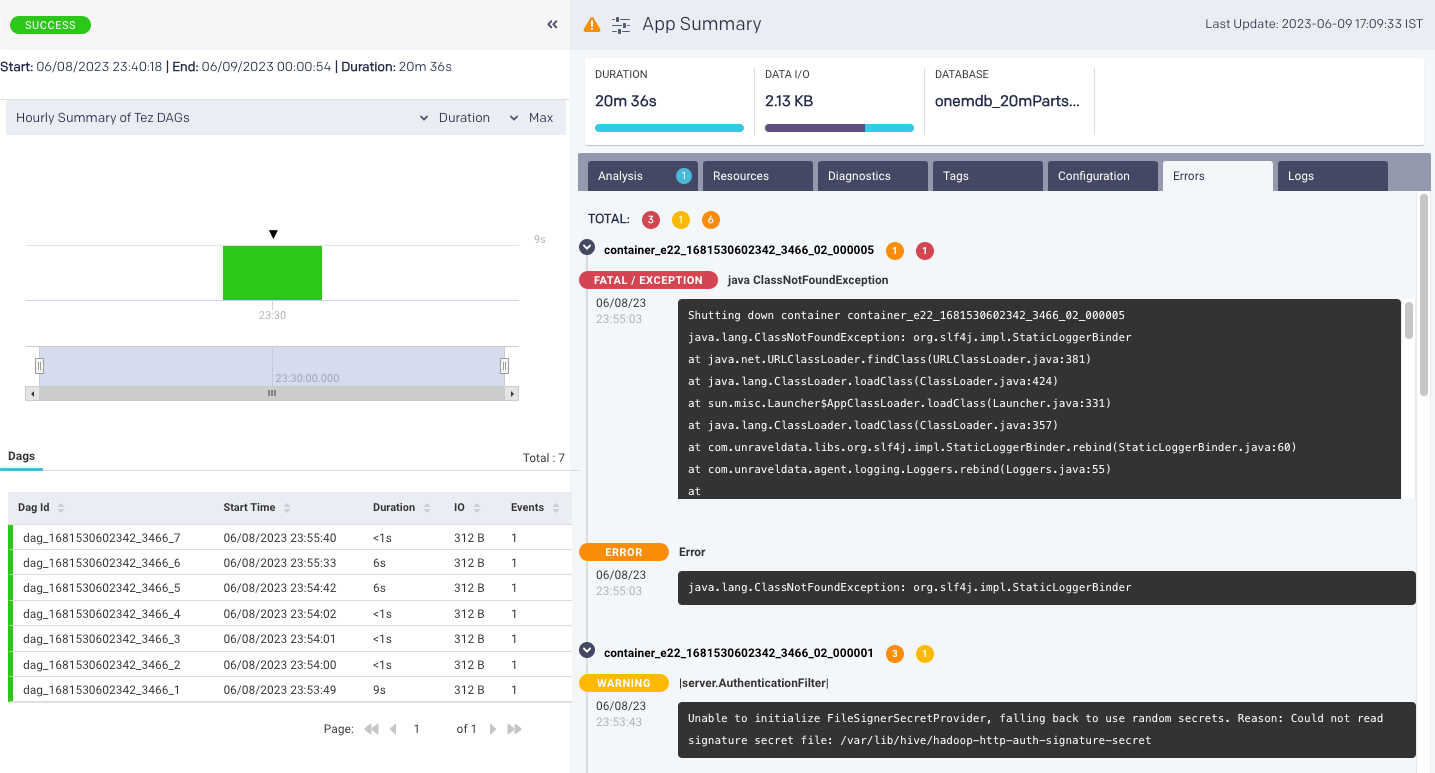
From this tab, you can view the logs.
On the right, a bar graph is shown, where each bar represents a one-hour aggregation of a batch of hive queries. To view the graph:
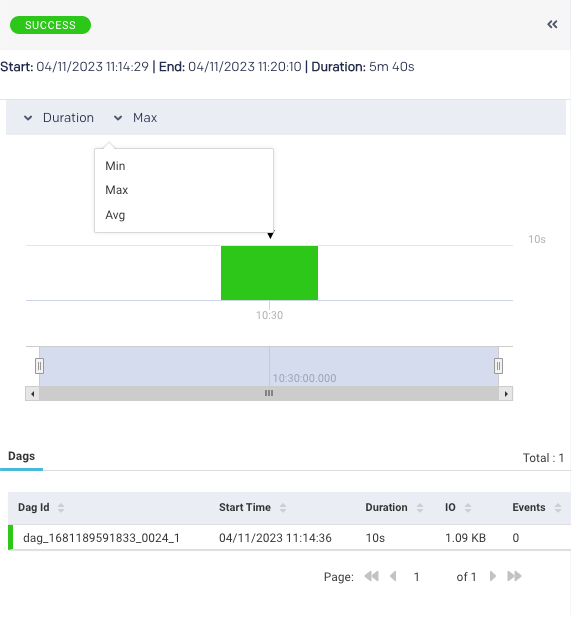
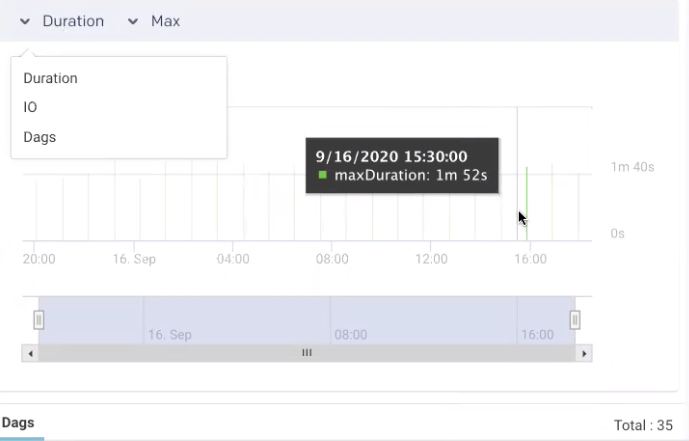
From the drop-down, select one of the following criteria for aggregation of the hive query batch:
Duration
I/O
DAGs
From the adjacent drop-down, select the type of aggregation:
Min
Max
Avg
Adjust the slider to an interval, and move it on the graph to view the trending bars of the hive queries in the timeline. By default, the slider is set to a default of one day with an interval of an hour.
DAG details
The following tabs are displayed on the right side when you open a Tez app details page:
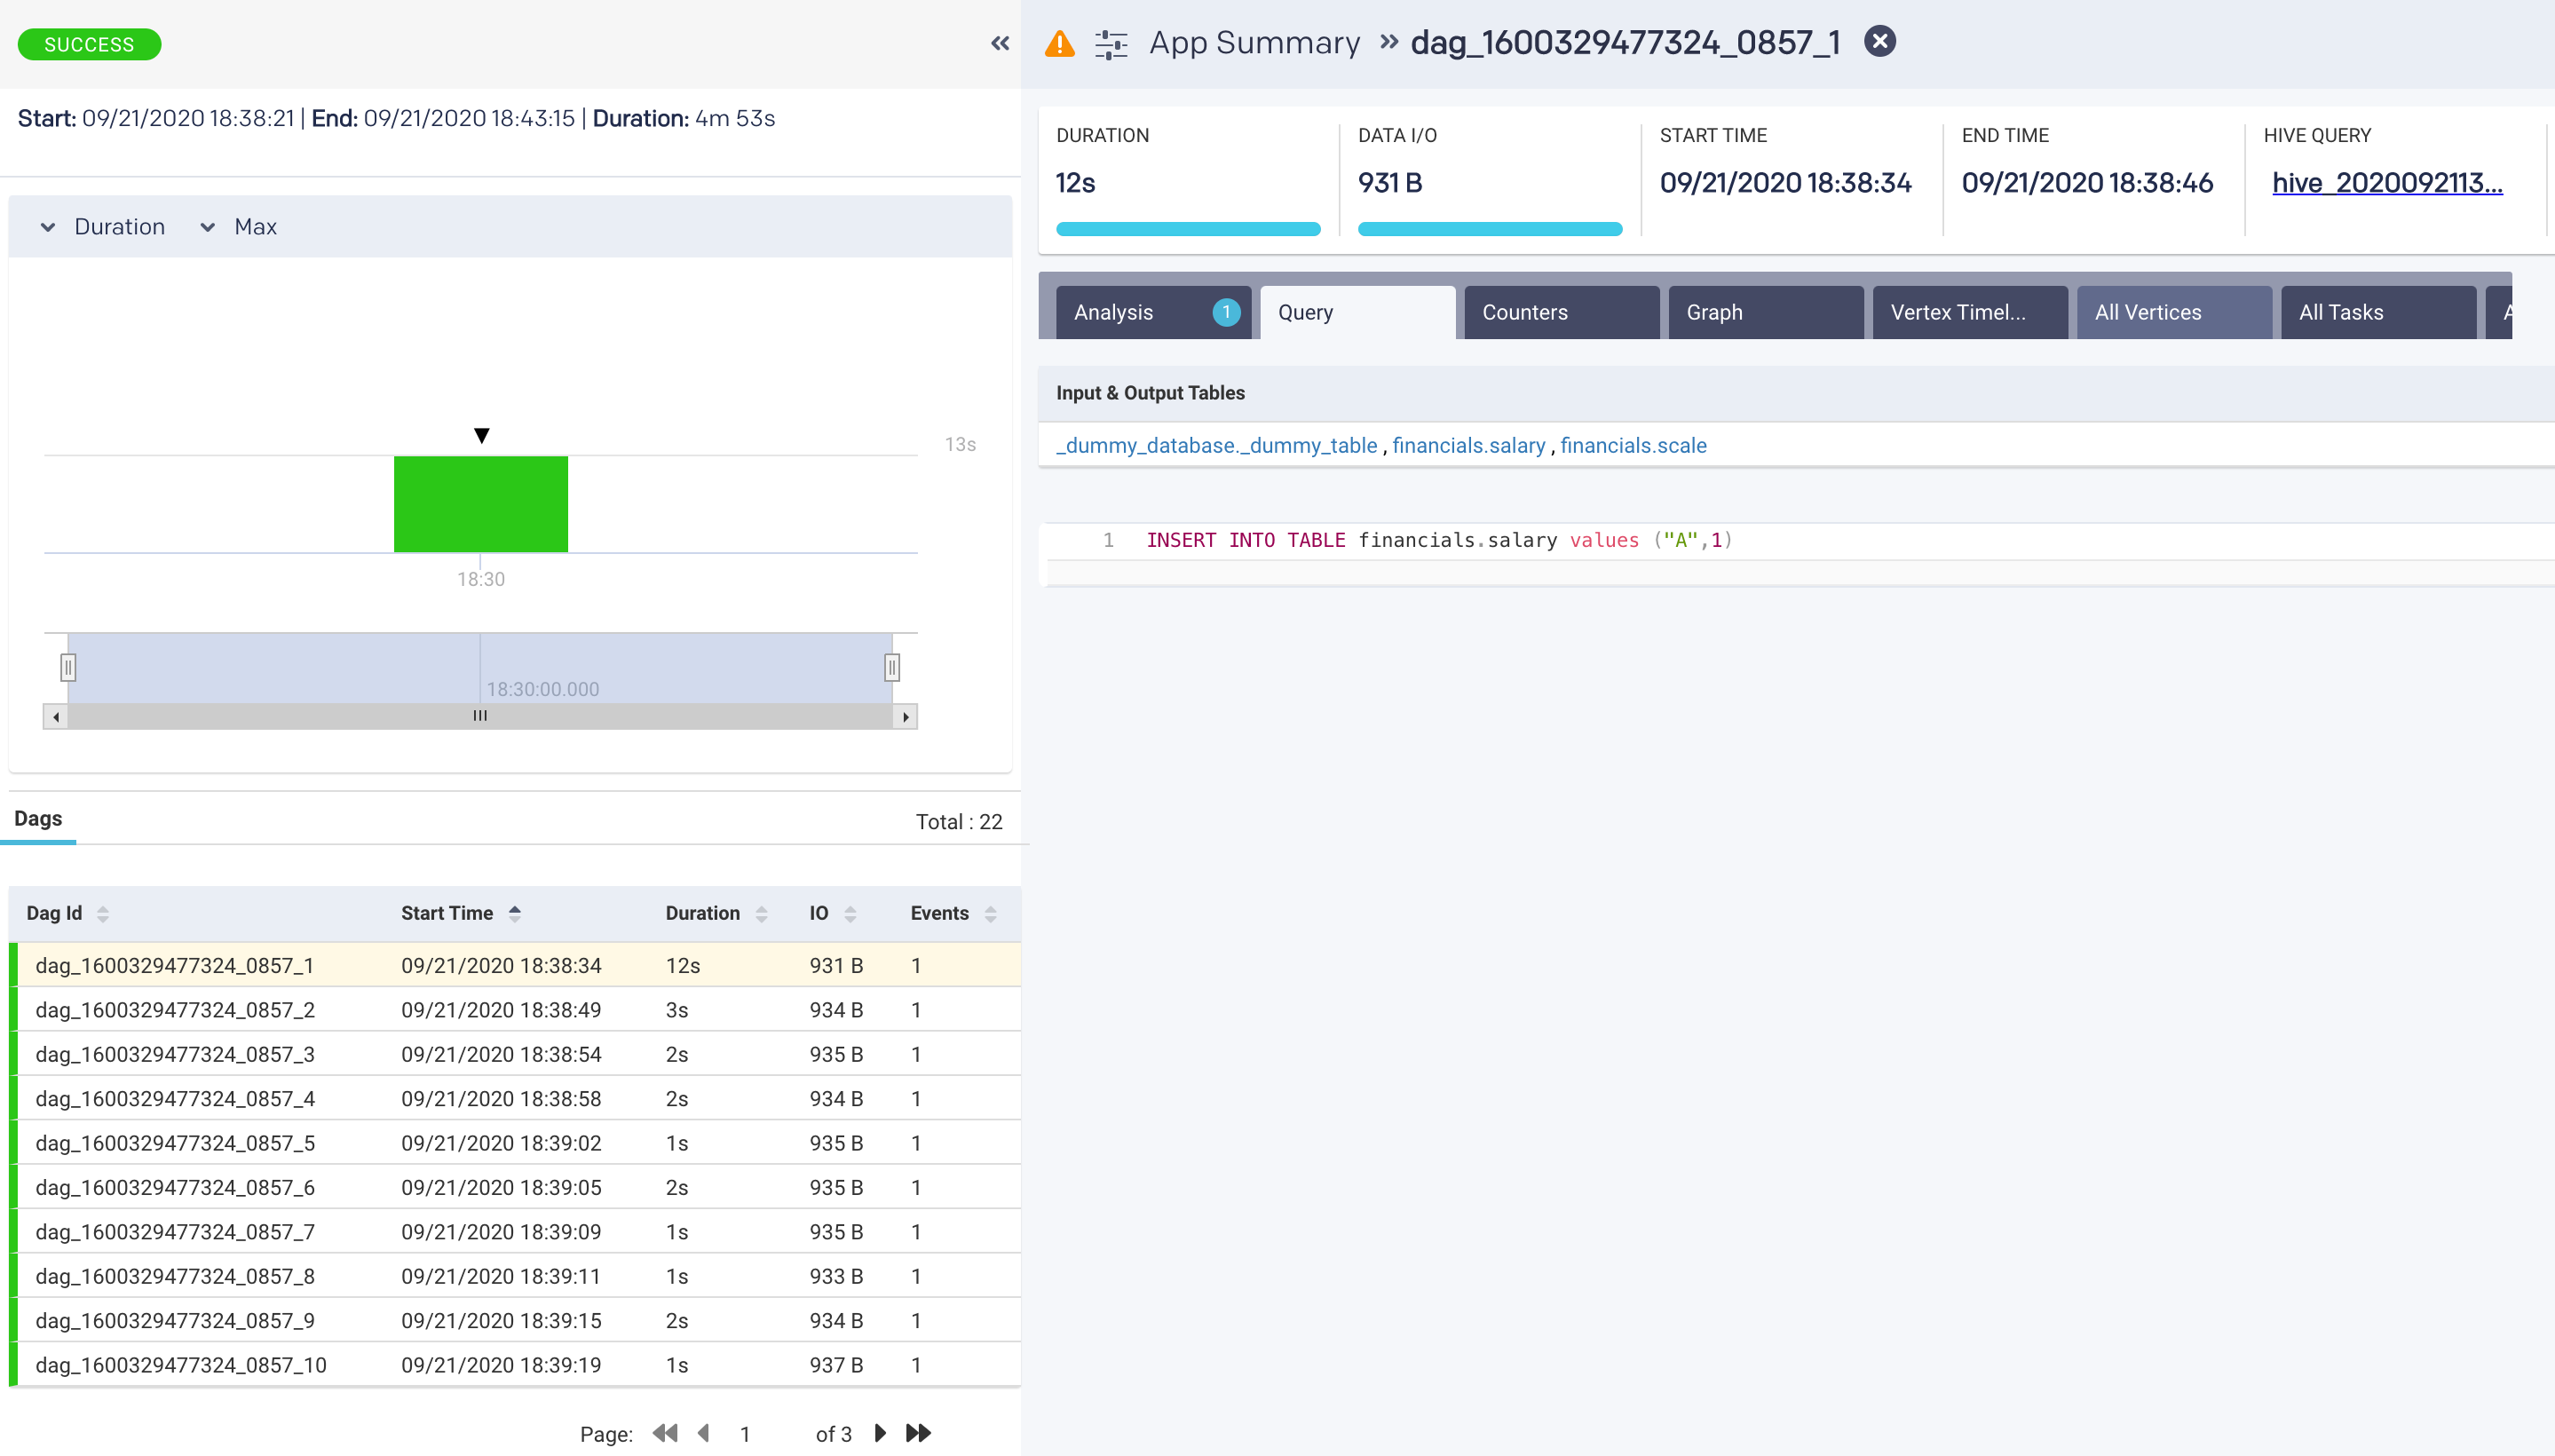
After the Hive queries graph, the list of DAGs is displayed. Each DAG represents a hive query. Select a DAG, and the following tabs are shown on the right with extensive details about the query:
This tab displays the same information as the Analysis tab for the app; however, here, this analysis is done for an individual hive query.
Displays the complete hive query that was run.
This tab is displayed when there is an error during the query run or when the query fails or is killed. The corresponding error messages are displayed from this tab.

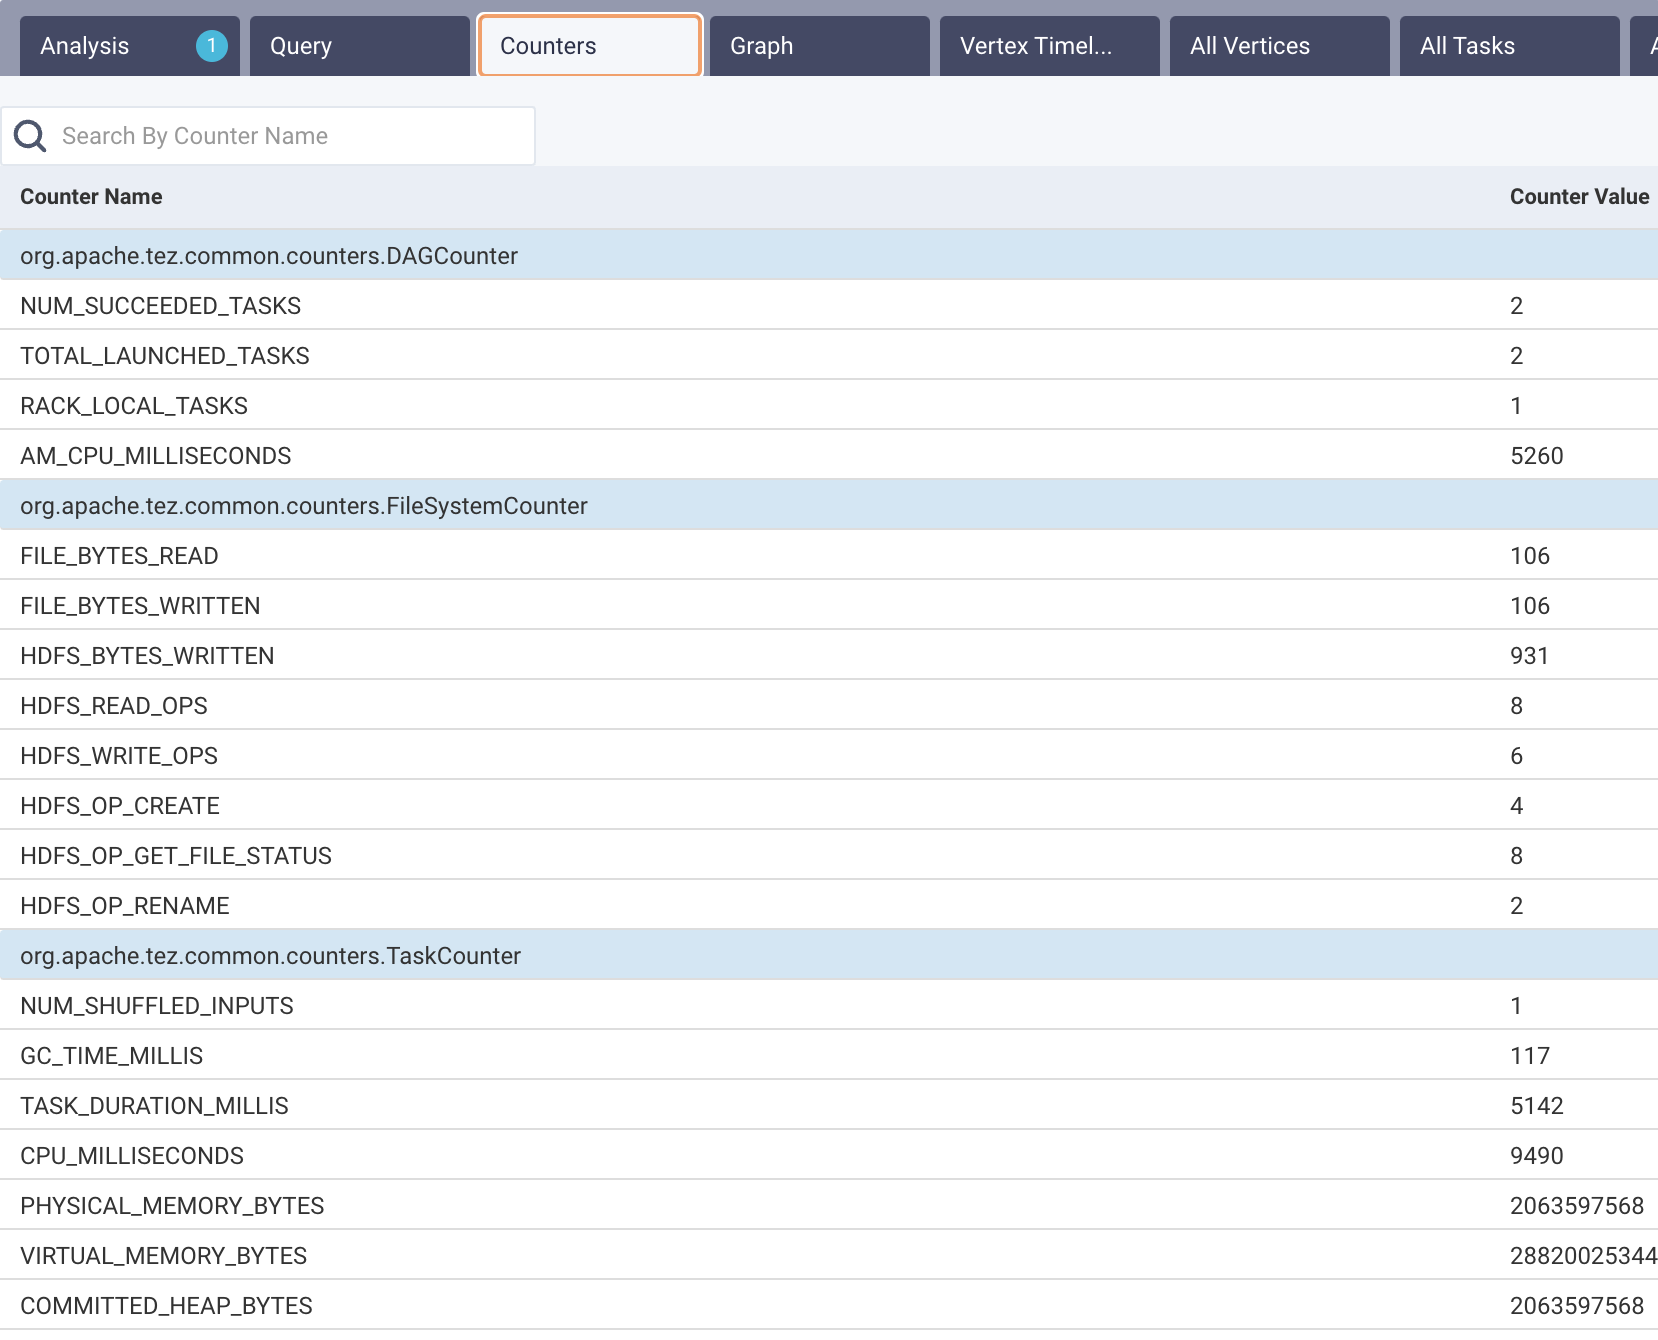
The DAG metrics and their corresponding values are listed in this tab.
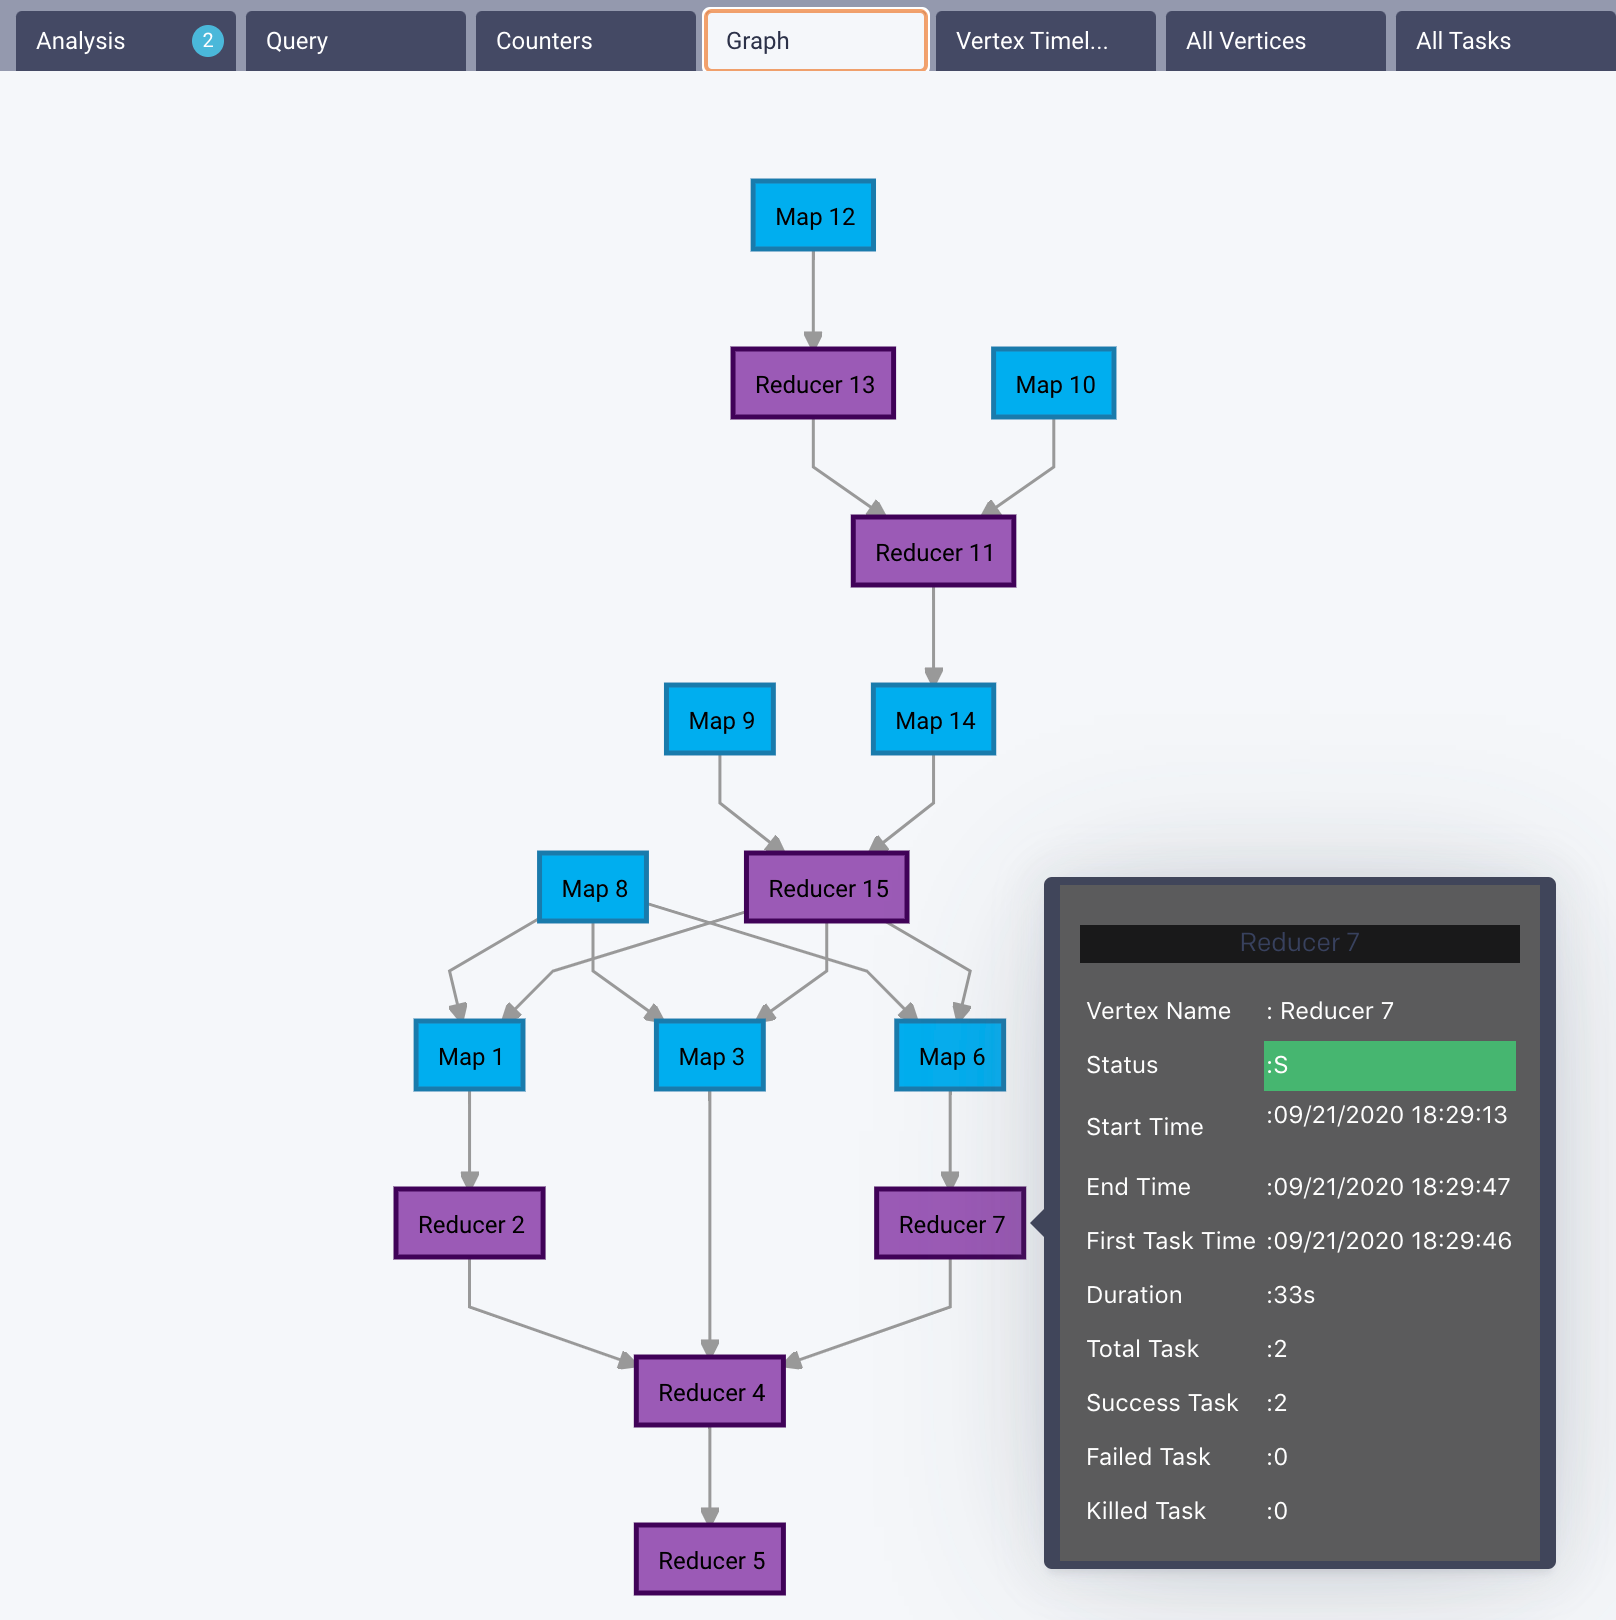
The graph represents how the query processes were organized and how the query was run. This is shown with vertices and their relationship with each other. Click a vertex, and the task details are displayed.
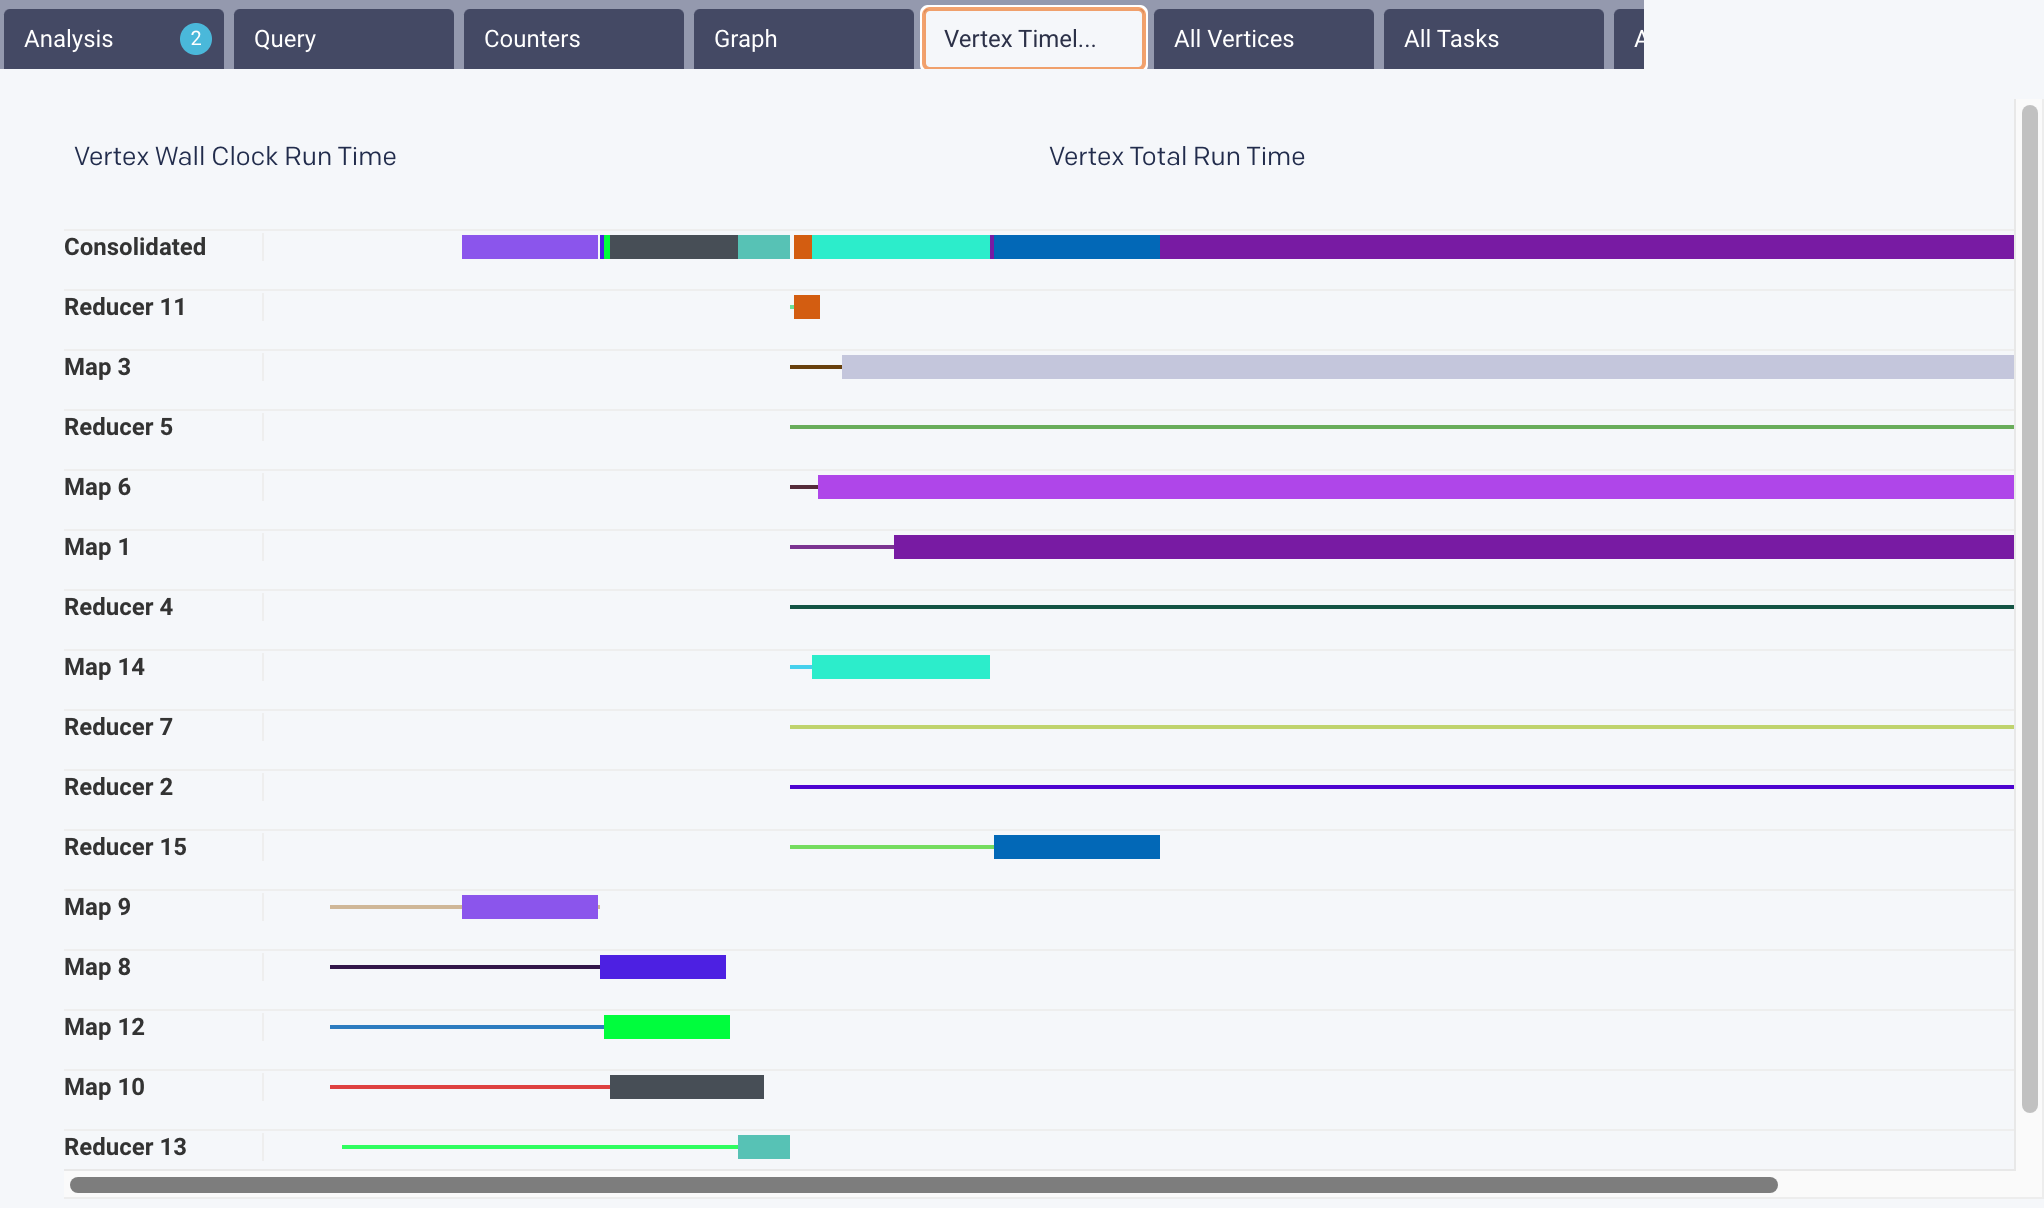
Displays the timeline for all tasks. The task time can be displayed in both Wall Clock time and Total Run time. Hover over the task to display the information in the text.
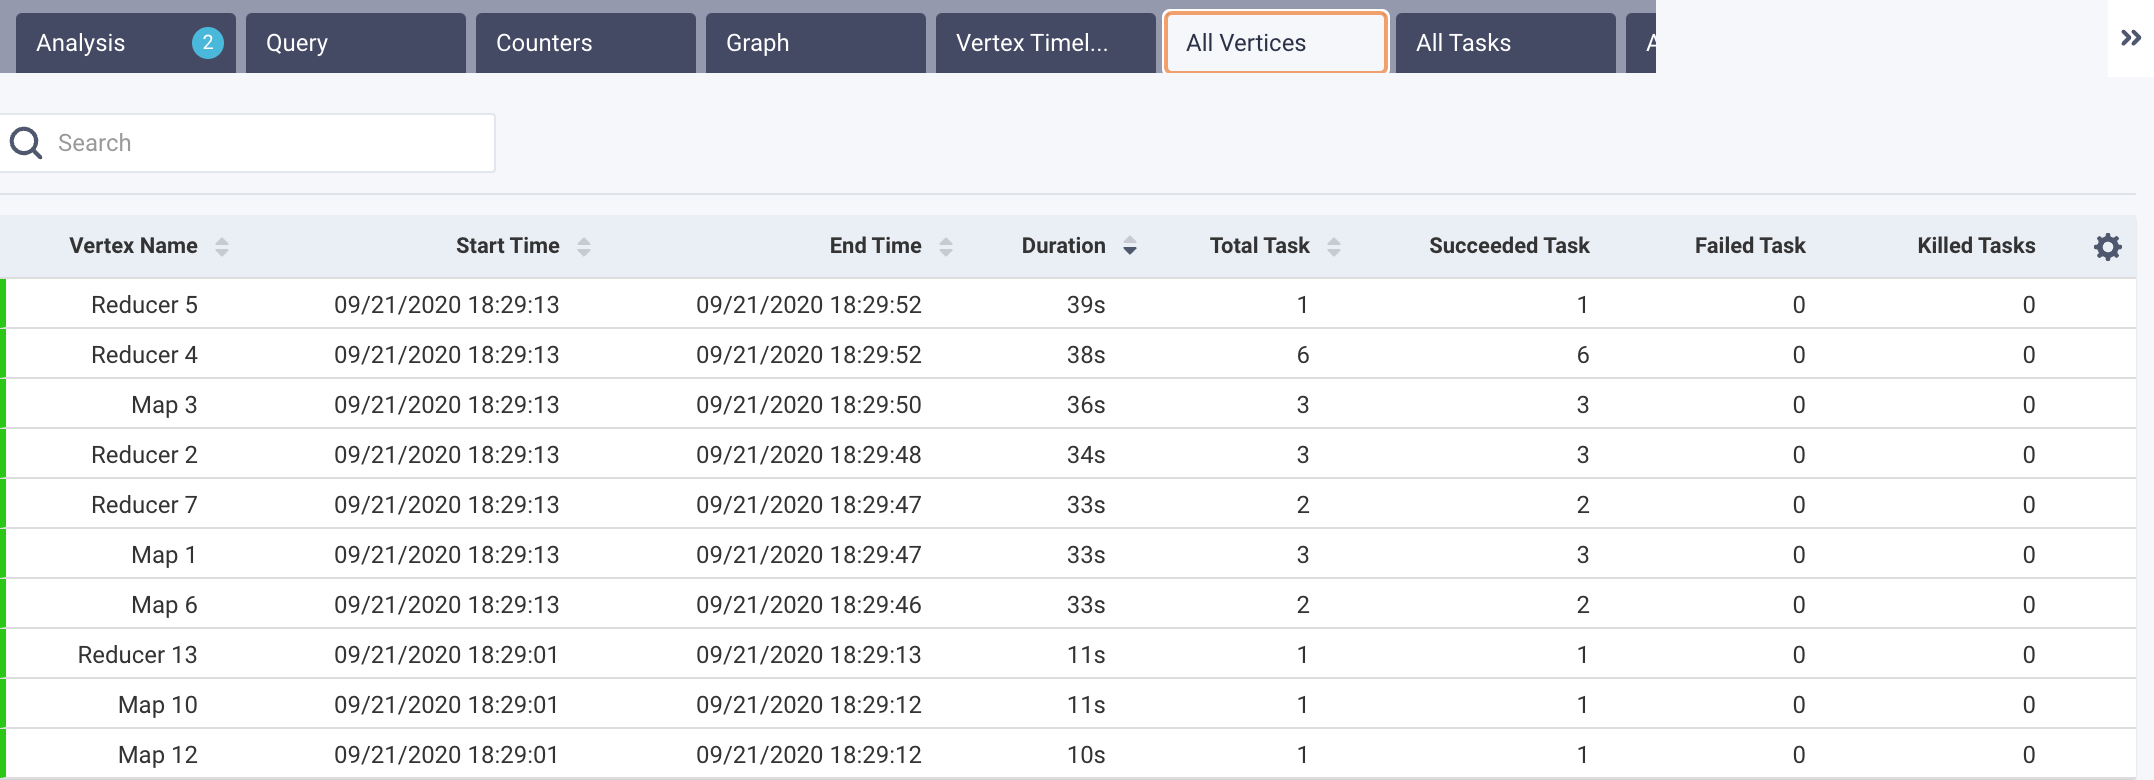
List each vertex, the start and end time of each vertex, the duration of the run, the total task in a vertex, and the corresponding successful, failed, and killed tasks. You can use the search box to search the vertices.
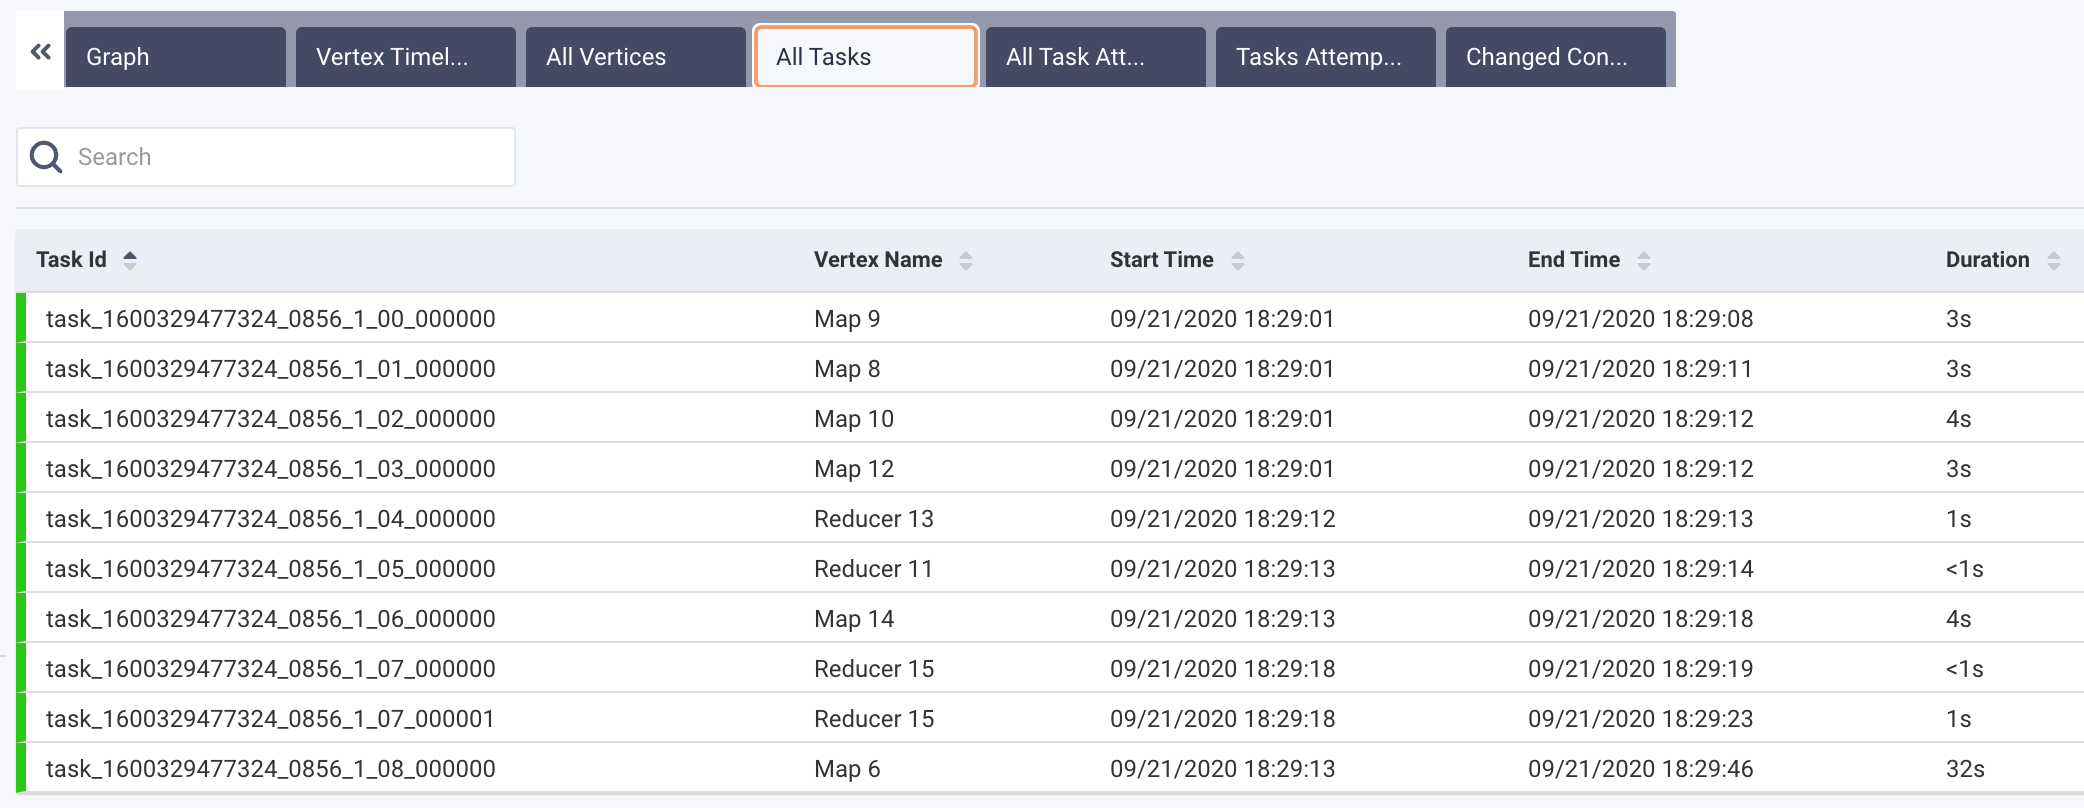
Lists all tasks, their status (failed, success, etc.), the corresponding vertex name, the start and end of the task, and the duration of each task. The tasks are searchable by Task ID and Vertex name; Tasks containing the string will be displayed.
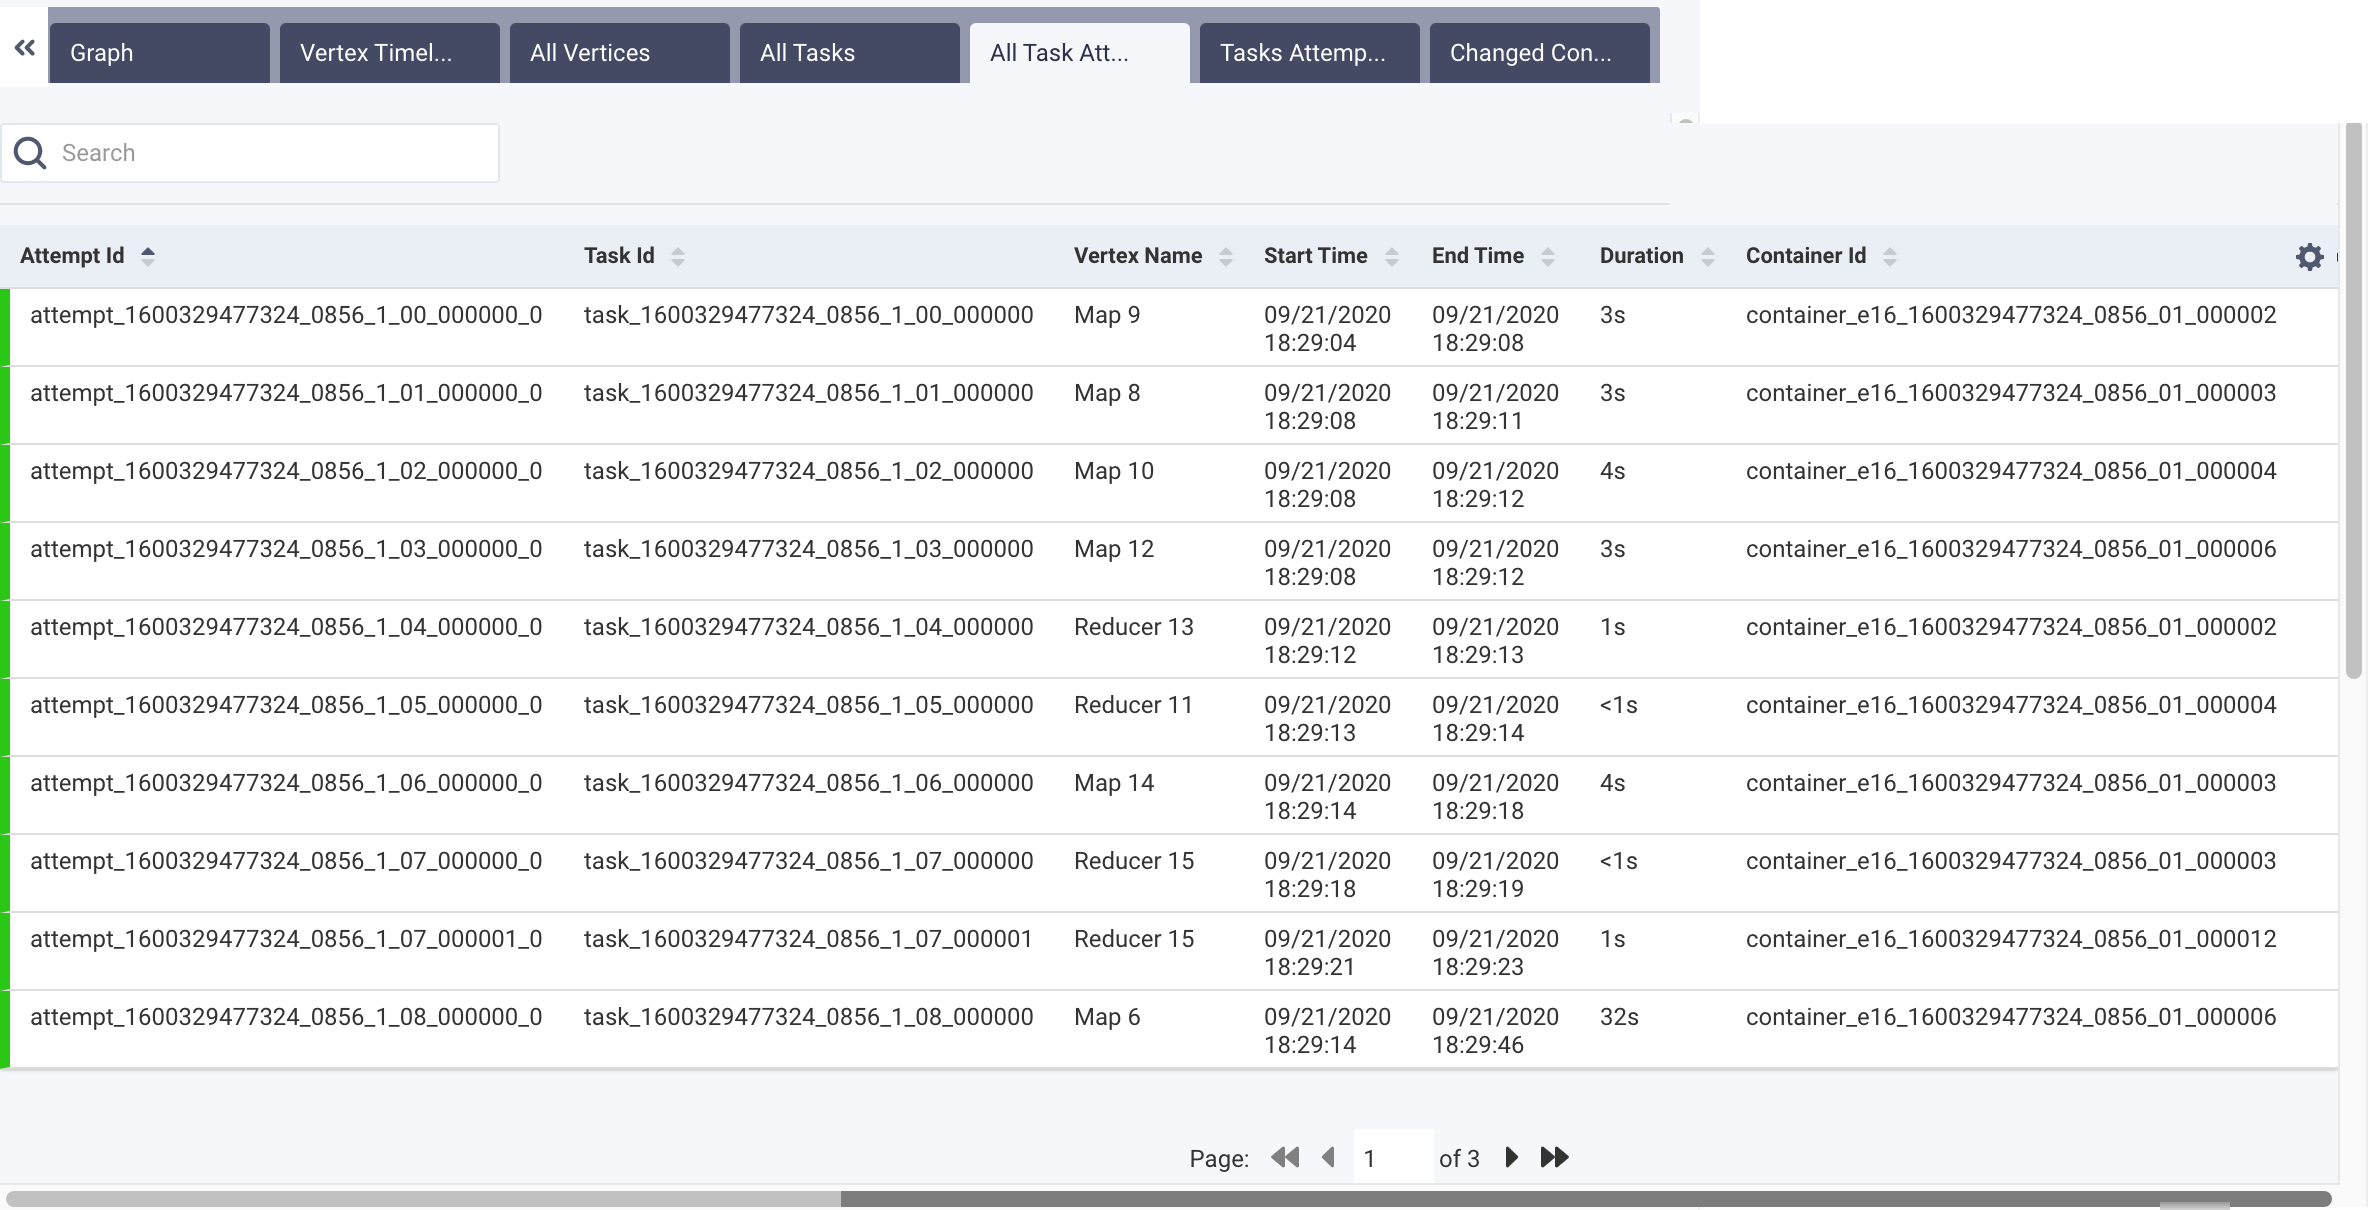
List all attempts, their status (failed, success, etc.), vertex name, and other relevant information. The task attempts are searchable by Attempt ID, Task ID, and Vertex name; Task attempts containing the string will be displayed.
Graphically and textually note the number of task attempts and their status. The donut graphs show the percentage of successful (green), failed (orange), and killed (red) tasks.

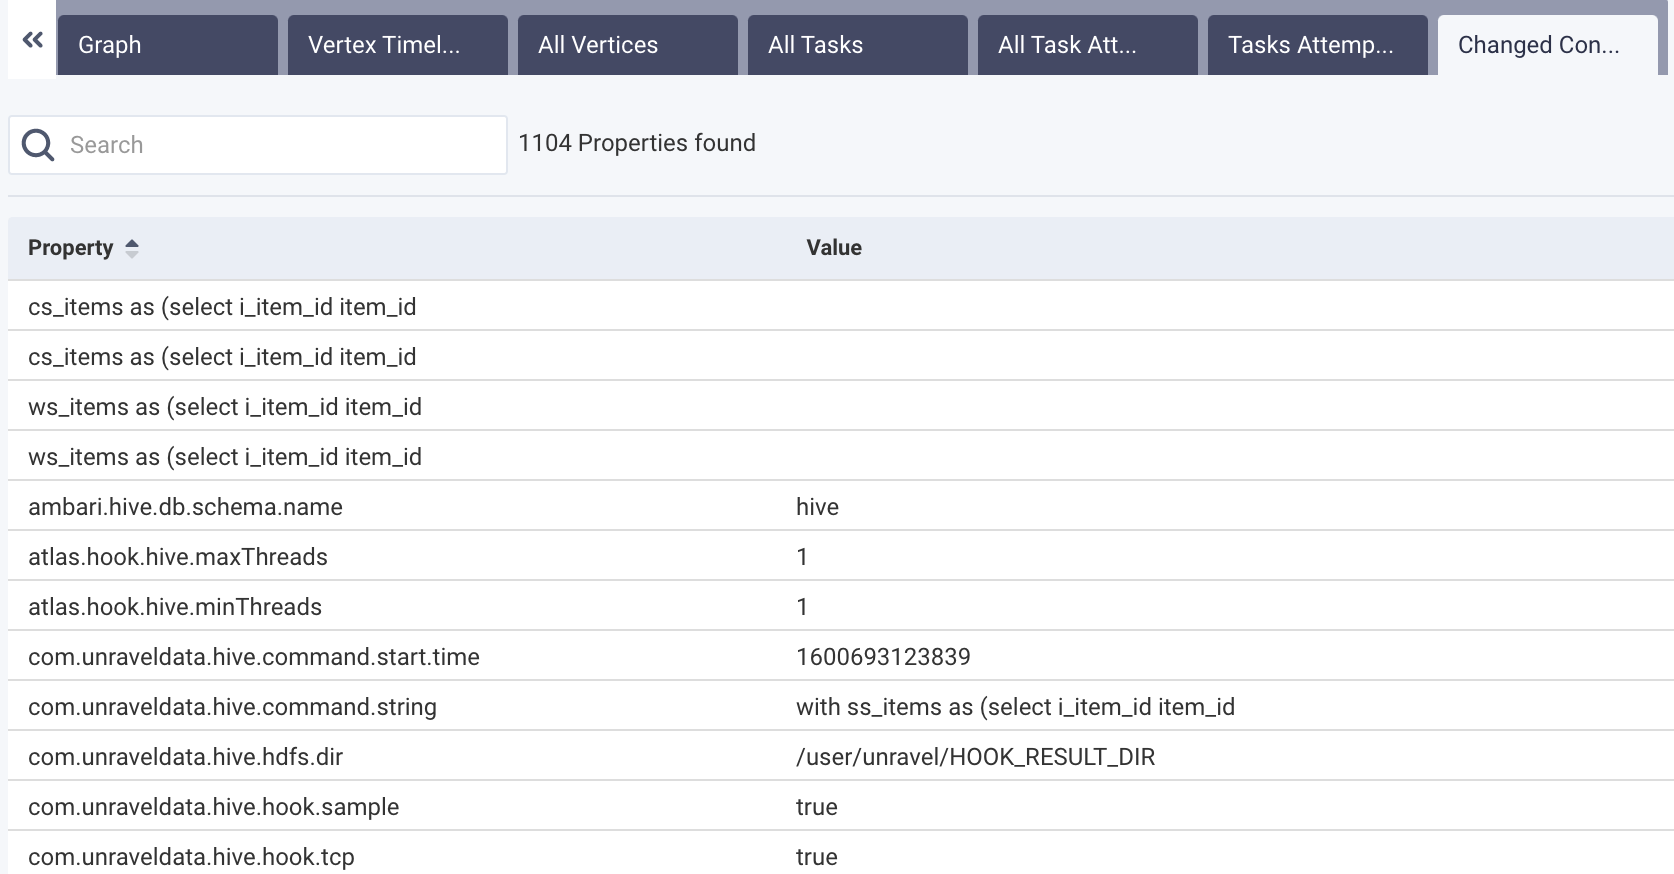
Lists all the configurations that were changed while running the hive query, along with their corresponding values.
