Migration Planning
Overview
One of the more challenging aspects of optimizing the resources in your Hadoop cluster is determining how to migrate your on-prem cluster to the cloud to save money, reduce maintenance, and increase your agility. Migration Planning helps you to understand your current cluster's configuration, its current usage and then helps you plan your migration.
CLUSTER DISCOVERY analyzes your on-prem cluster usage, workload patterns, and your hosts' hardware configuration.
CLOUDING MAPPING estimates the cost of moving to the cloud. Unravel analyzes two (2) migration strategies by cloud provider (Amazon, Azure, and Google).
Lift and Shift is a one-to-one mapping of each existing host’s capacity (based on CPU, memory, and disk) to the closest fit on the cloud that meets or exceeds the host's hardware specs. This method provides an estimate of what your current on-prem cluster configuration would cost on the cloud. It does not consider workload or actual resource usage. You are not likely gain the cost savings the cloud can provide; but it minimizes your risks associated with migrating to the cloud
Cost Reduction is a-one-to-one mapping of each existing host’s actual usage (based on CPU, memory, and disk) to the closest fit on the cloud that meets or exceeds the host's usage requirements. While still a one-to-one mapping, this method is usually more cost effective than lift and shift as it minimizes over-provisioning (the under-utilization of your host's resources). This method optimizes for cost but not necessarily peak-usage. If your on-prem hosts are under-utilized this method is usually less expensive than lift and shift.
Services and versions compatibility compares what is on your cluster and determines if the cloud product has a compatible version.
The reports are generated based upon an analysis of your cluster workload over a specific date range. You can:
Analyze on-prem clusters running:
Ambari running HDP 2.5 - 2.6.
Cloudera Manager running CDH 5.
Examine the costs of running your clusters on:
Prior to Unravel 4.5.3.0 only a subset of the these cloud services are available
Google Compute Engine (IaaS)
Google DataProc
Amazon EC2 (Iaas)
Amazon EMR
Azure (Iaas)
Azure HDInsight
Limitations
Migration Planning has not been thoroughly tested for clusters running Kerberos.
Your cluster must have at least seven days of metrics for Unravel to generate useful reports.
Clusters running MapR Control System are not supported.
Note
In order to use Cloud Reports you must have OnDemand installed, and set the cluster manager properties.
See here for common features used throughout Unravel's UI.
 |
Migration Planning contains three (3) tabs.
CLUSTER DISCOVERY is a dashboard containing detailed information about your on-prem cluster.
CLOUD MAPPING PER HOST generates a report organized by host and shows the details of each host and the cloud instance it was mapped to. As of Unravel 4.5.3.0 the information in the CLOUD MAPPING PER INSTANCE tab has been merged into this tab.
SERVICES AND VERSIONS COMPATIBILITY: maps the services on your cluster to either Google DataProc, Amazon EMR, and Azure HDInsight, and determines what services are both available and compatible on the cloud product.
Cluster discovery
The dashboard provides overall information about your cluster and has six tiles.
On-Prem Cluster Identity which contains the cluster configuration details and host information.
Overall cluster usage graphs of
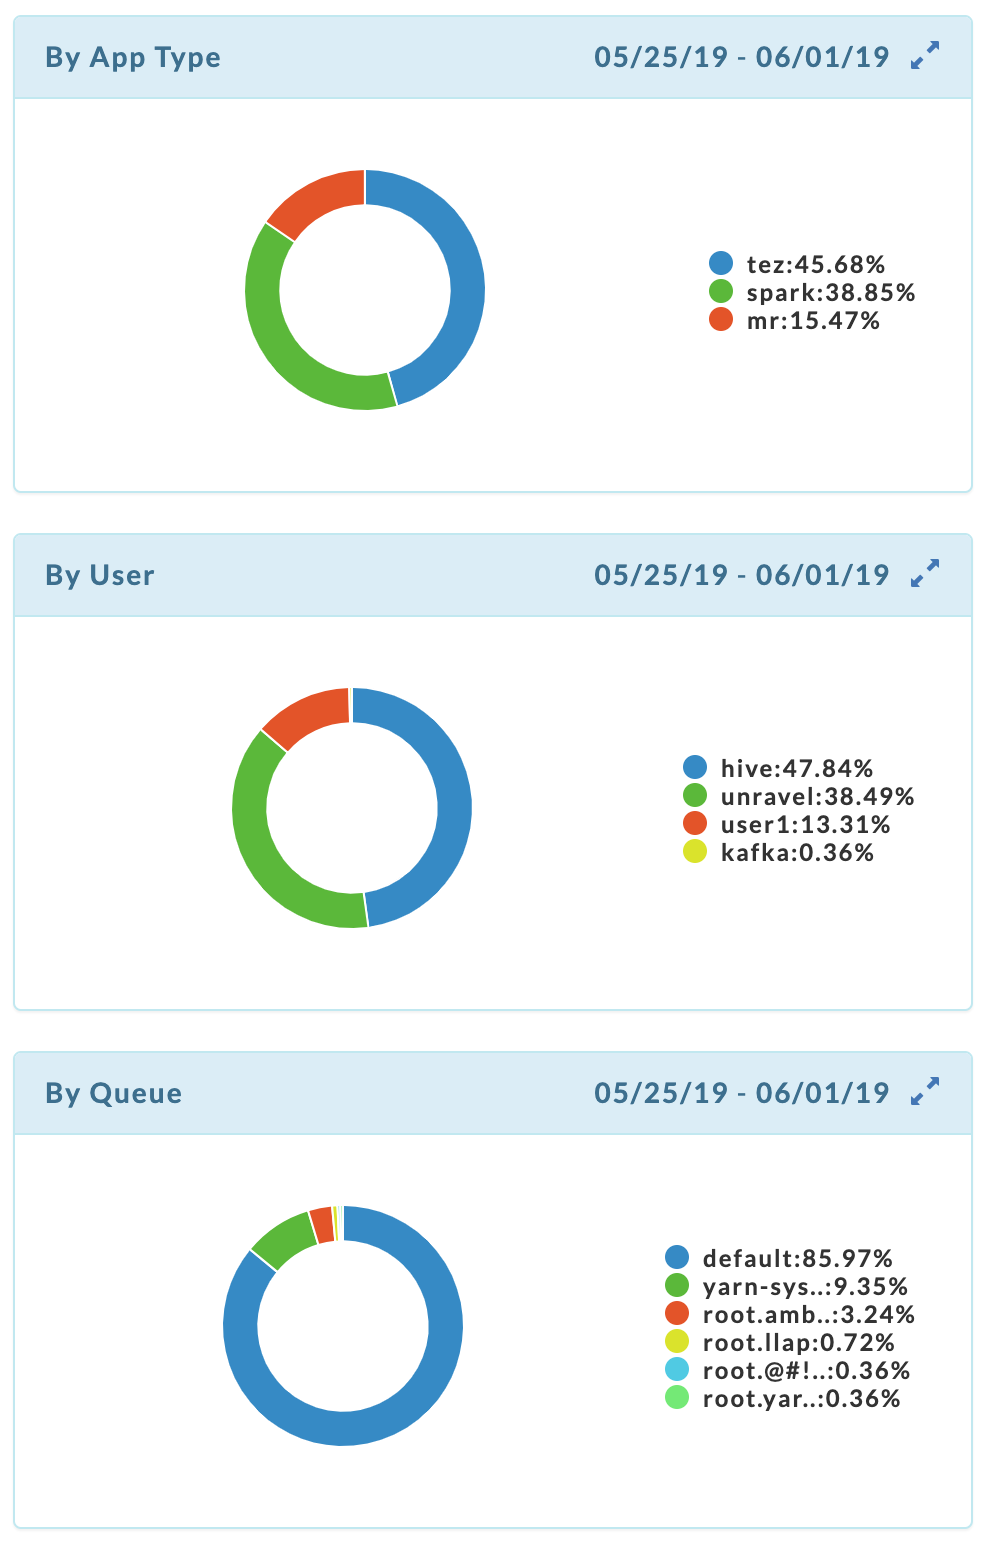
Applications submitted By App Type, By user, and By queue.
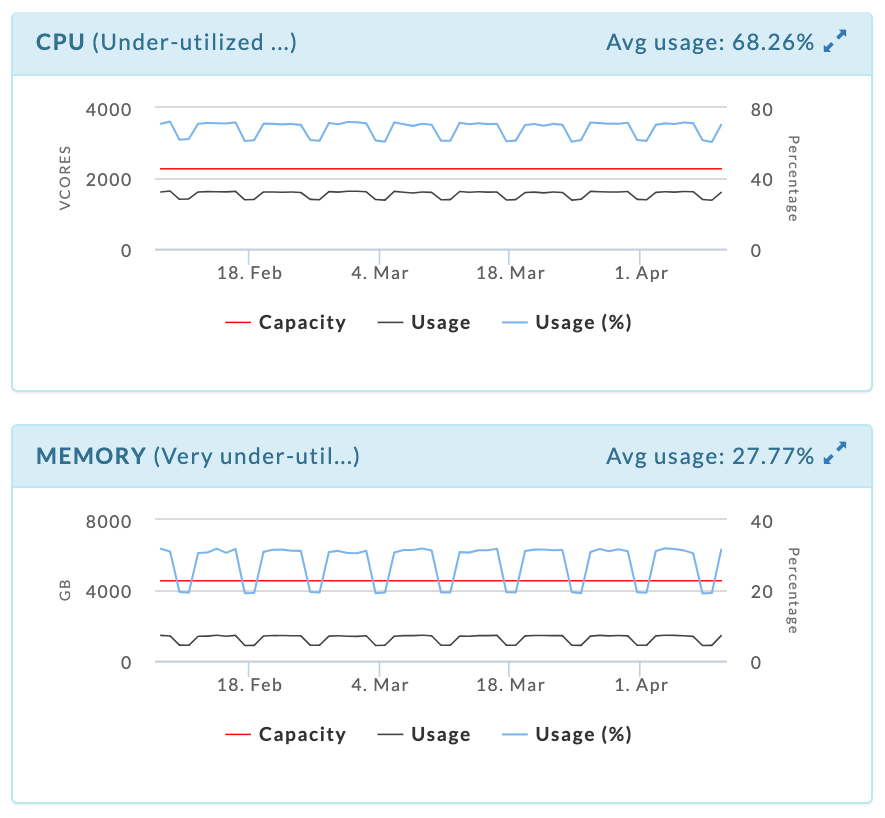
CPU.
Memory.
A CPU/MEMORY heatmap that aggregates usage by weekday, and then hour within the day.
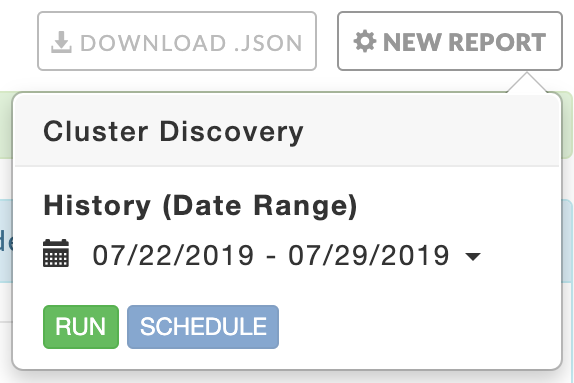
Click NEW REPORT to generate the report. Select your History (Date Range). Before the initial report generation, the default is a seven (7) day history. Click RUN; RUNNING replaces RUN and countdown is displayed until Unravel starts collecting the data. A dark green bar banner is briefly noting the report has started. NEW REPORT pulsates blue until the report is completed.
 |
If the report has been generated NEW REPORT remains blue, a light green bar notes the success, and the page is populated with the new data. If report generation was unsuccessful, a red bar containing an error message is displayed. The NEW REPORT button becomes orange and remains so until a report is successfully generated. The tab continues to show the last successfully generated report. All successful reports are archived. Click DOWNLOAD JSON to download the report.
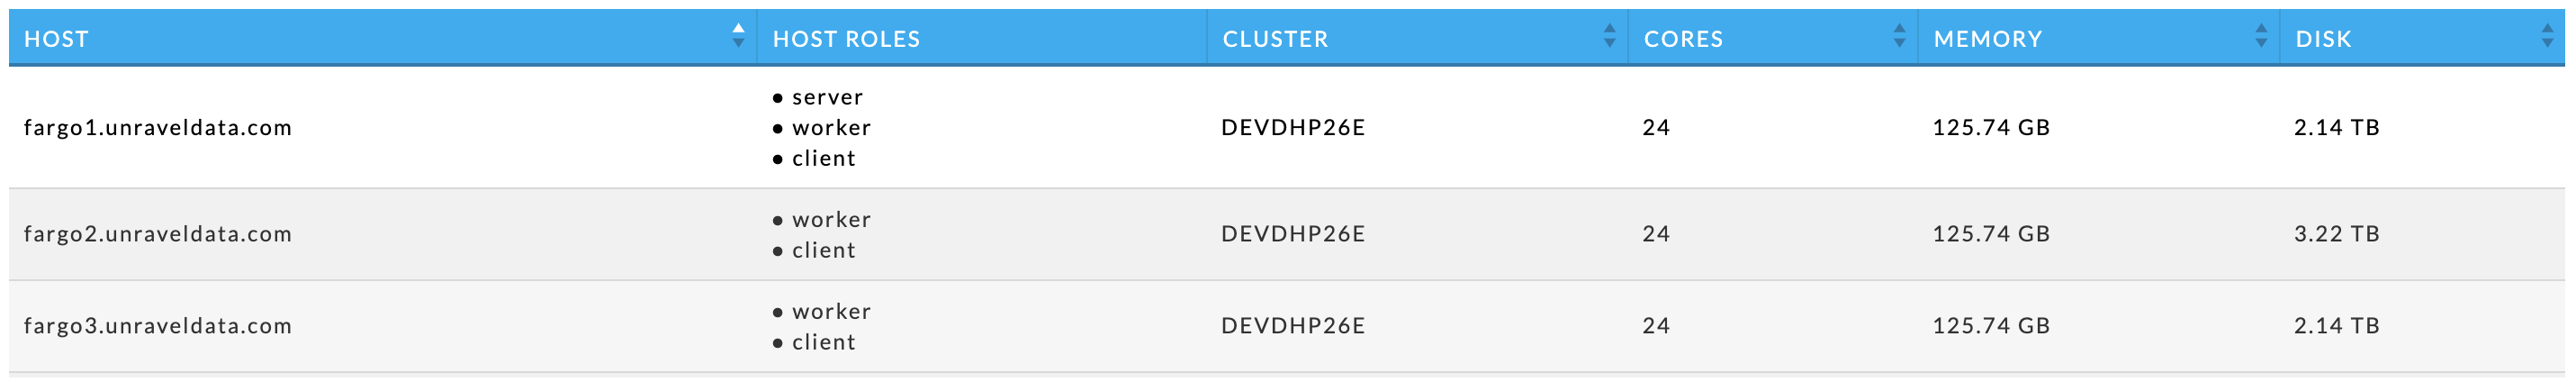
This tile contains information about your cluster, including the hosts. The Host Summary section show the cluster's capacity across all hosts.
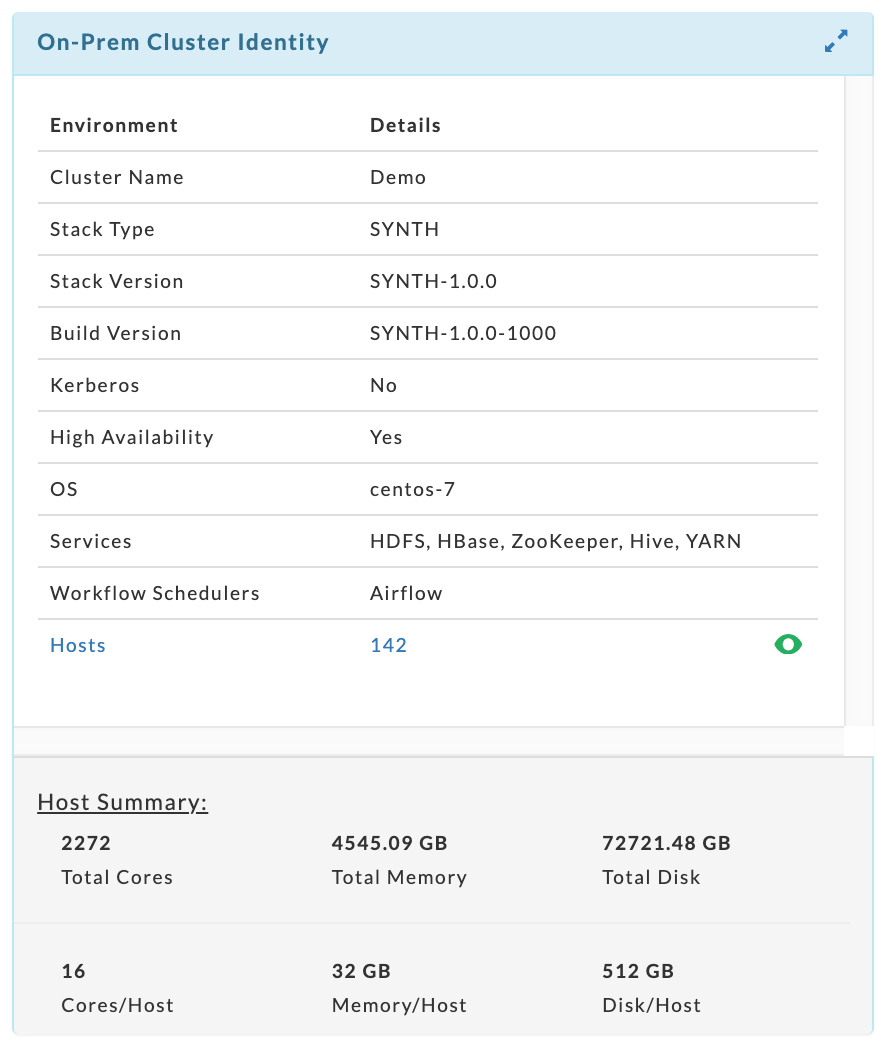 |
Click on the  table to list each host's hardware specifications. The table can be searched on host name.
The donut graphs display the top ten (10) for each category. The example below shows there were only three (3) app types, four (4) users, and six (6) queues over the period analyzed.
 |
The first two (2) graphs show the cluster's CPU and memory utilization over the time period. The average usage is listed on the right-hand side of the tile bar. Hover over the parenthetical text next to the resource's name to see Unravel's analysis of your cluster's usage for that resource. Below, the CPU is "Under-utilized and over-provisioned", while the MEMORY is "Very under-utilized and over-provisioned".
 |
The heatmap shows the CPU/MEMORY usage and capacity by a weekday and hour, e.g., Monday between 5 and 6 a.m. You can filter the heatmap by CPU or memory. It opens displaying CPU usage.
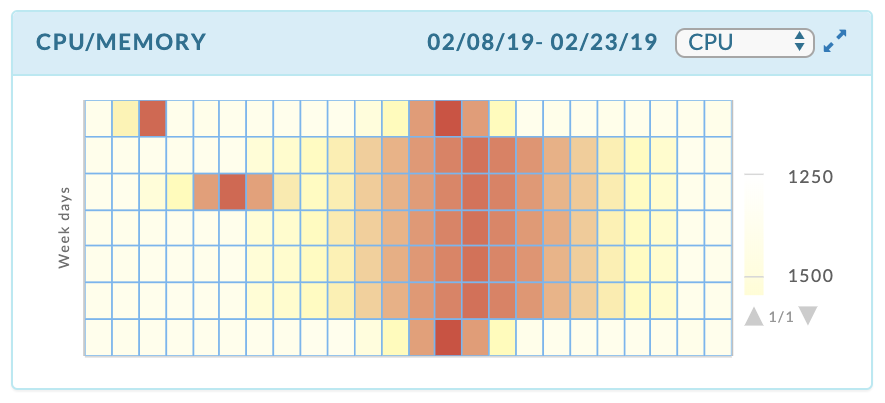 |
Each time slot is color coded to show how relatively hot the time slot is relative to the rest of the map. You can quickly see the load distribution across your cluster. The CPU graph noted the CPU is under-utilized and the heatmap graphically supports Unravel's analysis.
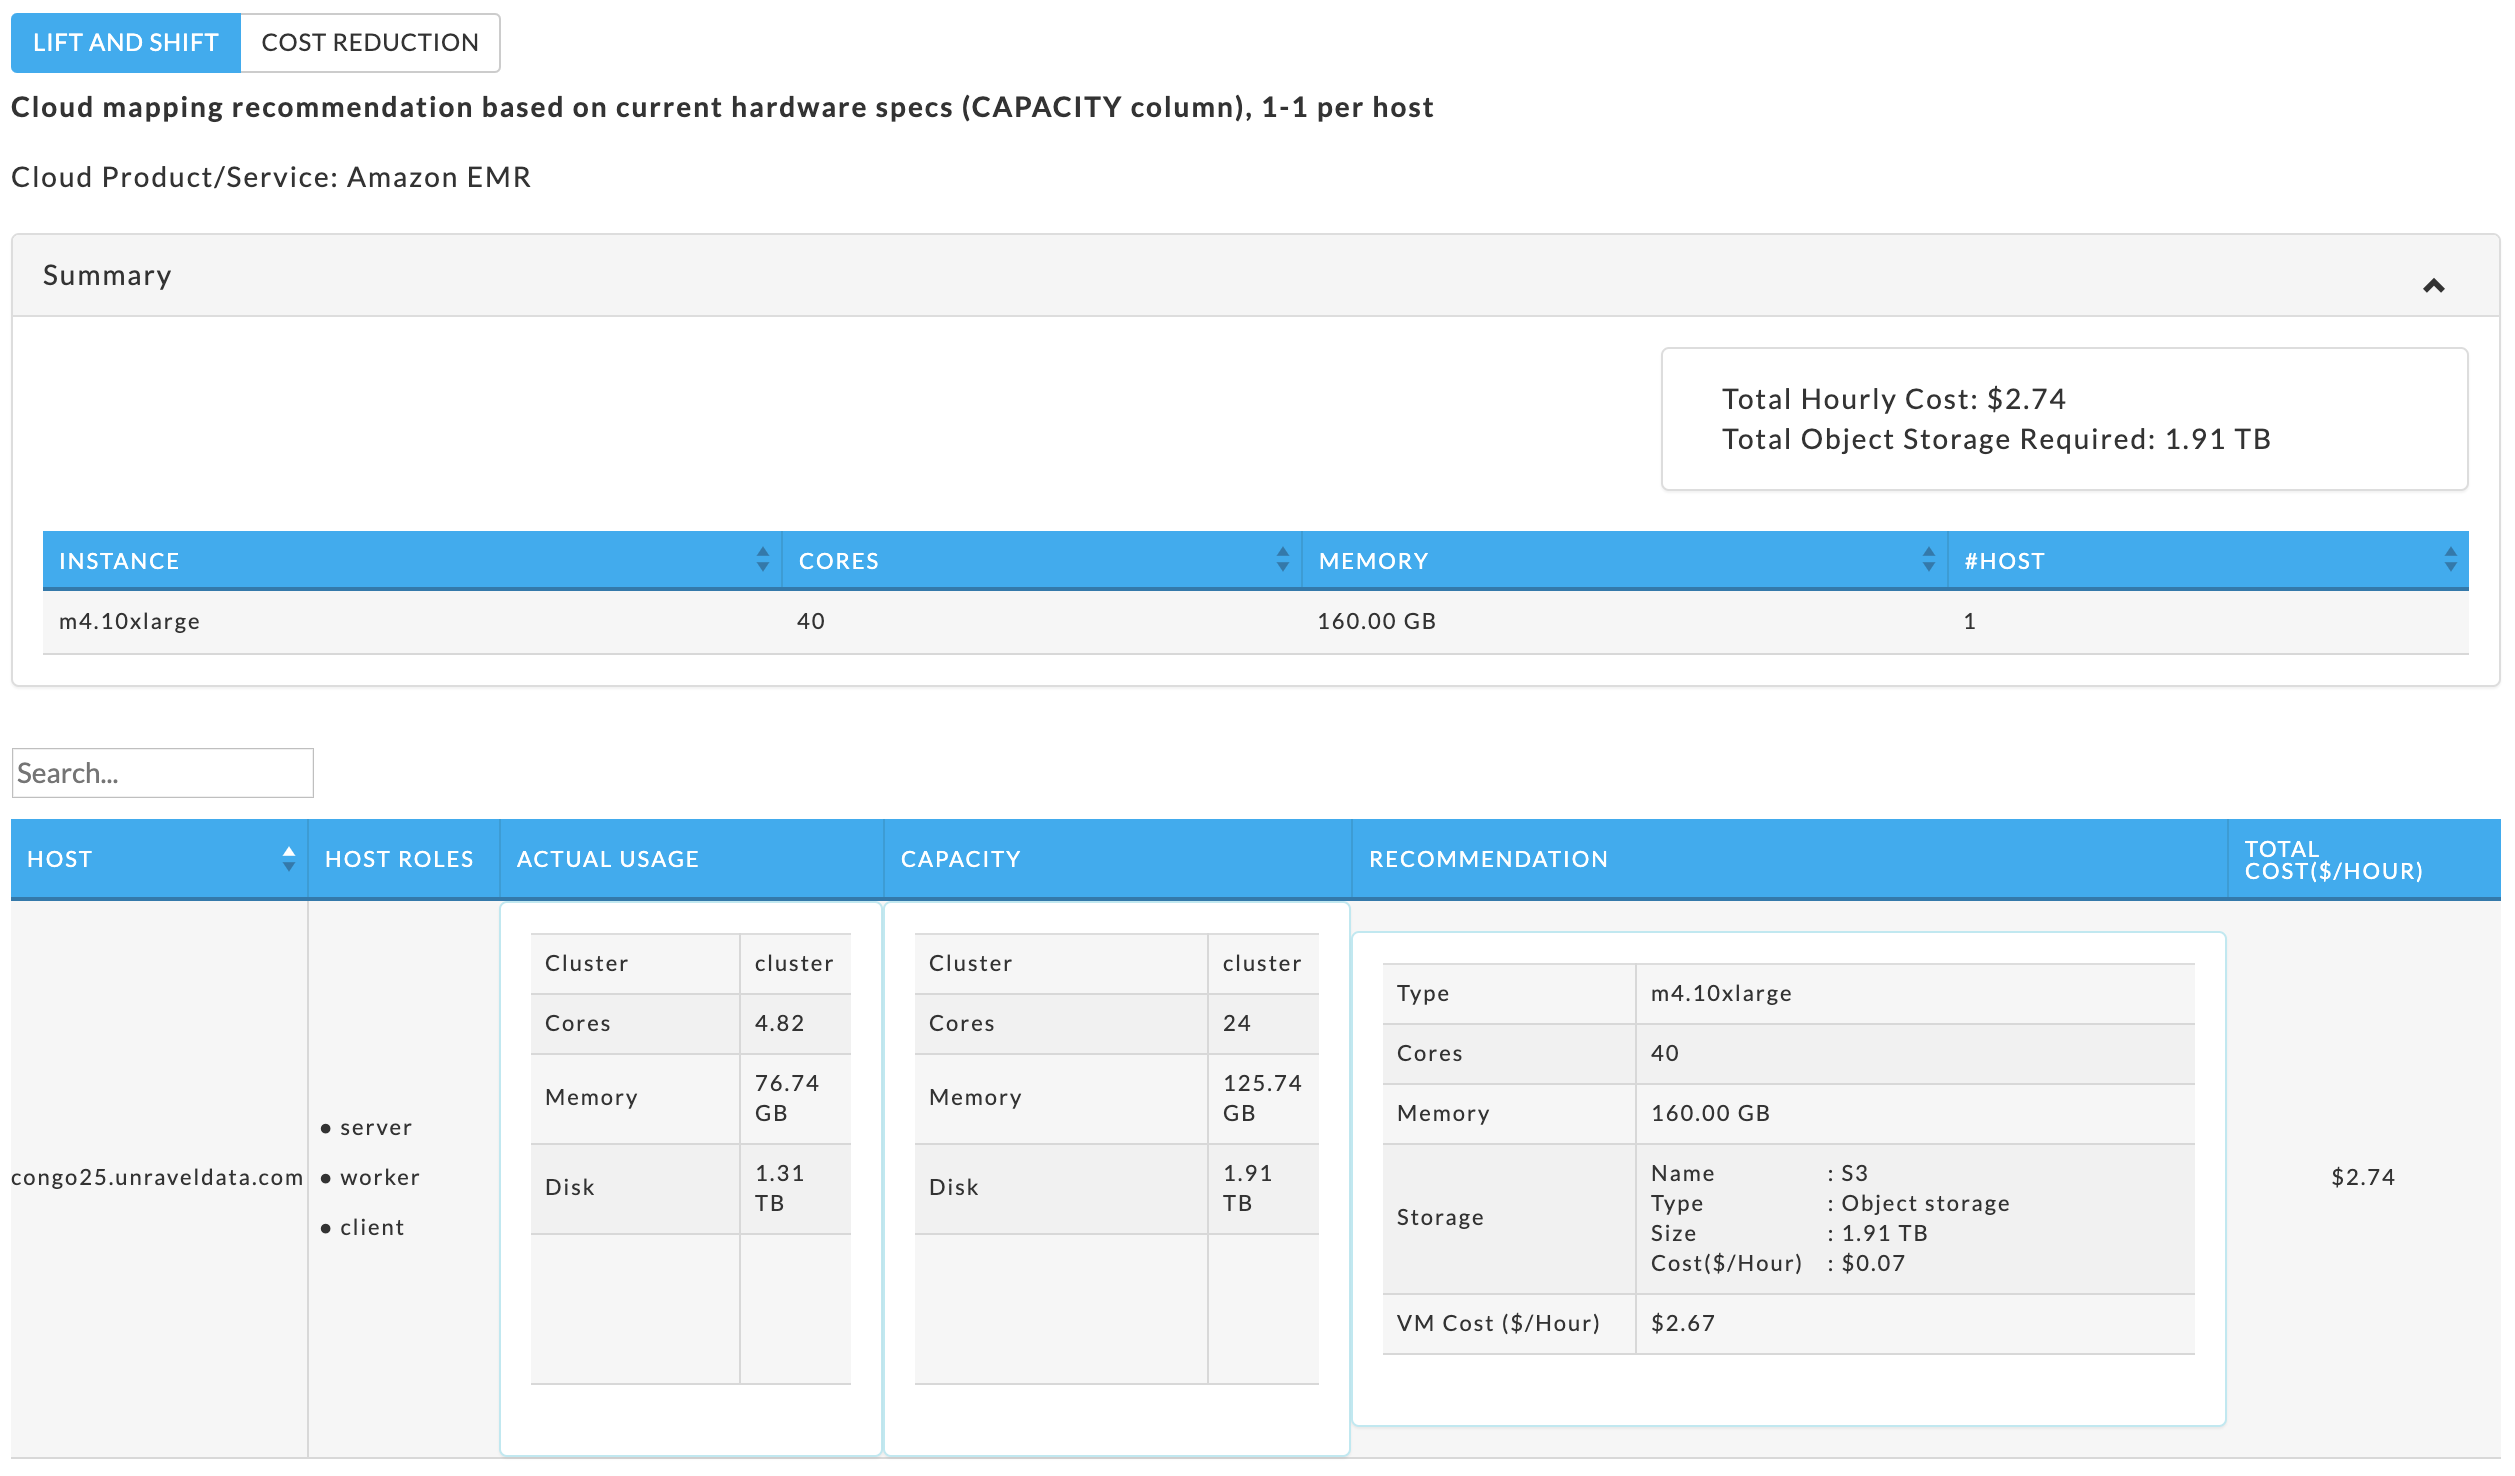
This tab provides a summary of the CLOUD MAPPING PER HOST reports. By default, the tab opens displaying the last report generated for LIFT AND SHIFT. This report is the instance view of the migration. It shows the INSTANCE name, # of CORES, MEMORY and the NUMBER OF HOSTS which were mapped to the instance. There is one row for each instance Unravel mapped one or more hosts to.
Click COST REDUCTION to see the summation of that analysis.
Cloud mapping per host
Generating reports
Click NEW REPORT. The report modal opens and populates the available VM types for the Cloud Product Service, the default is Google Computer Engine (Iaas). If you have previously generated a report, the modal opens with your prior settings.
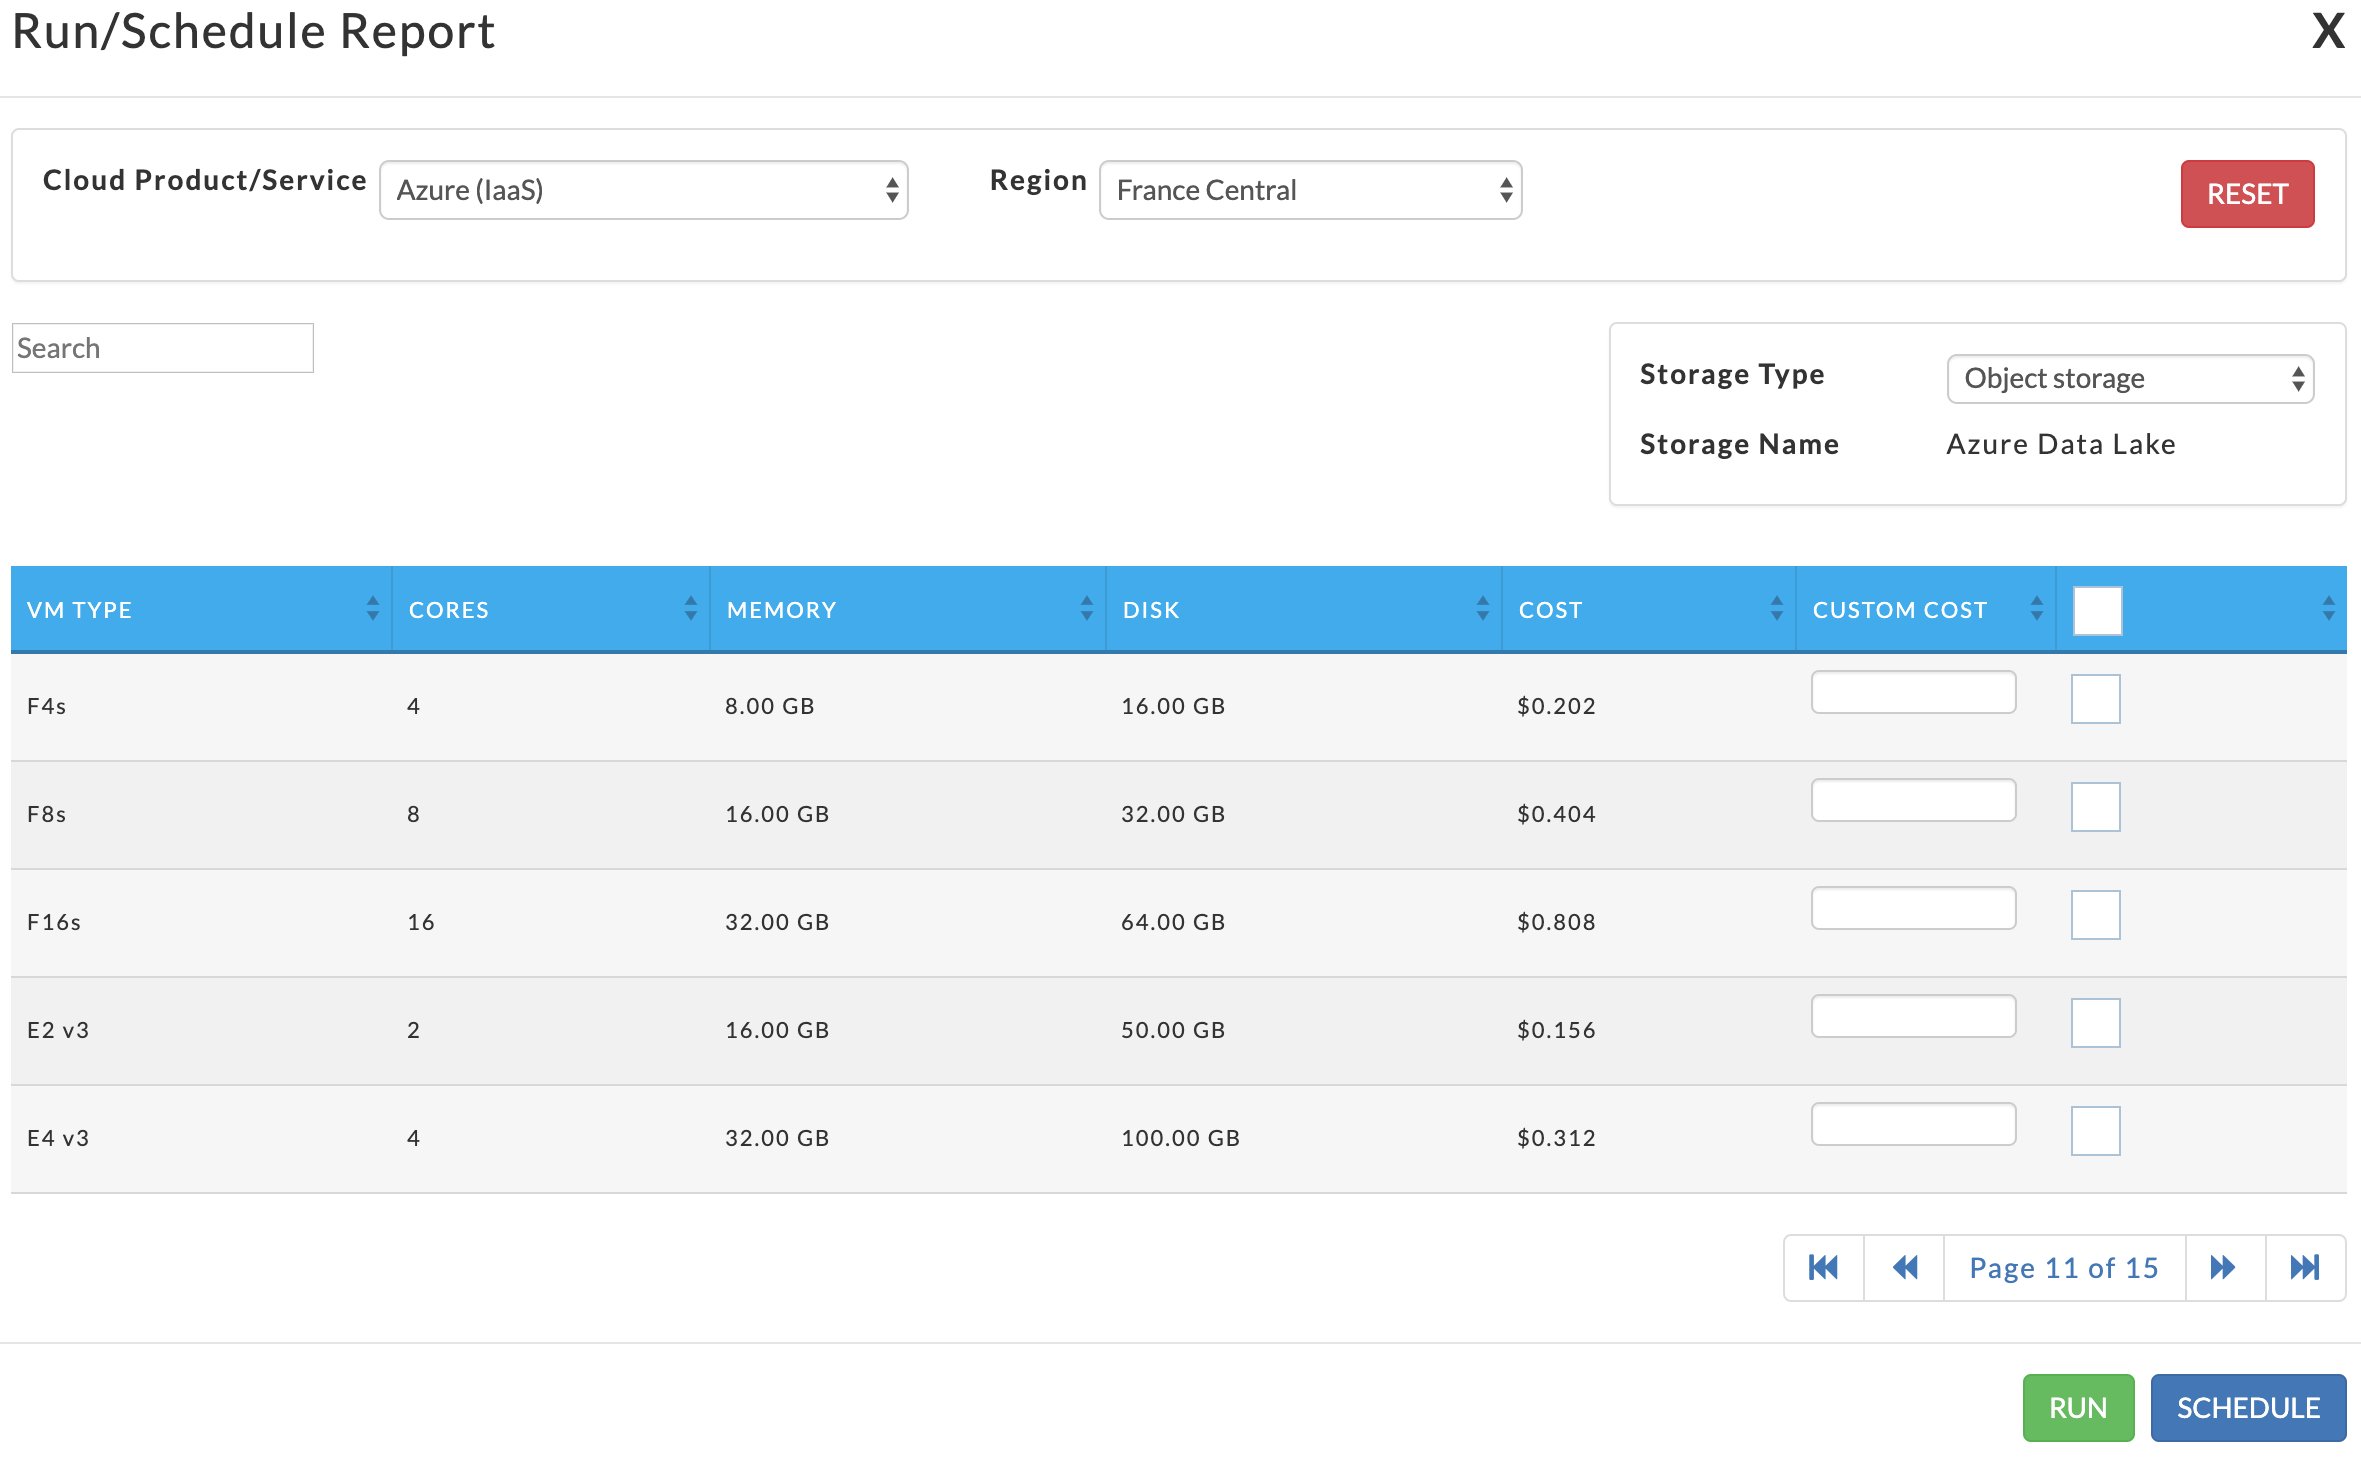 |
To generate the report select:
Cloud Product/Service: Google Compute Engine (IaaS), Google DataProc, Amazon EC2 (Iaas), Amazon EMR, Azure (Iaas), and Azure HDInsight.
Region: the available regions are specific to the Cloud Product/Service you selected.
Storage Type: Local Storage or Object. The Storage Name is determined by the storage type chosen.
The VM Type is populated based upon your chosen Cloud Product/Service and Region. You must select at least one VM Type. Select the check box in the header to select all VM typess. For a subset, select the check box for each type. Unravel uses the providers publicly listed prices. You you enter a custom cost for one or more of the selected host, for Unravel uses for the calculations. Unravel maps your host to the best fit of the instances you selected. Click RESET to clear your selection. Once you have made your selections you can either run or schedule your report.
Click RUN to immediately generate the report. The modal is greyed out and then closed once Unravel starts to generate the report. If Unravel can generate the report a dark green banner is briefly displayed at the top of the window noting the report has started, if the report can not be started a dark red banner appears with an error message.
NEW REPORT pulsates blue until the report has completed. If the report is successful a light green bar appears and NEW REPORT remains blue. If Unravel could not generate the report, NEW REPORT becomes orange and light red bar noting the error is displayed. (Note: the button will remain orange until a report is successfully generated.)
To schedule the report, click SCHEDULE. Click DOWNLOAD JSON to download the displayed report in the JSON.
Unravel gnerates reports to methods:
Lift and Shift: a one-to-one mapping of each on-prem host on the cloud based on your host's capacity.
Cost Reduction: a one-to-one mapping of each on-prem host on the cloud based on your host's actual usage.
Report Layout
By default, the tab opens displaying the last report generated for LIFT AND SHIFT. Click COST REDUCTION to see that report. Each host is mapped to one of the instances you selected when generating the report.
Immediately below the method tab a brief explanation of the method along with the Cloud Product/Service used is displayed.
A summary for the Total Hourly Cost, Total Object Storage, and instance your hosts are mapped to. Lastly, there is a table which lists the mapping of each host.
The table contains:
HOST is you your on-prem host.
HOST ROLE shows the host role, server, worker, or client. A host can have more than one role. This column is only available in Unravel 4.5.3.0 or later.
ACTUAL USAGE shows the host's actual resource usage.
CAPACITY is the total capacity of the host.
RECOMMENDATION the cloud instance Unravel maps your host to.
TOTAL COST ($/HOUR) is the hourly cost of the instance.
LIFT AND SHIFT
This method matches the capacity of your host, and it does not attempt to minimize costs. In our case, the on-prem host is under-utilized. Since Unravel is matching capacity, the mapped instance will also be underutilized. This report mapped one (1) host. In this case, all hosts were mapped to one (1) instance. The Total Hourly Cost is $2.74.
COST REDUCTION
This method is again mapping each host to an instance, this time the mapping is based on host's actual usage. This report mapped one (1) host. The Total Hourly Cost is $1.49, a saving of $1.25.
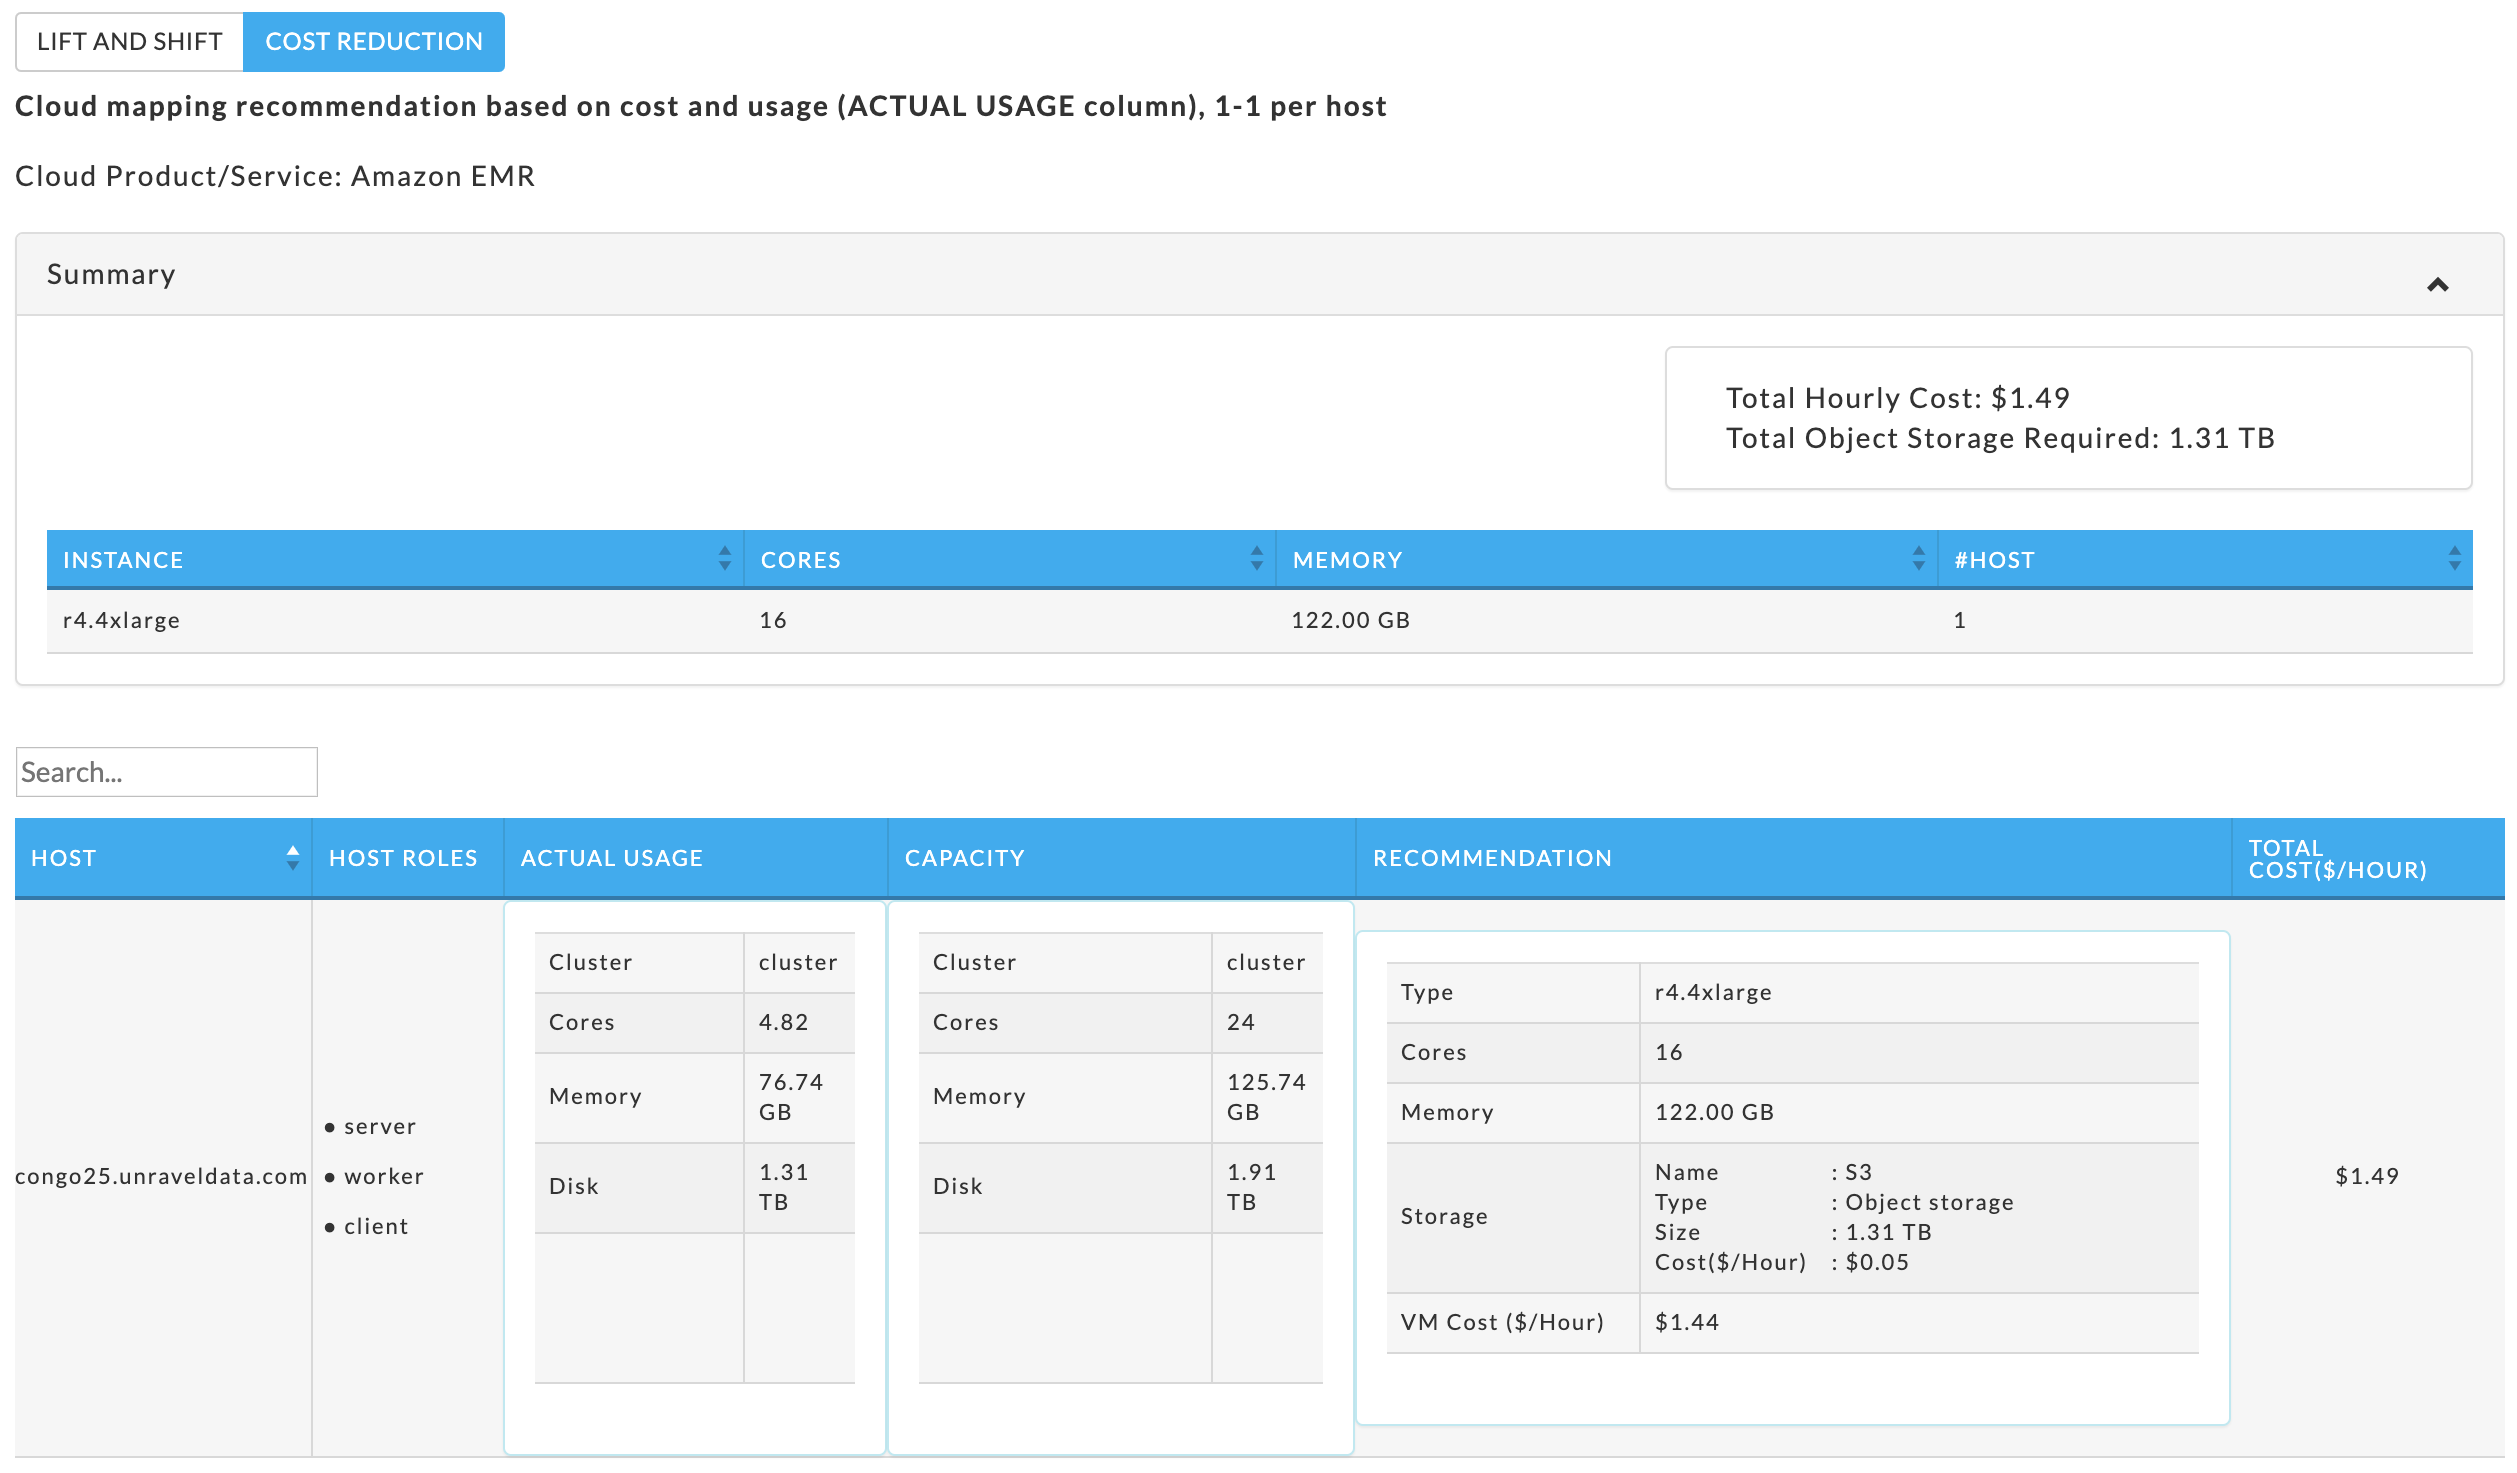
Both LIFT AND SHIFT and COST REDUCTION perform a 1-1 mapping, each host is matched to an instance using the on-prem host's capacity and actual usage
Services and versions compatibility
This tab is only available in 4.5.3.0 and later.
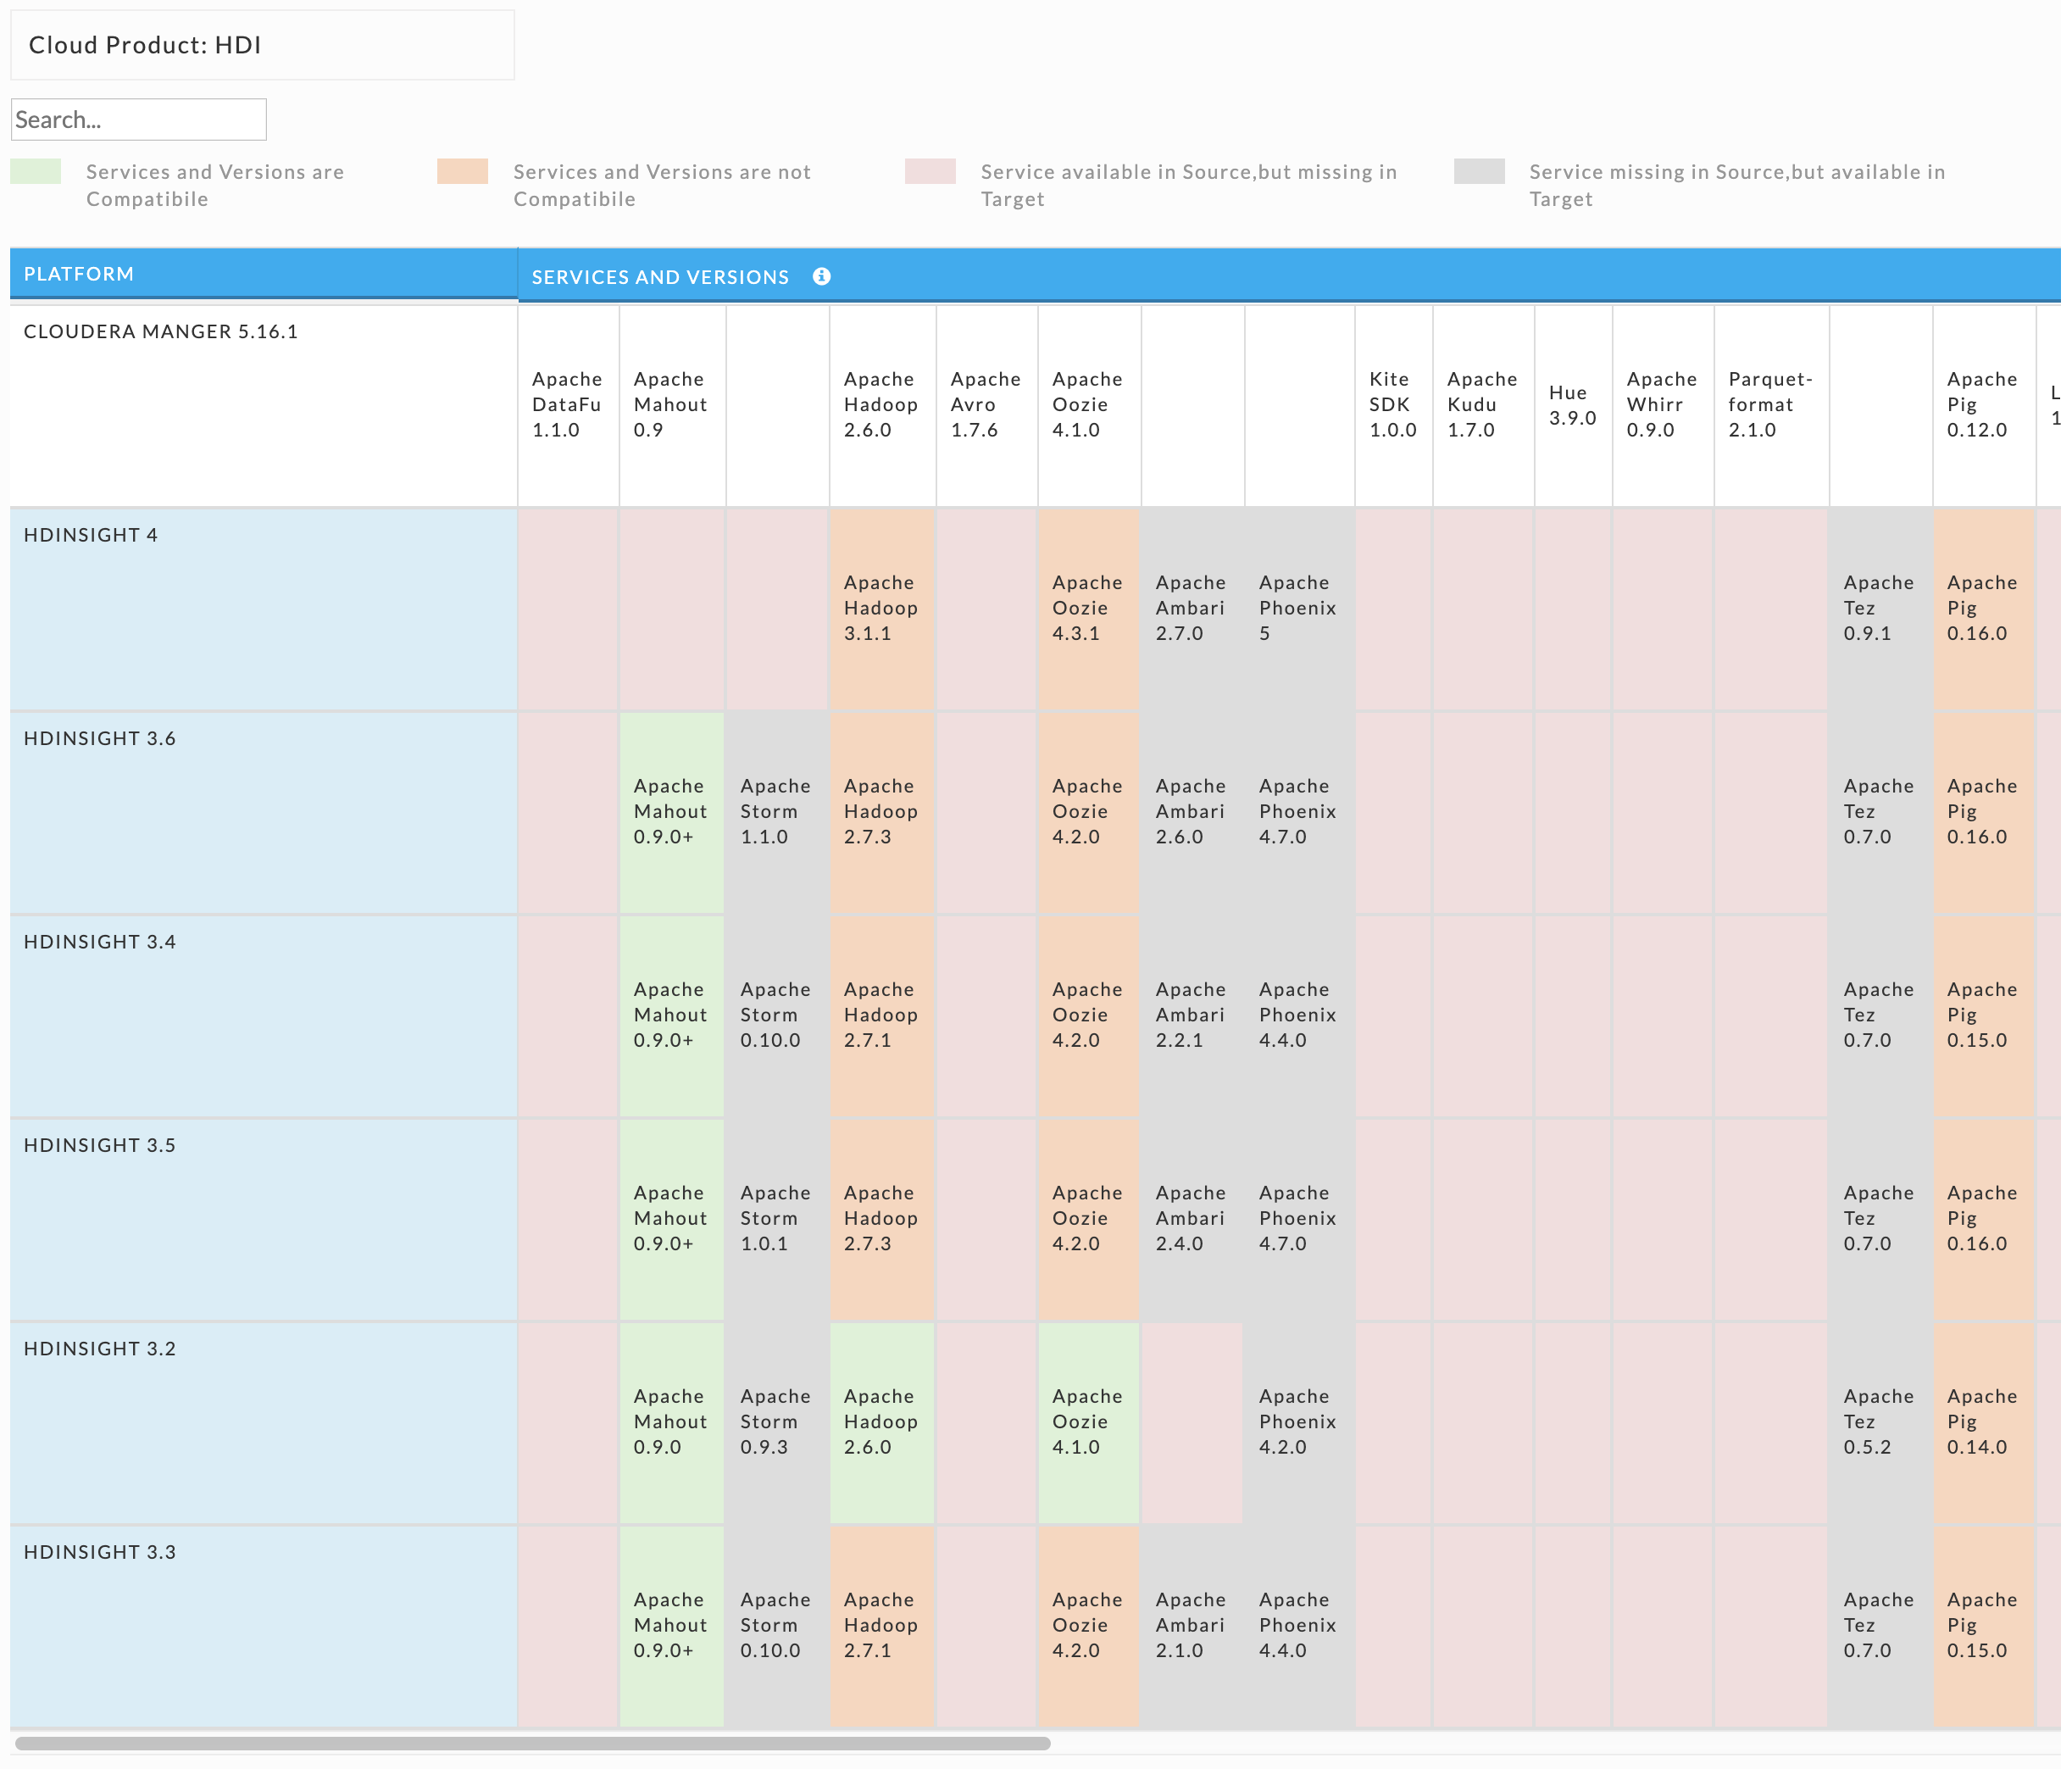
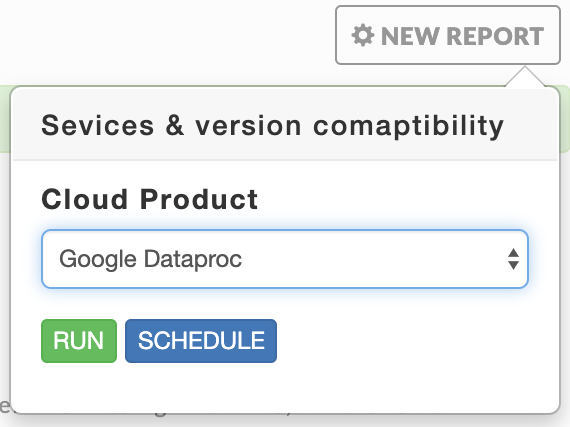
This report is a matrix which maps on-prem platforms to the service which are available and compatible on a cloud provider. To generate a report select NEW REPORT. Select the Cloud Product (Google DataProc, Amazon EMR, Azure HDInsight) you want to create the report for.
 |
The matrix maps :
Services and Versions are Compatible: the service is on your cluster, the cloud product and are compatible. (
 )
)Services and Versions are not Compatible: the service is on your cluster and the cloud product, but they are not compatible. (
 )
)Service available in Source, but missing in Target: the service is on your cluster but not on the cloud product. (
 )
)Service missing in Source, but available in Target: the service is missing in your cluster but available on the cloud product. (
 )
)