Hive details page
The Hive APM provides a detailed view of the behavior of Hive queries. Typical users are Hadoop DBAs or app owners (engineers, BI team, analysts). You can use this view to resolve inefficiencies, bottlenecks, and reasons for failure within Hive apps.
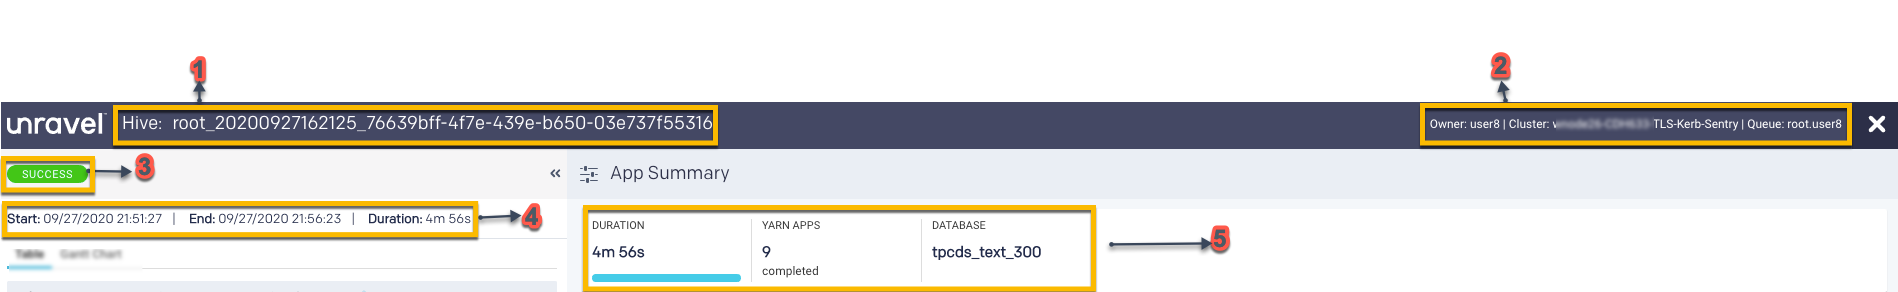
When you open a Hive details page, the following details are displayed on the upper section of the page:
Item No. | Description |
|---|---|
1 | Name or ID of the Hive query. |
2 | Details of the Hive app owner, cluster ID, and Queue. |
3 | Status indicator. Displays whether the app was successful, failed, or killed. |
4 | Start time of the query run. End time of the query run. Duration of the query run. |
5 | Duration of the Hive query run. Number of Yarn applications involved in the query run. Name of the Database where the query was run. |
The following tabs are displayed on the left section of the page:
Table: This tab lists the jobs in a Hive query with the following details:
Job ID: ID of the job in the application.
Start Time: Time when the job started.
Duration: Period since the job has started.
I/O: Data input/output
Gantt Chart: The Gantt tab visually displays the progress of all the jobs along with their status in a color-coded bar against a timescale.
The status, start time, duration, and events of the job are shown when you hover over the status bar. When you click the status bar, the Job summary page is displayed.
Note
For Hive queries that don't run using a Tez, LLAP, MapReduce, or Spark app, the duration shown by Unravel may be inaccurate because Hive doesn't call the Hive pre and post hooks correctly for these queries.
Hive query details
Hive runs on Tez, LLAP, MapReduce or Spark apps. When you select a Hive query from the application list, the details page of the hive query running on the corresponding apps are shown. Following are the tabs that are shown when you open a Hive query details page:
The Unravel intelligence engine helps you manage your jobs and pipelines by analyzing its run and providing insights based upon the runs. Unravel's analysis results show where the efficiencies of your app can be improved at the cluster level as well as at the application level.
The number of efficiencies found is noted in the tab. When an Efficiency leads to a suggested parameter/property change, those suggestions are listed as a Recommendation.
Efficiency (
 ): Suggest areas to examine to improve efficiency. For example, inefficient usage of resources. Expand an Efficiency to read the in-depth analysis. While some are only configuration property suggestions, others call your attention to areas you should examine. For example, inefficient storage, problems with a query etc.
Recommendations (
 ): Suggestions to update a property or configuration parameter. Click to view the current and recommended value.
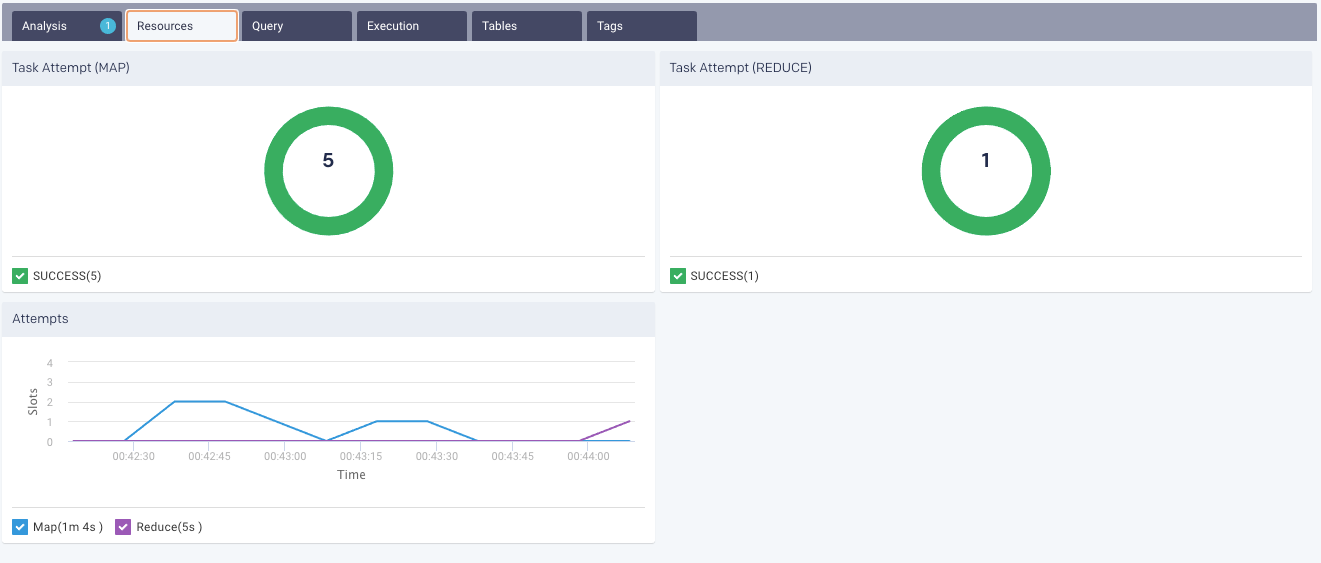
Task Attempts:Graphically and textually notes the number of tasks and their status. The donut graphs show the successful (green), failed (orange), and killed (red) jobs.
Attempts: Graphs the map and reduce task slot usage over the duration of the job.
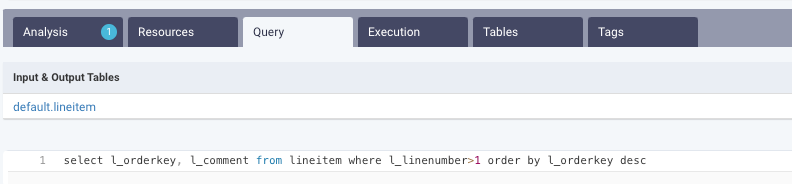
Shows the Hive query along with the tables that were involved in running the query.
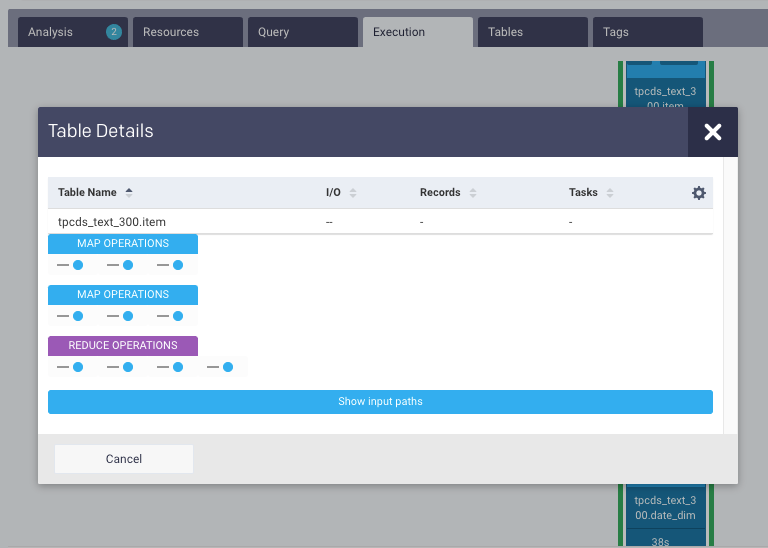
Shows detailed information about the Map and Reduce jobs are shown.
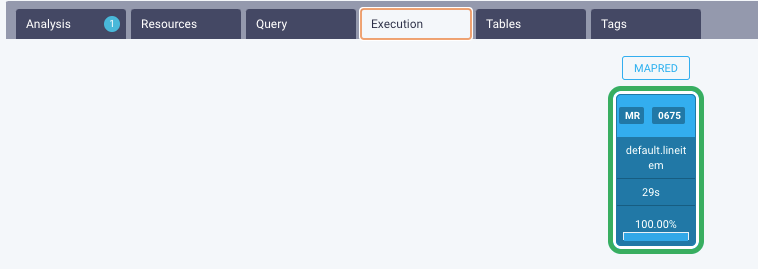
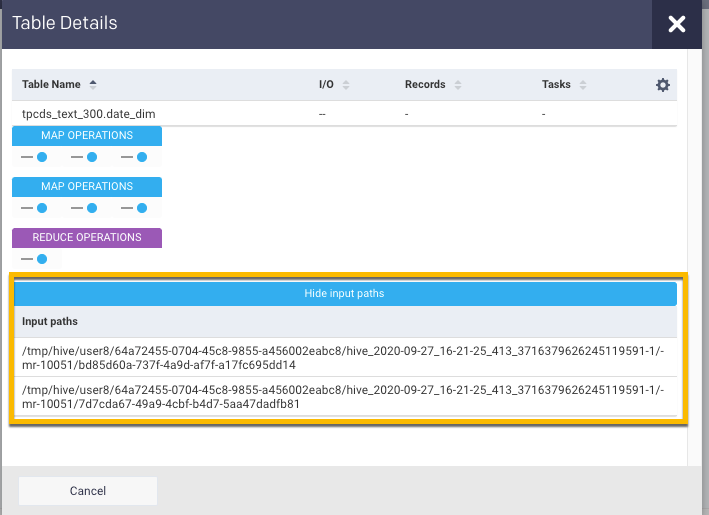
Click the Job and the details of the tables and the Map and Reduce operations are shown. You click a table name and the table details are displayed :
Click Show input paths to view the input paths for the job.
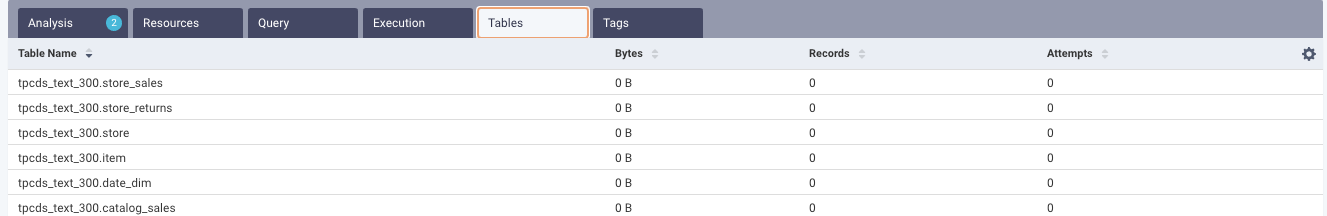
Displays the list of tables that were accessed by the job.
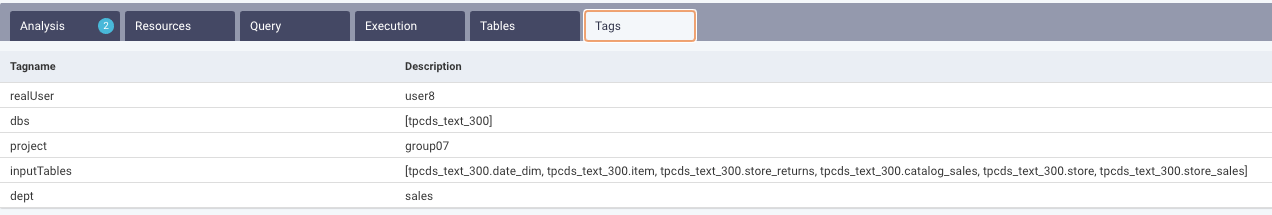
This tab lists the tags used in the Tez application. Refer to Tagging.
Job Summary
Click a job in the Tables tab, the Jobs summary page is displayed with the following tabs:
This tab provides Unravel's analysis results where the inefficiencies of the Jobs can be improved. Efficiency suggestions and recommendations are provided to improve the Job runs.
The Unravel intelligence engine helps you manage your jobs and pipelines by analyzing its run and providing insights based upon the runs. Unravel's analysis results show where the efficiencies of your app can be improved at the cluster level as well as at the application level.
The number of efficiencies found is noted in the tab. When an Efficiency leads to a suggested parameter/property change, those suggestions are listed as a Recommendation.
Efficiency (
): Suggest areas to examine to improve efficiency. For example, inefficient usage of resources. Expand an Efficiency to read the in-depth analysis. While some are only configuration property suggestions, others call your attention to areas you should examine. For example, inefficient storage, problems with a query etc.Recommendations (
): Suggestions to update a property or configuration parameter. Click to view the current and recommended value.
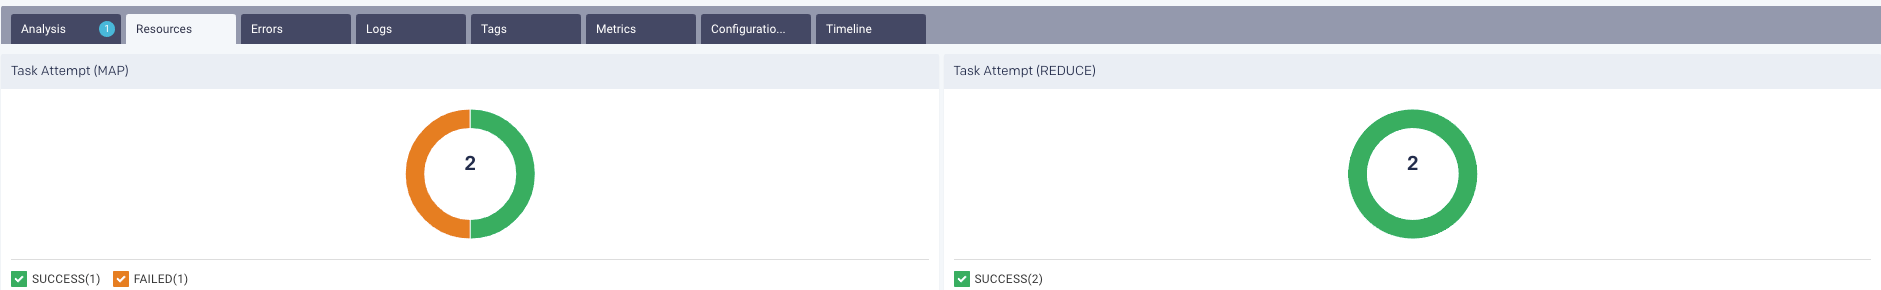
The resources contain the following charts:
Taskattempt (MAP, REDUCE): Graphically and textually notes the number of MAP and REDUCE task attempts. The donut graphs show the number of successful (green), failed (orange), and killed (red) tasks.
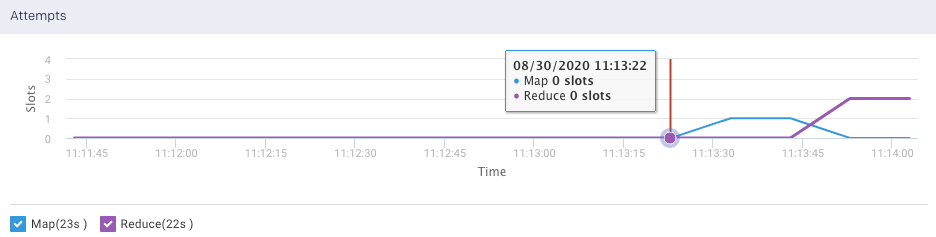
Attempt (MAP, REDUCE): Plots the number of MAP and REDUCE slots over a period.
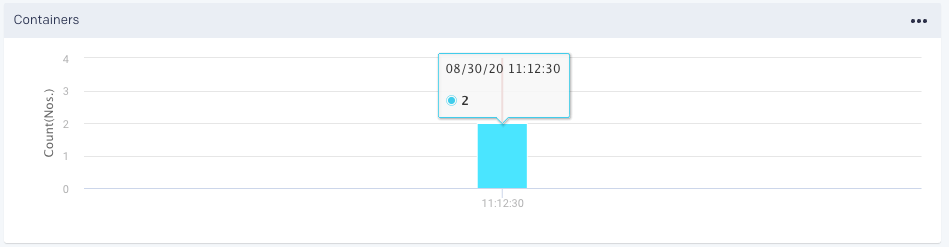
Containers: Graphs the number of containers used.
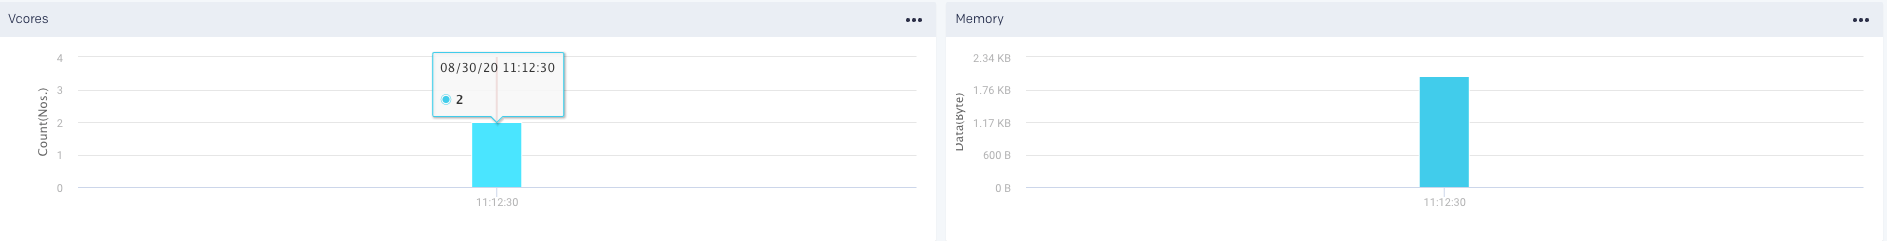
vCores and Memory Graphs the vCores and Memory used for running the jobs.
Metrics: The details of the following metrics of the application are plotted in a graph:
OS Memory
CPU Utilization
Java Memory
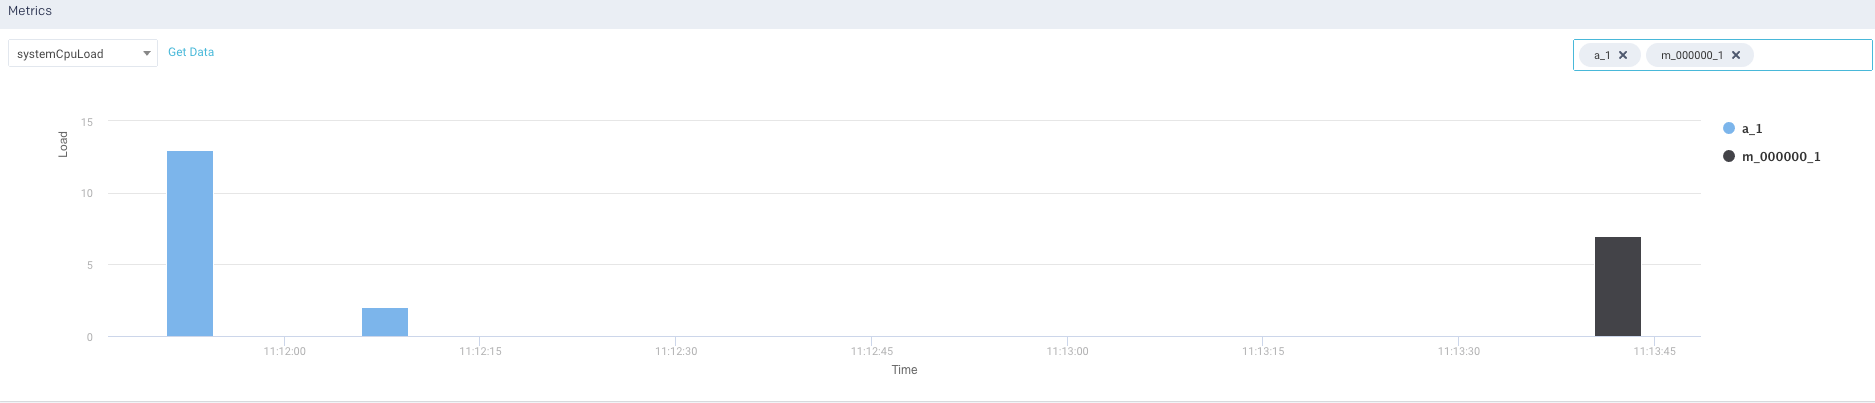
Click Get Data to get the raw data of the graph. You can further drill-down each metric.
This tab lists the errors that were encountered during the job run.
From this tab, you can view the logs.
This tab lists the tags used in the Spark application. Refer to Tagging.
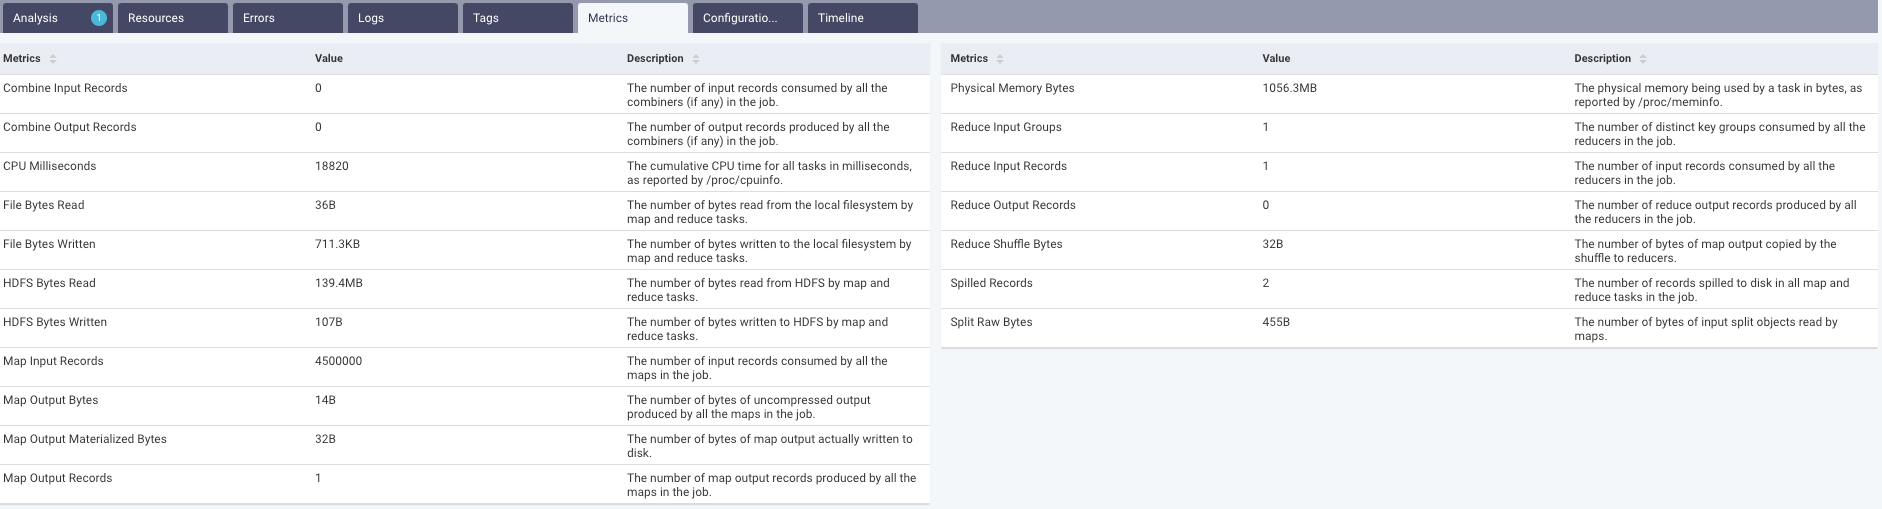
This tab lists all the metrics involved in running the job, their values, and their corresponding definitions.
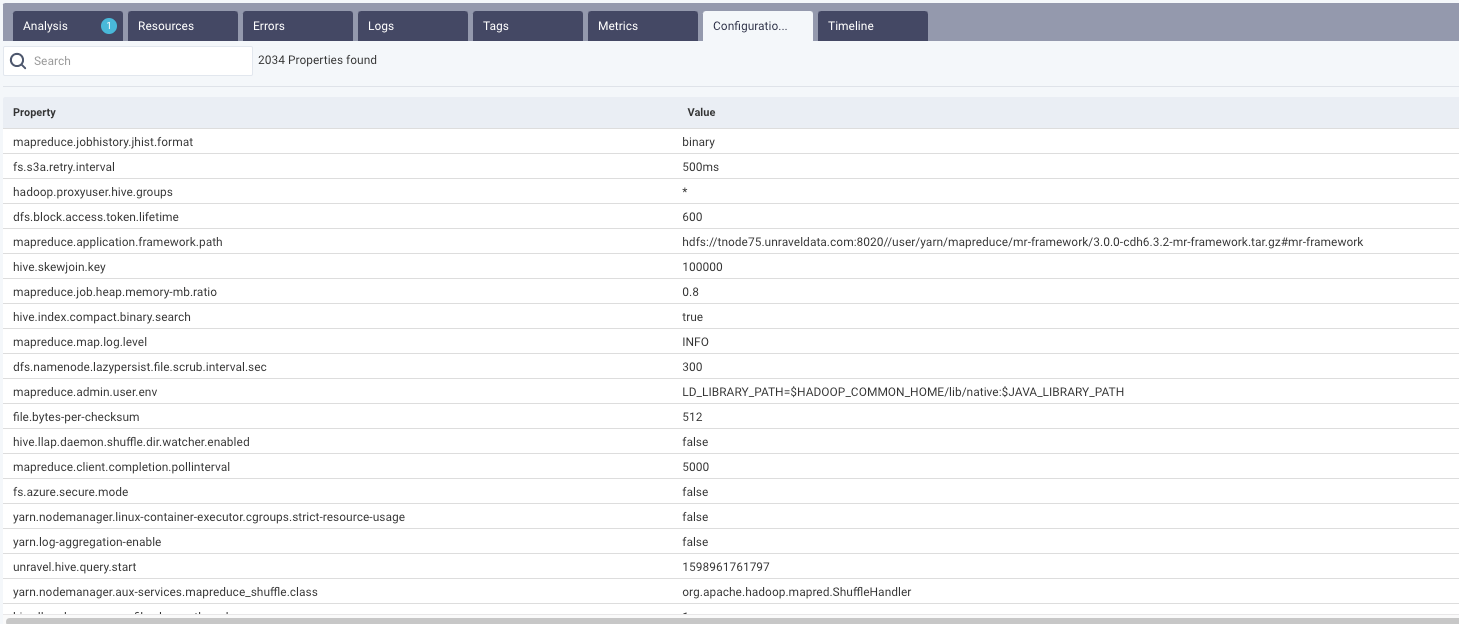
This tab lists all the configurations involved in running the job, their values, and their corresponding definitions.
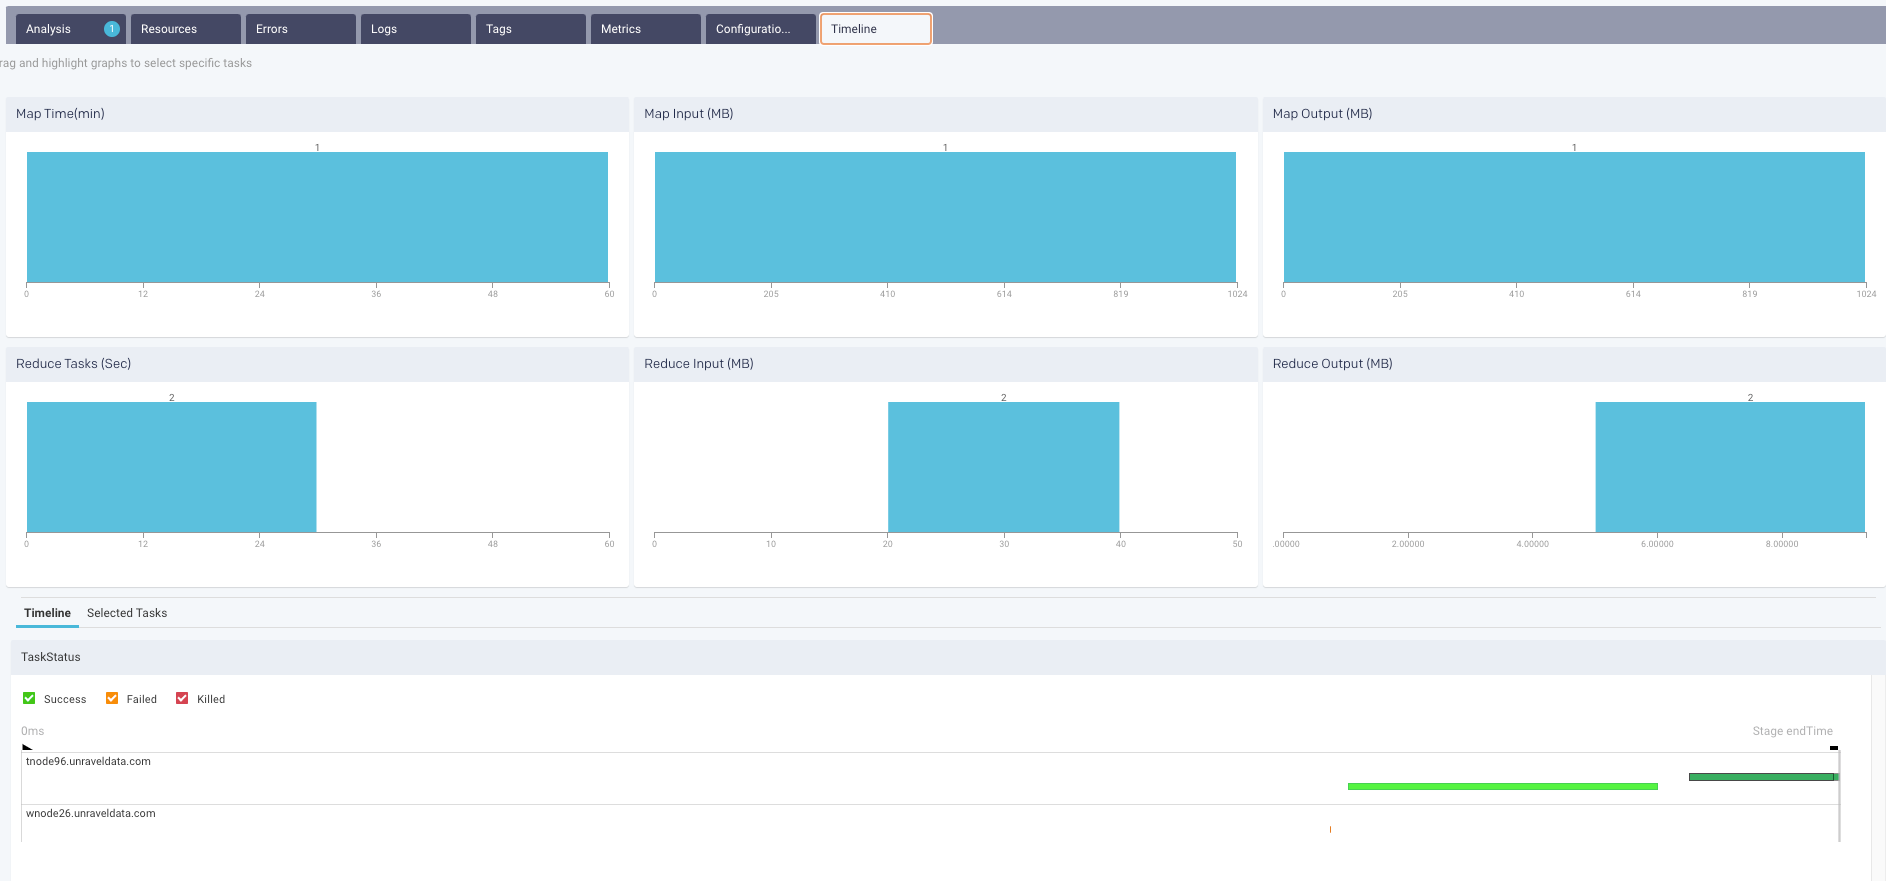
MAP REDUCE Charts: By default, the Time Line tab opens with the MAP REDUCE Charts displaying the tasks over the graphs.
Hive on Tez apps
The Hive on Tez apps are specifically highlighted in the Parent App column in the applications list. For more details, refer to Tez details page
Hive on Spark apps
For Hive-on-Spark jobs the Hive APM shows the details of the Spark app. Like the Spark APM, the running and completed Spark Jobs are listed. Click a job, the Spark Job information is shown and you can drill down into the Job's stages. See the Spark details page for more information.