Data

The Data page presents information about tables and partitions. This information includes the following
Metadata: For example, database and table names, owner, path, storage format, create date, etc.
KPIs: For example, the number and size of tables and partitions, the number of applications accessing each table, etc.
Insights: For example, tables with too many small files or tables that do not have table statistics, etc.
Unravel v4.6.2.0 introduces multi-cluster support. In this version, the data page supports tables and partitions on multiple on-prem (CDH, HDP) clusters, each of which has its own Hive metastore and HDFS.
The following scenarios are currently not supported:
Multiple EMR, HDI clusters where each cluster has its own metastore and HDFS.
Tables whose metadata are stored on an external metastore and are shared by multiple clusters. For example, multiple EMR clusters refer to the same external Hive metastore or Glue.
Tables whose data are stored on an external file system and are shared by multiple clusters. For example, multiple EMR clusters refer to data stored on S3.
The data page has the following tabs:
Overview: Shows table and partition KPIs for a given cluster and metastore.
Tables: Provide details and insights into the tables for a given cluster and metastore.
Forecasting: Forecasts future disk capacity requirements based upon past performance.
Small Files: Adhoc report that generates a list of directories containing small files.
File Reports: Similar to Small Files, except canned reports for large, medium, tiny, and empty files.
Note
Click here for common features used throughout Unravel's UI.
Configuring Data page
Currently, the data page supports getting metadata from multiple Hive metastores. Each Hive metastore connection is a JDBC connection made from the Core node to the database for the Hive metastore. In the following tables, the first is for a single-cluster environment, which is backward compatible with previous versions of Unravel. The second table is for a multi-cluster environment.
Single-cluster environment
Multi-cluster environment
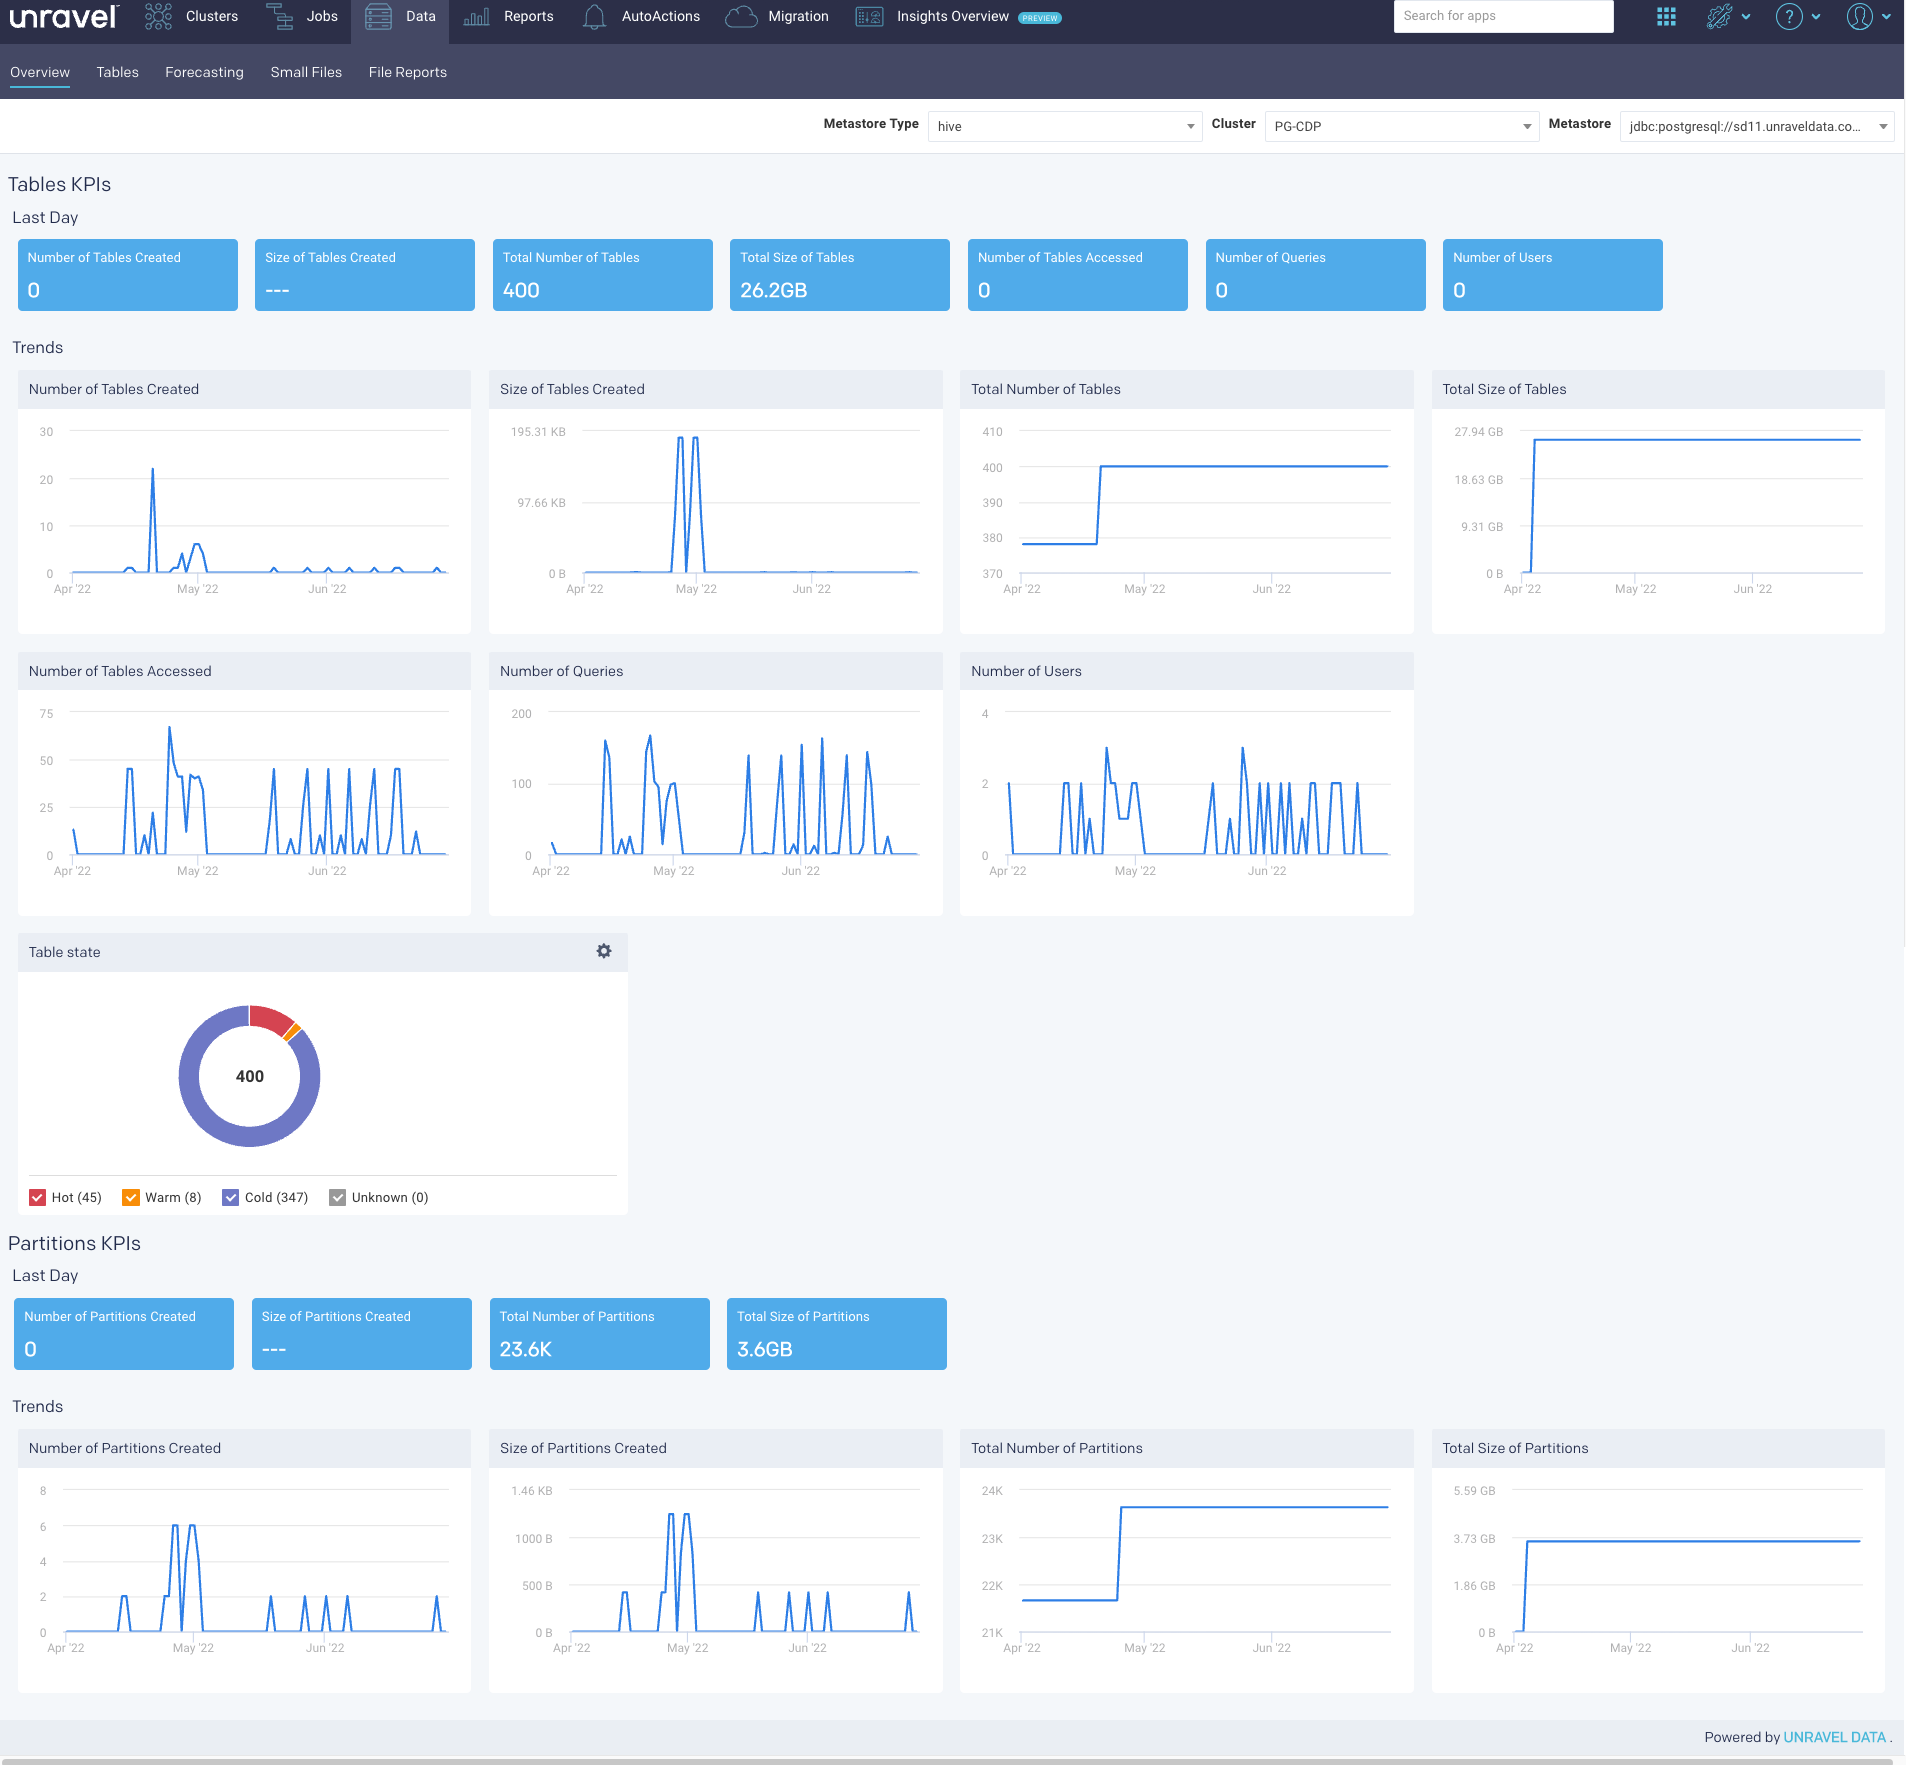
Overview
The Overview tab provides a quick view of the tables' and partitions' sizes, usage, and KPIs with corresponding graphs. The following sections are included in this tab:
Selecting a cluster in Datapage overview
Go to the Data > Overview tab.
From the Cluster drop-down, select a cluster. By default, the first cluster on the drop-down cluster list is selected. To access a different cluster, select a different one from the drop-down list. For a given cluster, the corresponding metastore is automatically selected.
Tables KPIs and Trends
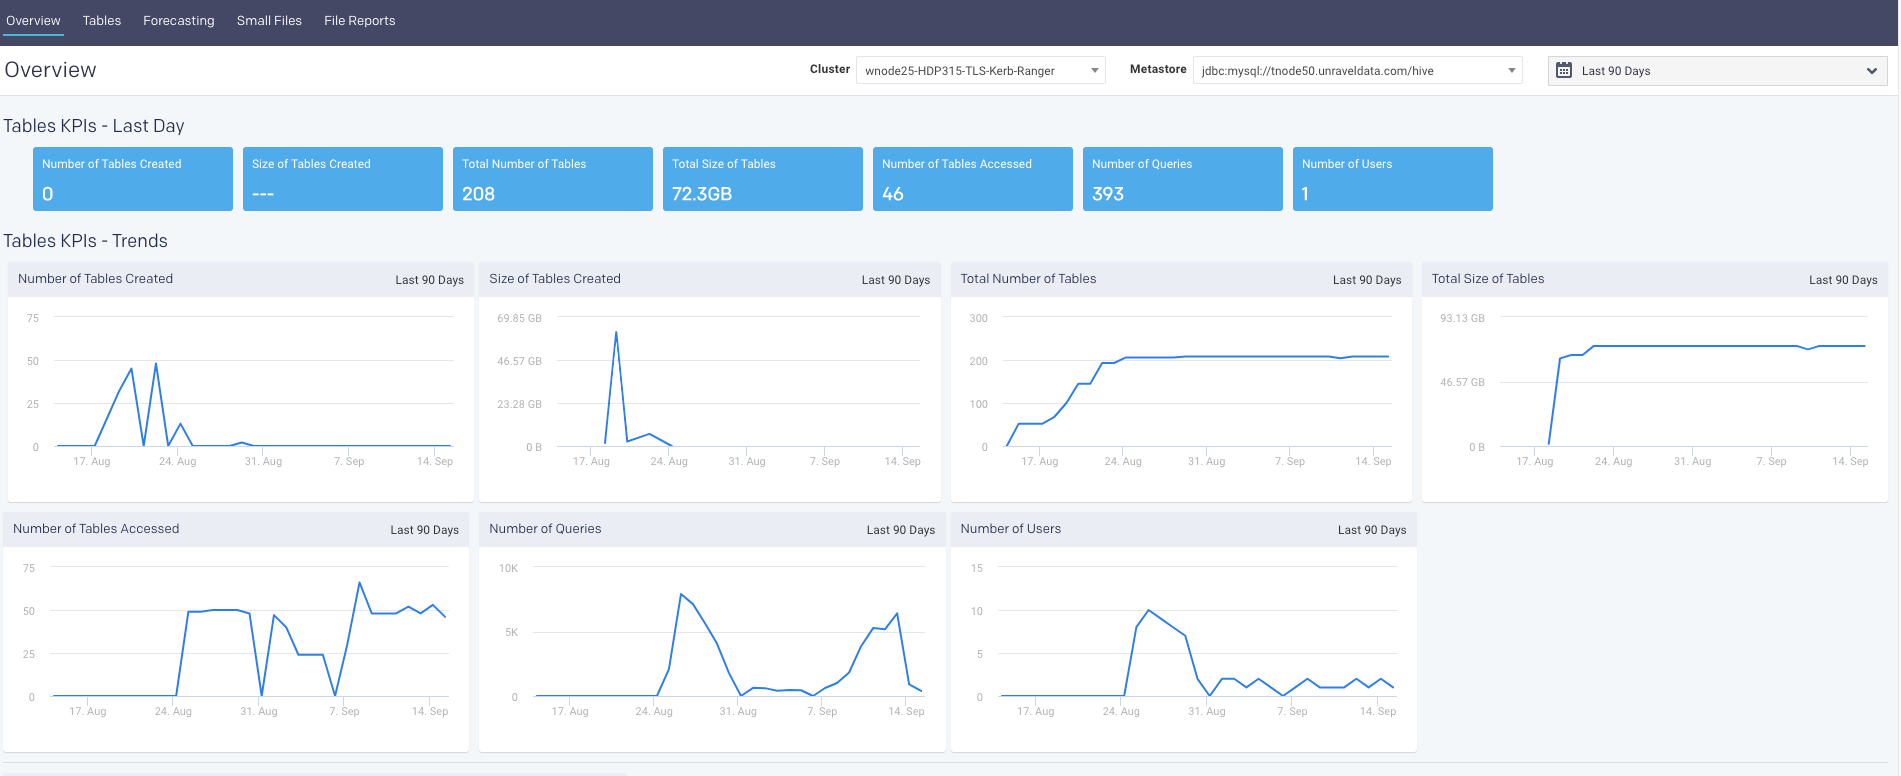
Table KPIs and trends
The following table KPIs are shown for both the last day and the last 90 days in a trend.
KPI | Description |
|---|---|
Number of Tables Created | Number of tables created for that time period. |
Size of Tables Created | The size of all the tables created for that time period. |
Total Number of tables | Total number of tables in the system for that time period. |
Total size of Tables | The size of all tables in the system for that time period. |
Number of Tables Accessed | Number of tables that are accessed for that time period. |
Number of Queries | Total number of queries that accessed the tables within the system, for that time period. |
Number of Users | Number of users who have accessed the tables for that time period. |
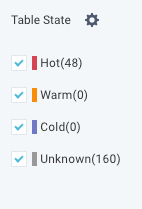
Table state
You can define a color-coded heat label for the tables, that is, Hot ( ), Warm (
 ), Cold (
 ). The uncategorized tables are listed as Unknown (
 . The temperatures are defined based on the following parameters:
Age: the period since the table was created.
Last App Access: The last time the table was accessed by an application.
To define a heat label for the table:
Go to Data > Overview > Table state section.
Click
 . The Label Tables dialog is displayed.
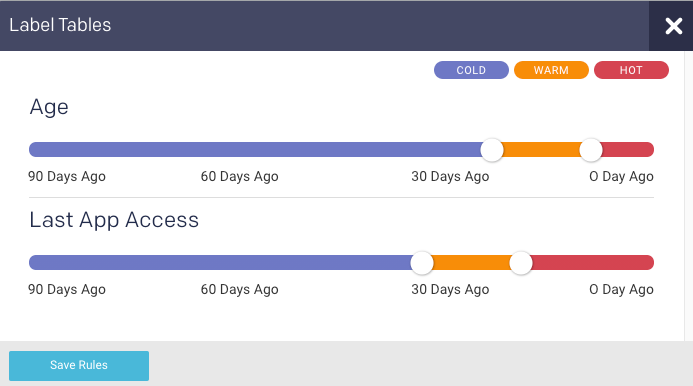
Move the color-slider to set the period for the tables to be defined under a specific color-coded heat label.
Click Save Rules. The corresponding donut chart displays the proportion of tables that are in the defined Hot (
), Warm (), and Cold () states.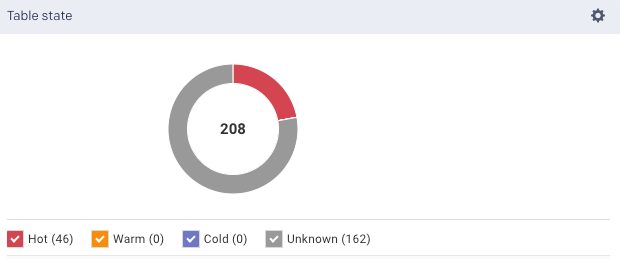
These states of a table are classified based on the following logic:
A table is marked as
Unknown when either Age or Last App Access is unknown.When both the metrics are known, then the following logic is applied:
A table is Hot (
) when at least one of the metrics (Age or Last App Access) is hot.A table is Warm (
) when both metrics (Age and Last App Access) are warm, or when one is warm and the other is cold.A table is Cold (
) when both metrics (Age and Last App Access) are cold.
Partition KPIs and Trends
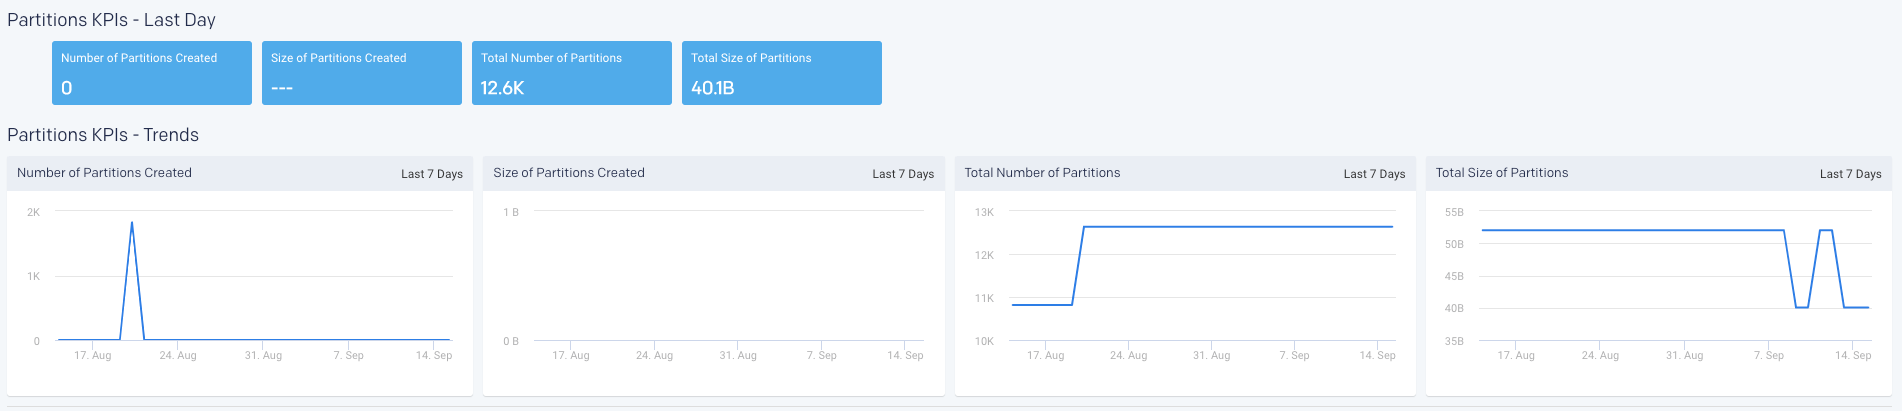
Partition KPIs and trends
The following partition KPIs are shown for both the last day and the last 90 days in a trend.
KPI | Description |
|---|---|
Number of Partitions Created | Number of partitions created for that time period. |
Size of Partitions Created | The accumulated size of all the partitions created for that time period. |
Total Number of Partitions | Total Number of partitions currently in the system for that time period. |
Total size of Partitions | The accumulated size of all partitions in the system for that time period. |
Tables
You can check the current information for each of the tables in the metastore, for a selected cluster, from the Tables tab. The following details are shown:
Users accessing the tables
Number of applications accessing the tables
Number of partitions in a table
Types of applications accessing the tables
Table metadata
Table size
Tables running in (hot, warm, cold, and unknown states)
Total number of tables in a cluster
Recommendations and insights for the table
Configuring Tables report
Refer to Data Page configurations and ensure that the configurations for Hive Metstore connection and FSImage are set.
Viewing table details
Go to the Data > Tables tab.
From the Cluster drop-down, select a cluster. The corresponding metastore IDs are automatically displayed in the Metastore drop-down.
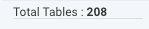
Select a metastore option. A list of tables is displayed with the following metadata. The total tables for the selected cluster and metastore are displayed on the left
 . You can click
  to export the list of tables in CSV format.
Click
in the table header, to add or the columns in the table.Metadata
Description
Database
Name of the database where the table is stored.
Table
Name of the table.
Owner
Owner of the table.
Path
Location of the table. Hover over to view the complete path.
Table Type
Type of the table.
File System
File system that is used to store the table. Hover over to view the source of the table. For example, metastore or apps.
Storage Format
The format in which the table is stored. For example, text, ORC, PARQUET.
Hover over to view the source of the table and the last updated time of this field.
Created
Date and time when the table was created. Hover over to view the source of the table and the last updated time of this field.
Latest Access
Date and time when the table was last accessed. Hover over to view the source of the table and the last updated time of this field
Size
Size of the table.
Apps
The type of app accessing the tables. Hover over to view various apps accessing the tables and the last updated time of this field.
Partitions
Number of partitions in a table.
Users
Number of users accessing the table.
More Info
Click
 to access more information about the selected table.
Select the checkbox corresponding to a table for which you want to view the details. The following graphs are updated based on the selection:
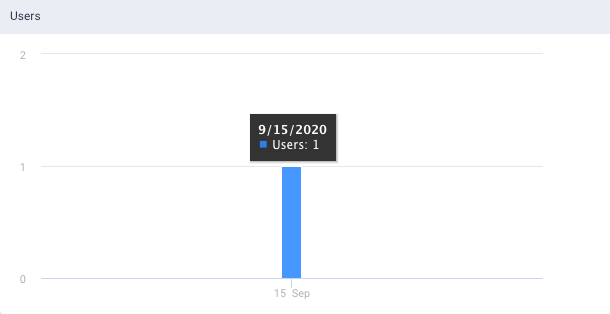
Users: This graph plots the number of users who access the tables on a given day.
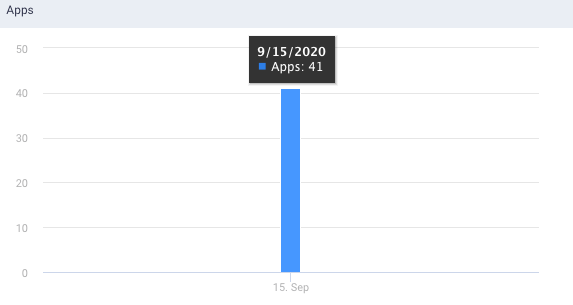
Apps: This graph plots the number of applications that access the tables on a given day.
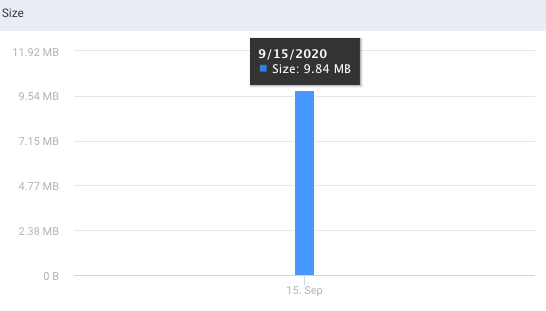
Size: This graph plots the table size on a given day.
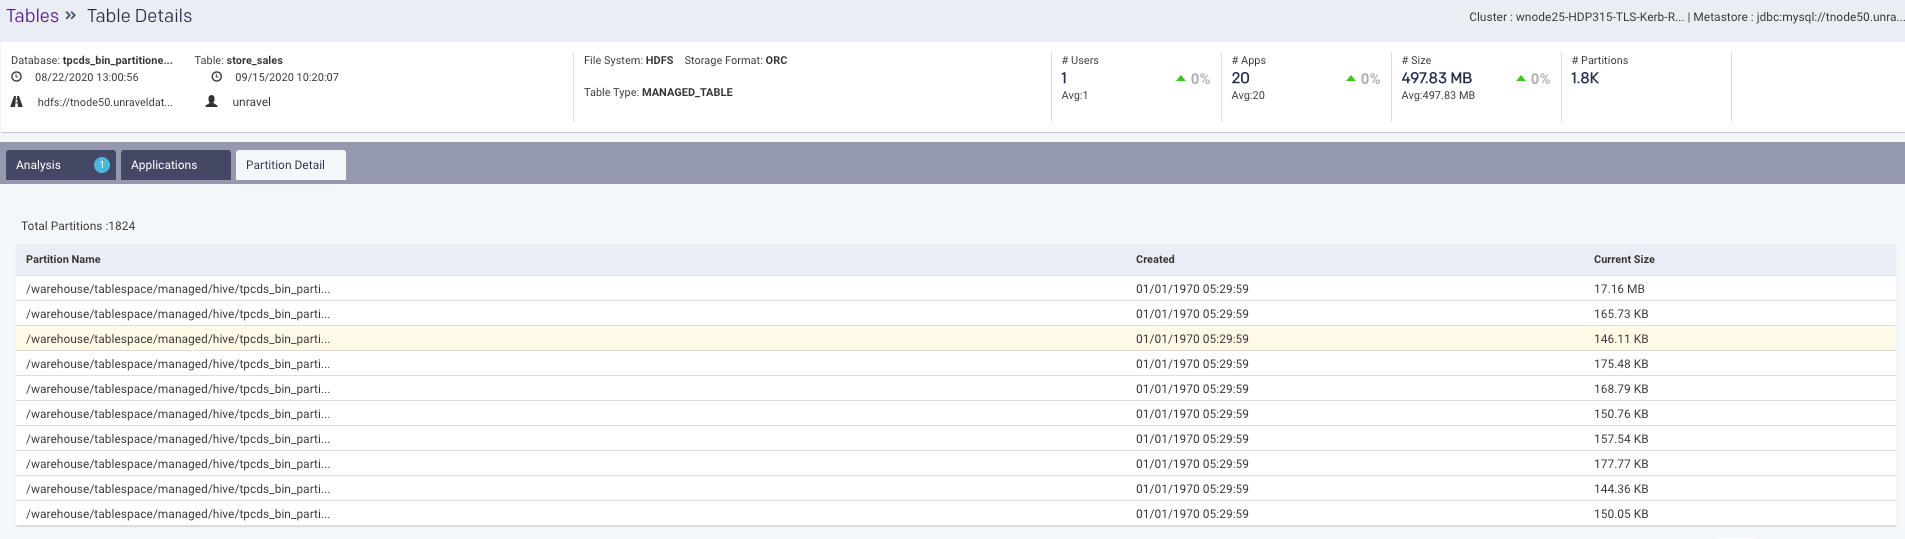
Viewing more information
Click to view more details of the table. The following Table Details page is displayed.
This page displays all the metadata as shown in the Tables tab along with the following tabs:
Analysis: This tab provides recommendations and insights for the selected table.
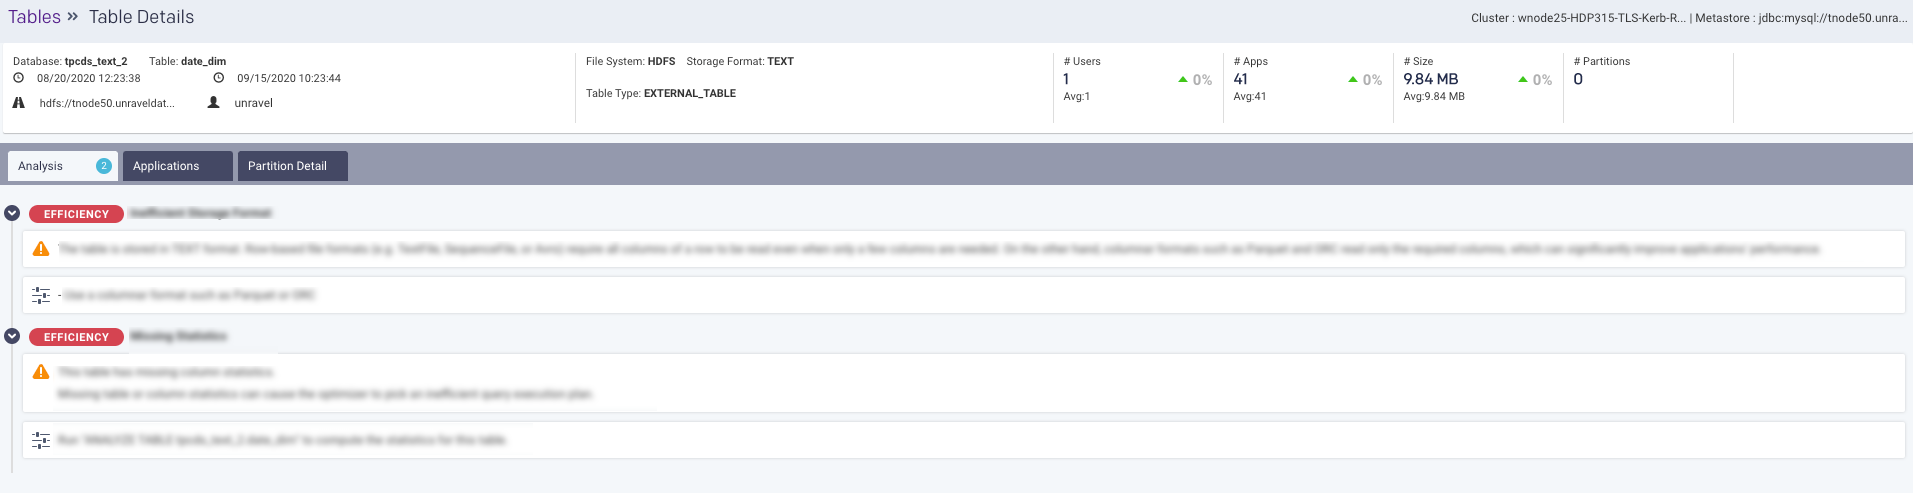
Applications: This tab provides the list of applications that are accessing the selected table and their corresponding details.
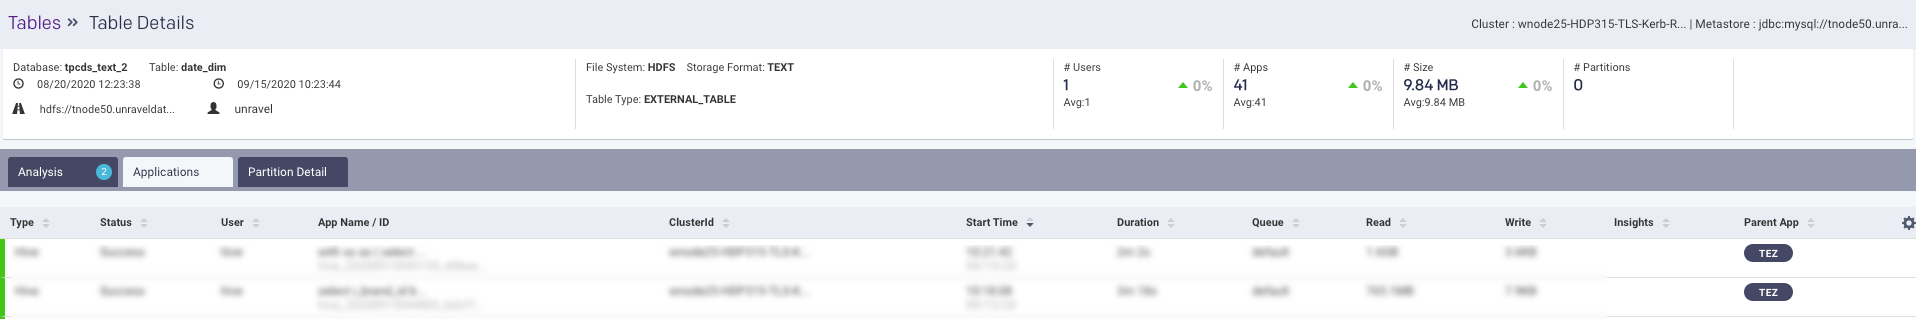
Partitions Detail: This tab displays all the details of the partitions in the selected table. All the partitions are listed along with the name of the partition, the date when the partition was created, and the current size of the partition.
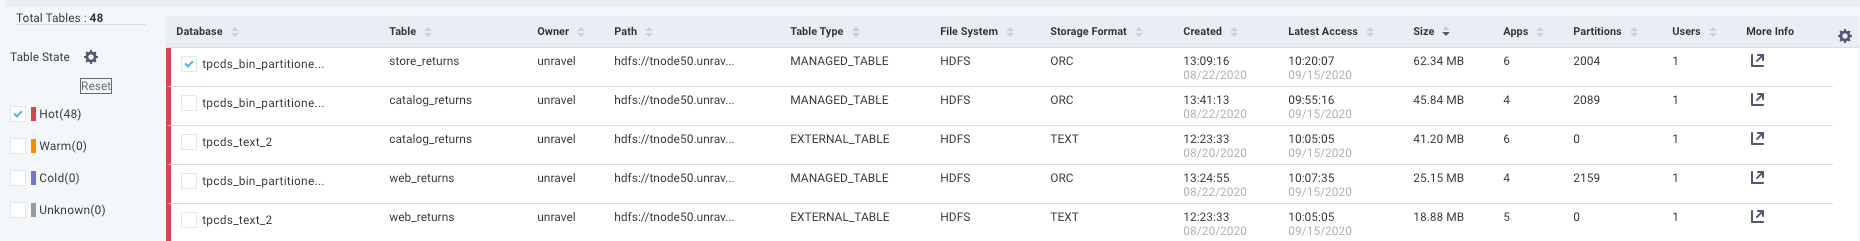
Searching and filtering tables
You can filter the tables using the heat map labels.
Go to Data > Tables > Table state section.
From the Table State in the left, select any of the following heat labels:
The tables matching the corresponding heat labels are listed in the table. Here, the Hot option was selected, the corresponding tables, that are color-coded with a red line on the left, are shown. Click the Reset button to discard the filters.
Optionally, you can define the heat labels for the table, click
in the Table State section. The Label Tables dialog is displayed.Move the color-slider to set the period for the tables to be defined under a specific color-coded heat label.
In the Search box, you can enter the name of the table and click  , the corresponding tables are displayed.
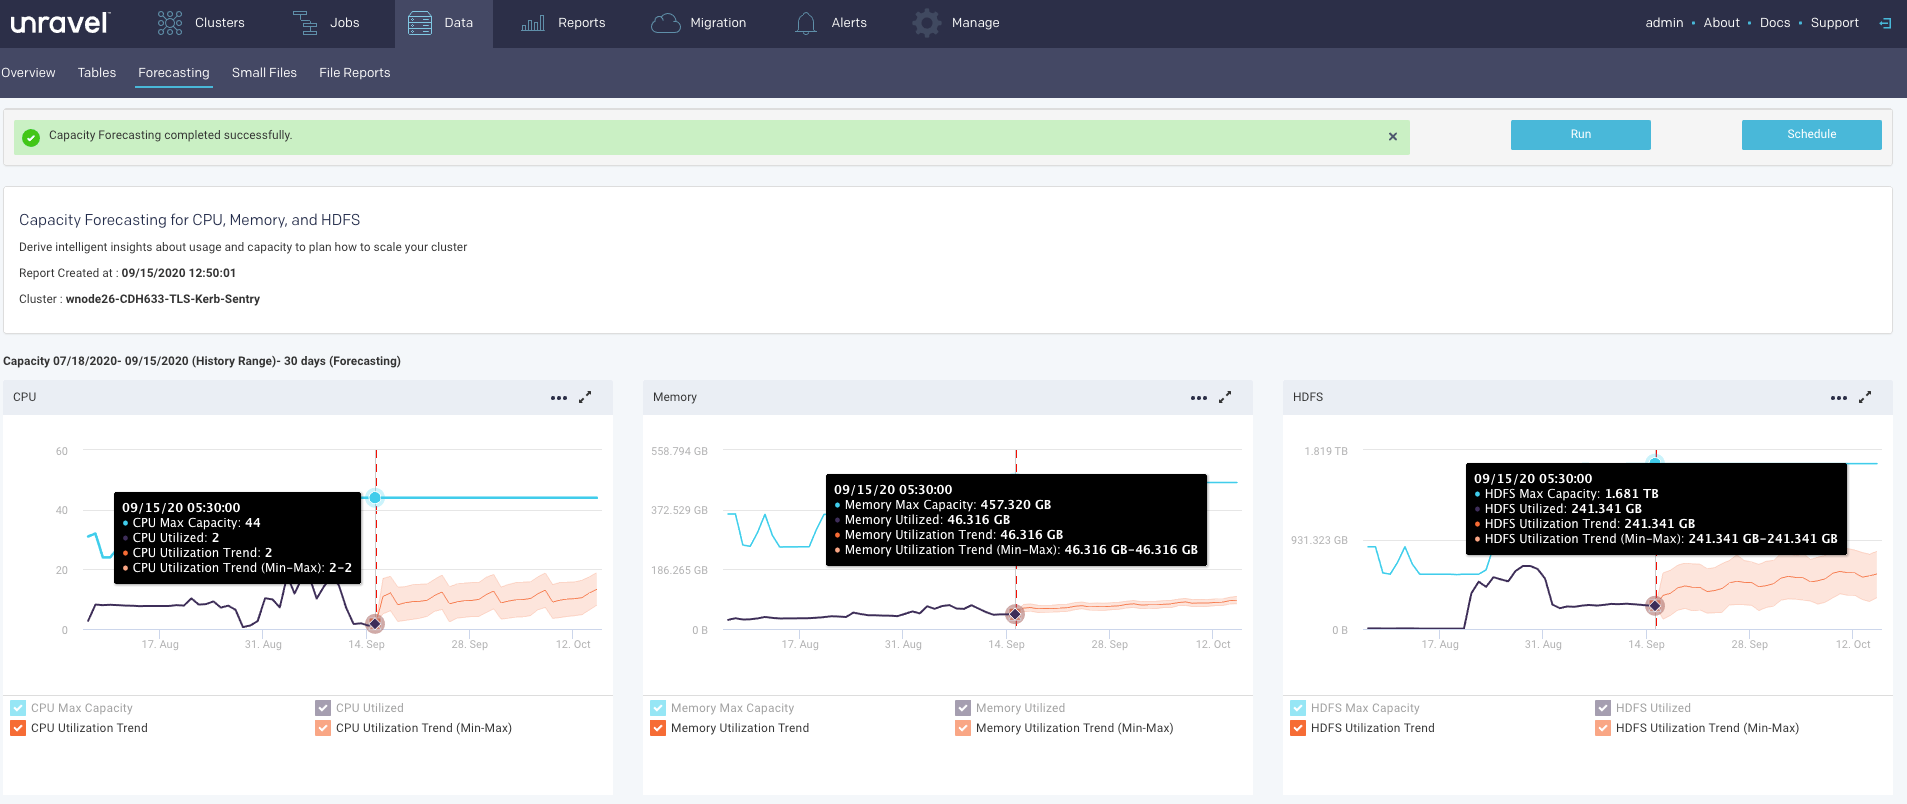
Forecasting
Note
This report currently works only on Cloudera (CDH) and Hortonworks (HDP).
Forecasting report helps you with capacity planning for your hardware (CPU, Memory) and HDFS by analyzing your historical usage to predict usage trends. This can help you to plan and allocate your disk resources effectively. Each time you create a report, Unravel stores the new data allowing you to generate reports based upon a larger pool of data for more accurate forecasting. By default, the last forecasting report is displayed.
All reports, whether scheduled or ad hoc, are archived. Successful reports can be viewed or downloaded from the Report Archives tab.
Configuring the Forecasting report
Stop Unravel
<Unravel installation directory>/unravel/manager stop
Set the Forecasting report properties as follows:
<Unravel installation directory>/unravel/manager config properties set
<property><value>##For example: /opt/unravel-install/unravel/manager config properties set com.unraveldata.capacityforecasting.hdfs.entitynames hdfsdevns1Refer to Forecasting report properties for the complete list of properties that must be configured for this report.
Apply the changes.
<Unravel installation directory>/unravel/manager config apply
Start Unravel
<Unravel installation directory>/unravel/manager start
Generating Forecasting report
Click the
 button to generate a new report. The parameters are:
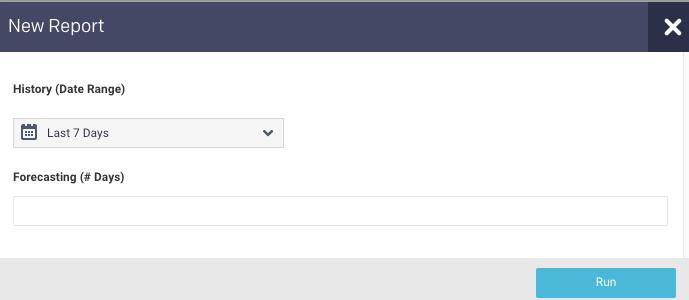
History (Date Range): Use the date picker drop-down to specify the date range to analyze the past trend for the forecasting report.
Forecasting Specify the number of days for forecasting.
Click Run to generate the report.
The progress of the report generation is shown on the top of the page.
A light green bar appears when the report was successful and results are displayed. Upon failure, the bar is light red and the New Report button turns orange.
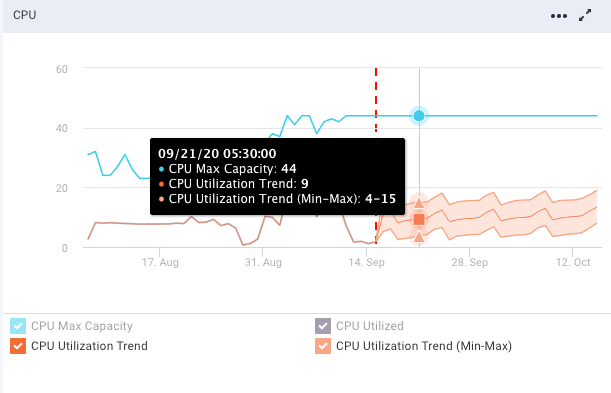
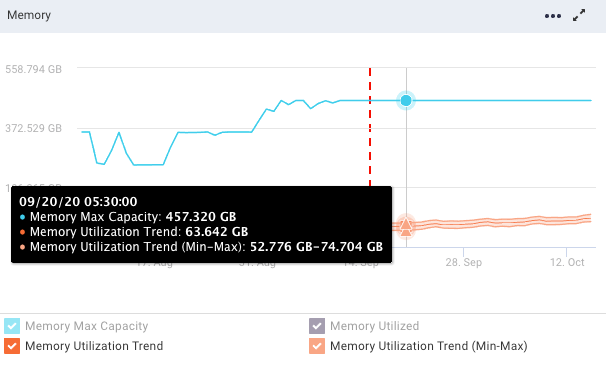
These graphs display the trend (orange line) from the historical range start-date to the forecast range end-date (x-axis). The trend shows the upper and lower bounds for predicted values. Refer to the trend lines. The y-axis is determined by your actual physical CPU, memory, and disk capacity. Click
 to download the graph in a JSON or CSV format. Click
  to expand all the graphs to full width.
The following capacity forecasting reports are generated:
CPU
Memory
HDFS
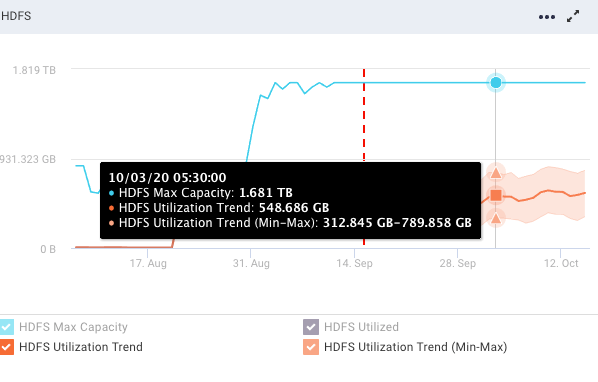
Refer the following table for the trend lines:
Trendline
Description
Vertical dotted line
The vertical dotted line separates the regions of the historical usage/capacity and the predicted usage/capacity.
Blue line
The blue line shows the total capacity. The total capacity is extrapolated from the last observed capacity.
Black line
The black line shows the historical usage.
Orange line
The orange line shows the historical usage trends and the predicted usages with lower and upper bounds.
Scheduling Capacity Forecasting report
Click
 to generate the report regularly and provide the following details:
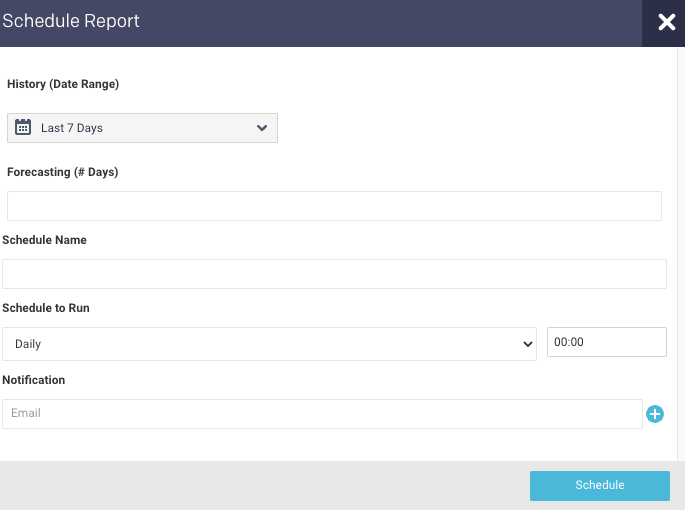
History (Date Range): Use the date picker drop-down to specify the date range to analyze the past utilization trend for the forecasting report.
Forecasting Specify the number of days for forecasting.
Schedule Name: Name of the schedule.
Schedule to Run: Select any of the following schedule option from drop-down and set the time from the hours and minutes drop-down:
Daily
Selected a day in the week.(Sun, Mon, Tue, Wed, Thu, Fri, Sat)
Every two weeks
Every month
Notification: Provide email IDs to receive the notification of the reports generated.
Click Schedule
Small files
Note
These reports are currently available only for CDH, CDP, and HDP platform and require HDFS administrator privileges. If you can't grant HDFS administrator privileges to the user unravel, refer to configuring FSimage.
Each small file is accessed by a single mapper. Therefore, a large number of small files can lead to a large number of mappers. Mappers are costly to run and drive up your app's costs. This report helps you identify users who create/use an excessive amount of small files.
You can use this information to take corrective action, such as:
Combine multiple files into large files.
Notify, limit, or block users who create or use an excessive amount.
Taking actions:
Corrects and prevents future performance degradation.
Lowers your costs to run apps.
The tab opens displaying the last successfully generated report if any. It is sorted in descending order of the total number of small files in the directory. The report's parameters are listed above the table headings. You can search the table by path list, any path matching or containing the search string is displayed.
All reports, whether scheduled or ad hoc, are archived. Successful reports can be viewed or downloaded from the Report Archives tab.
Configuring the Small files report
Stop Unravel
<Unravel installation directory>/unravel/manager stop
Set the Small files report properties as follows:
<Unravel installation directory>/unravel/manager config properties set
<property><value>For example: /opt/unravel-install/unravel/manager config properties set com.unraveldata.ngui.sfhivetable.schedule.interval 2dRefer to Small files and Small files and Files reports for the complete list of properties that can be configured for the Small files report.
Apply the changes.
<Unravel installation directory>/unravel/manager config apply
Start Unravel
<Unravel installation directory>/unravel/manager start
Generating Small Files report
Click the
button to generate a new report. The parameters are: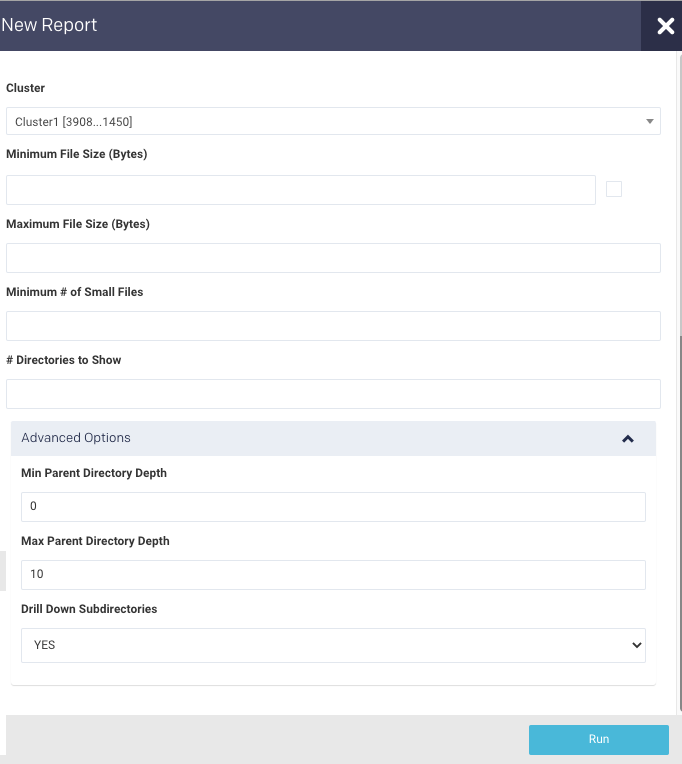
Cluster: In a multi-cluster setup, you can select the cluster for which you want to generate the report.
Minimum File Size (bytes)/ Maximum File Size byte: Only those files whose size ranges between the minimum and maximum file size specified will be counted for the report.
Minimum # of Small Files: Minimum number of files in a directory matching the above size criteria. The directories fulfilling this criterion are selected for the report.
# Directories to Show: This is the maximum number of directories to display.
Advanced Options:
Min parent directory depth: Minimum depth to start at, that is root + x descendants, i.e., 0=root, 1=root's children (/one), etc.
Max parent directory depth: Maximum depth to end at, that is root + x descendants, i.e., 1=root's children (/one), 2=root's grandchildren, (/one/two), etc.
Drill down sub-directories: Determines how the files are accounted in the file system hierarchy. Yes (default): Accounts the file size to all its ancestor's directories. No: Accounts the file size to its parent directory.
Note
Min parent directory depth and Max parent directory depth must be between 0 and 50.
Click Run to generate the report.
The progress of the report generation is shown on the top of the page.
A light green bar appears when the report was successful and results are displayed. Upon failure, the bar is light red and the New Report button turns orange.
Click
 to download the current report that is displayed.
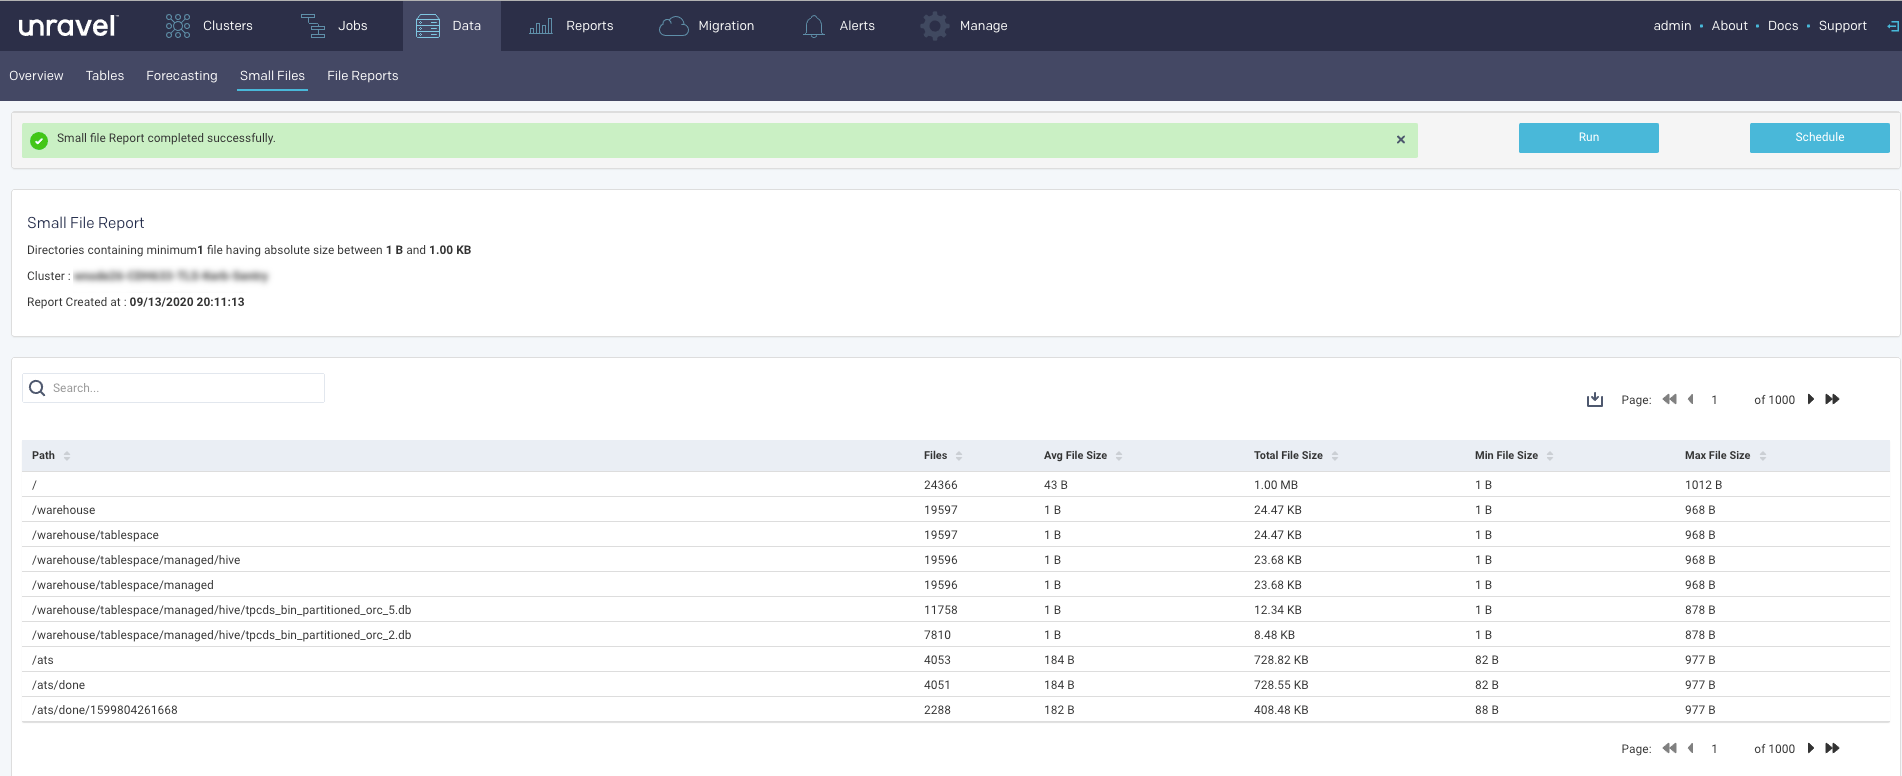
Scheduling Small files report
Click Schedule to generate the report regularly and provide the following details:
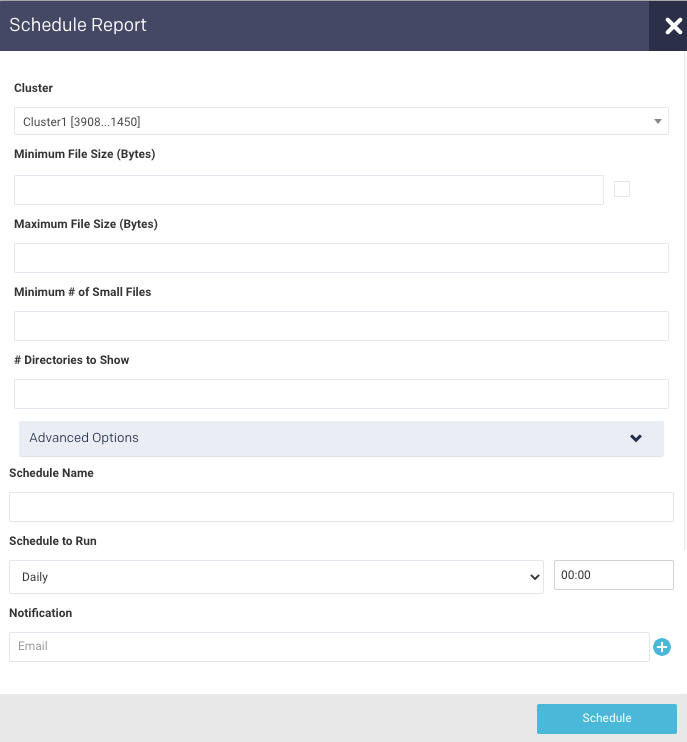
Schedule Name: Name of the schedule.
Schedule to Run: Select any of the following schedule options from the drop-down and set the time from the hours and minutes drop-down:
Daily
Weekdays (Sun-Sat)
Every two weeks
Every month
Notification: Provide an email ID to receive the notification of the reports generated.
Click Schedule
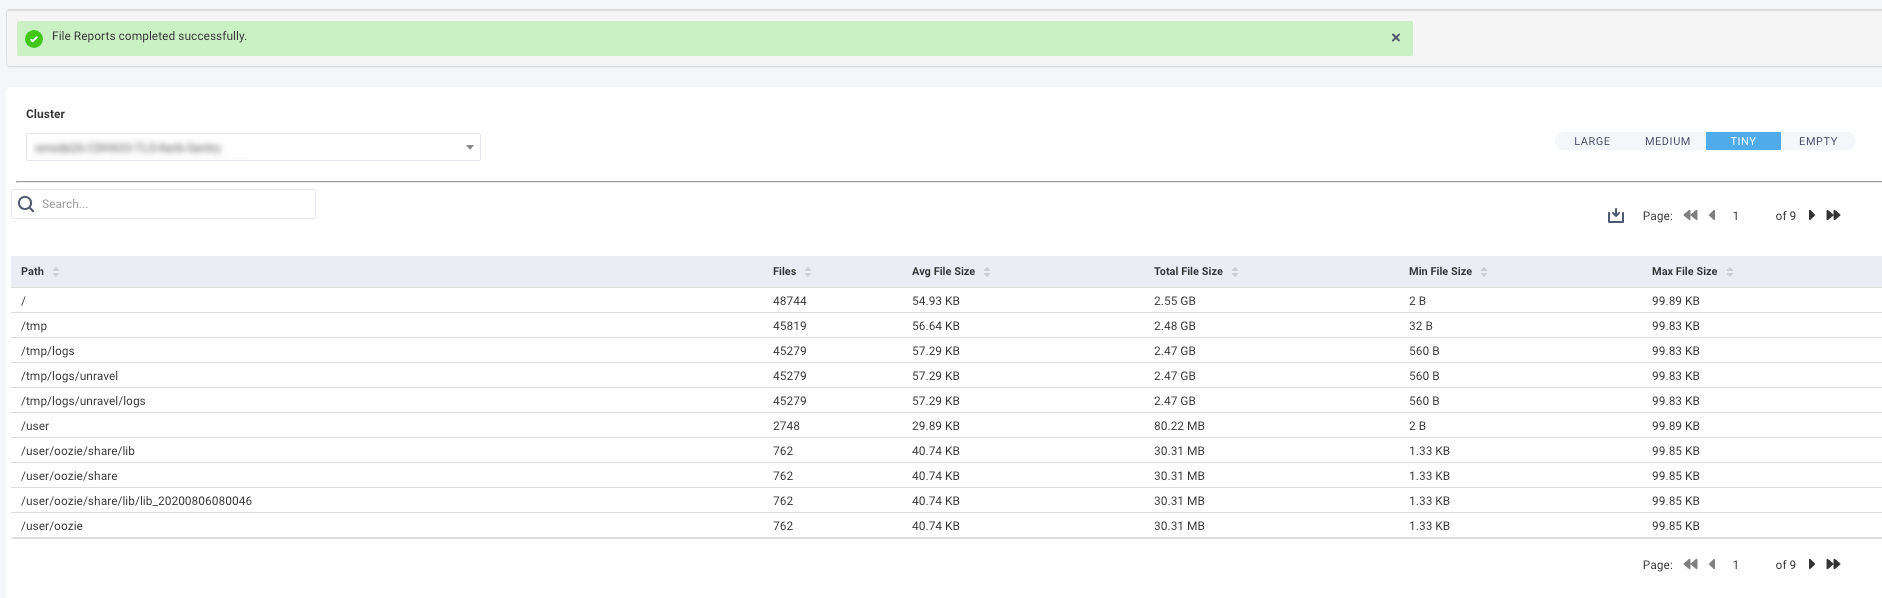
Files report
Note
These reports are currently available only for CDH, CDP, and HDP and require HDFS administrator privileges. If you can't grant HDFS administrator privileges to the user unravel, refer to configuring FSimage.
This report is the same as the Small Files report except they are automatically generated using the File Reports properties. By default, these reports are updated every 24 hours and are archived.
The default size for the files are:
Large is any file with more than 100 GB size,
Medium is any file with 5 GB - 10 GB size.
Tiny is any file with less than 100 KB size.
Empty is a file with 0 bytes.
Configuring the Files report
Stop Unravel
<Unravel installation directory>/unravel/manager stop
Set the File report properties using any of the following options.
Option 1
Create a file containing the properties of Files report that you want to configure and their corresponding values. For example:
unravel.python.reporting.files.huge.files.min.parent.dir.depth=2
unravel.python.reporting.files.huge.files.max.parent.dir.depth=5
unravel.python.reporting.files.huge.files.min.files=3
unravel.python.reporting.files.huge.files.threshold.size=1024* 1024* 1024
unravel.python.reporting.files.huge.files.top.n.dirs=300
unravel.python.reporting.files.huge.files.use.avg.file.size.flag=true
From the installation directory, where Unravel binaries are installed, run the following command and provide the path to the properties file.
<Unravel installation directory>/unravel/manager config properties import <path to the properties file>

##For example:
/opt/unravel-install/unravel/manager config properties import /opt/properties.txt
Option 2
From the installation directory, where Unravel binaries are installed, set the properties as follows:
<Unravel installation directory>/unravel/manager config properties set
<property><value>##For example: unravel.python.reporting.files.huge.files.min.parent.dir.depth 2 unravel.python.reporting.files.huge.files.max.parent.dir.depth 5 unravel.python.reporting.files.huge.files.min.files 3 unravel.python.reporting.files.huge.files.threshold.size 1024* 1024* 1024 unravel.python.reporting.files.huge.files.top.n.dirs 300 unravel.python.reporting.files.huge.files.use.avg.file.size.flag trueRefer to Files reports for the complete list of properties that can be configured for this report.
Apply the changes.
<Unravel installation directory>/unravel/manager config apply
Start Unravel
<Unravel installation directory>/unravel/manager start
Viewing the Files report
Go to Data > File Reports.
In a multi-cluster setup, you can select the cluster from the Cluster drop-down.
Click any of the following buttons on the right:
LARGE
MEDIUM
TINY
EMPTY
The reports corresponding to the buttons are displayed. Click
to download the report in CSV format. You can use string to search the report.