Optimizing the performance of Spark apps
Unravel's Web UImakes it easy for you to identify under-performing Spark apps: click Operations > Dashboard, and scroll down to Inefficient Applications.
The following case illustrates the performance of a Spark app before and after tuning it based on Unravel's performance analysis:
Before tuning
Before tuning, Unravel Web UI indicated that this app had a running duration of 34 min 11sec:
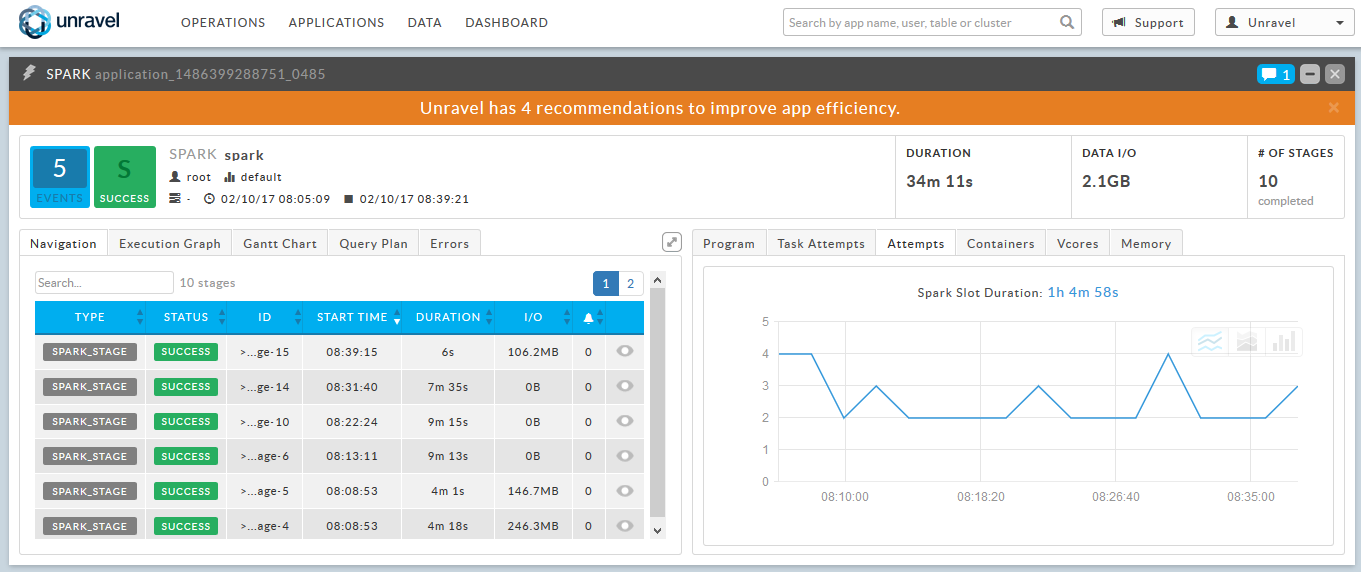
In addition, Unravel Web UI captured details as shown in the following events:
Low utilization of memory resources.
Low utilization of Spark storage memory.
Contention for CPU resources.
Opportunity for RDD caching.
Save up to 9 minutes by caching at PetFoodAnalysisCaching.scala:129,with StorageLevel.MEMORY_AND_DISK_SER
Too few partitions w.r.t to available parallelism.
Change executor instances from 2 to 127, partitions from 2 to 289, adjust driver memory (to 1161908224)and yarn overhead (to 819 MB).
After tuning
After tuning, Unravel's Web UI indicates that this app now has a running duration of 1min 19sec:
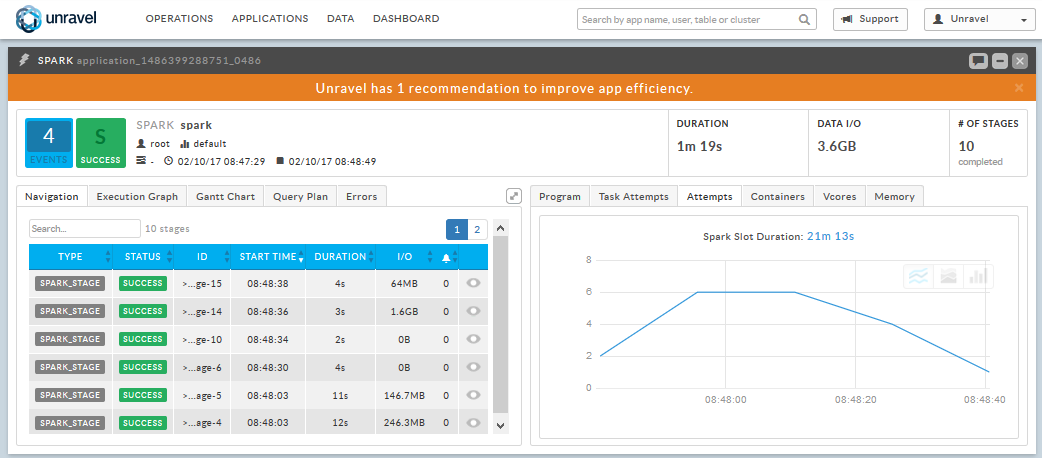
Unravel Web UI displays these events:
Low utilization of memory resources.
Low utilization of Spark storage memory.
Large idle time for executors.
Too few partitions w.r.t to available parallelism.
Change executor instances from 127 to 138