Impala details page
The Impala APM provides a detailed view into the behavior of Impala queries.
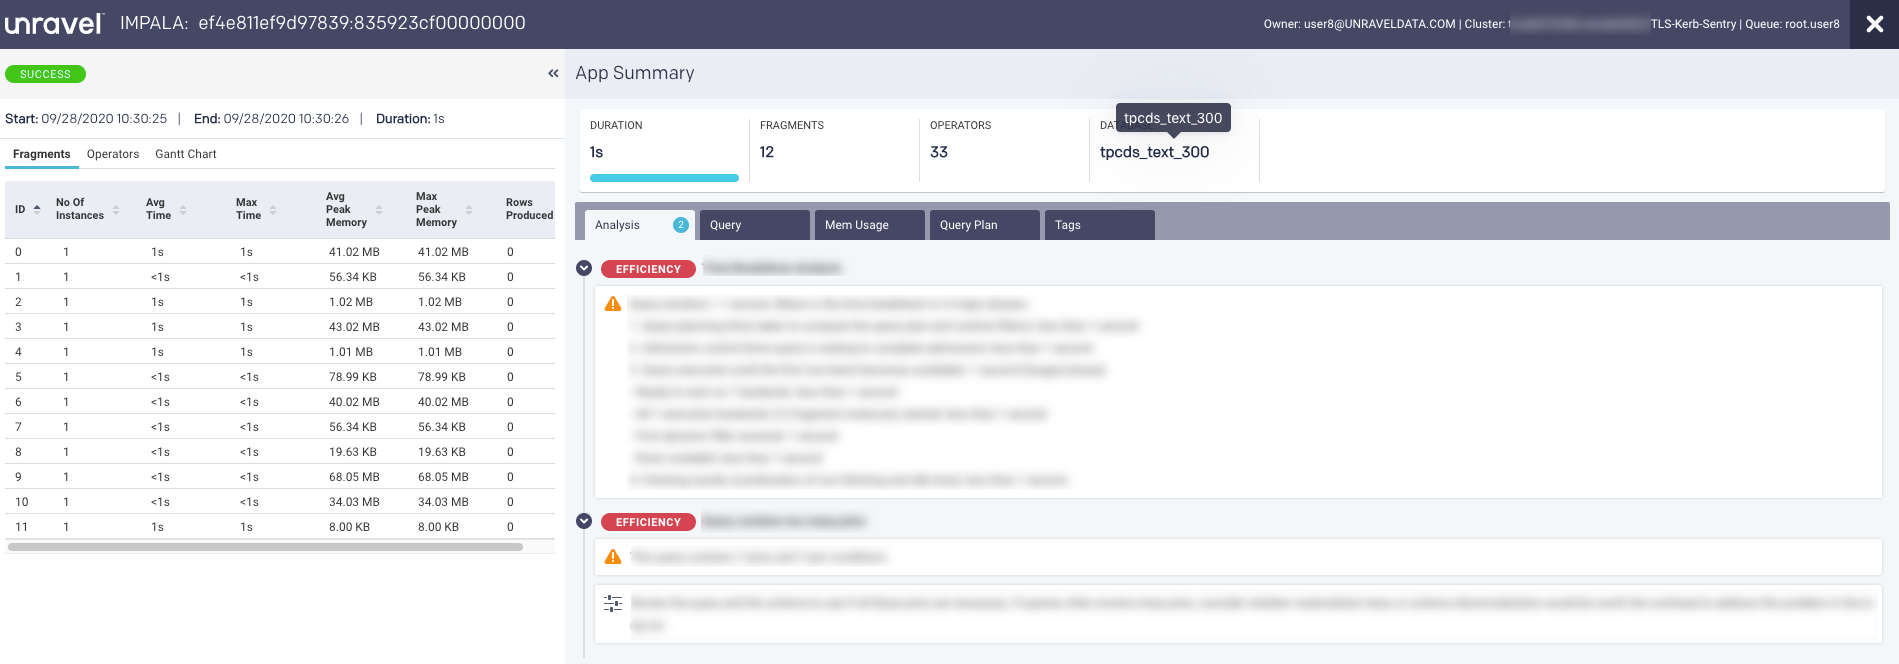
Key performance indicators
Events: The number, if any, of Unravel insights for this query.
Duration: Total time taken by the query.
Data I/O: Total data read and written by the query.
Number of Fragments: Total number of query fragments.
Number of Operators: Total number of operators in this query.
Left tabs
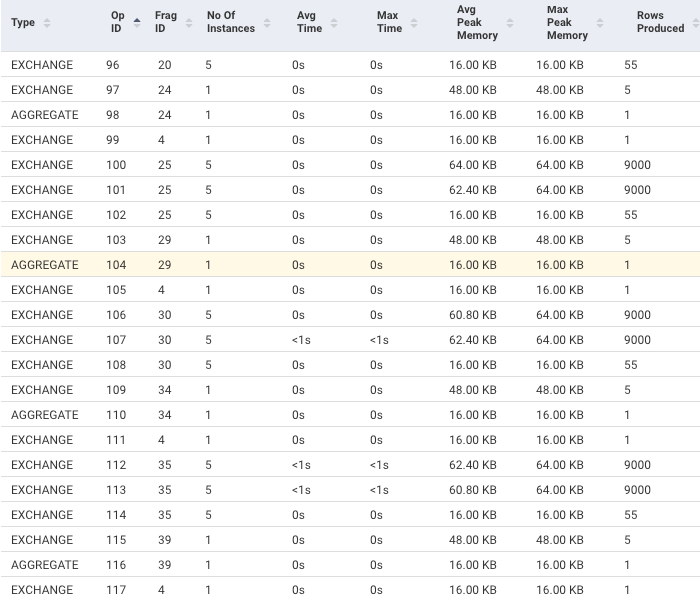
Fragments: Displays a table with information about each fragment associated with this query. Click More to expose the Fragments operators and Less to hide them. The coordinator fragment (
 ) is always the nth fragment.
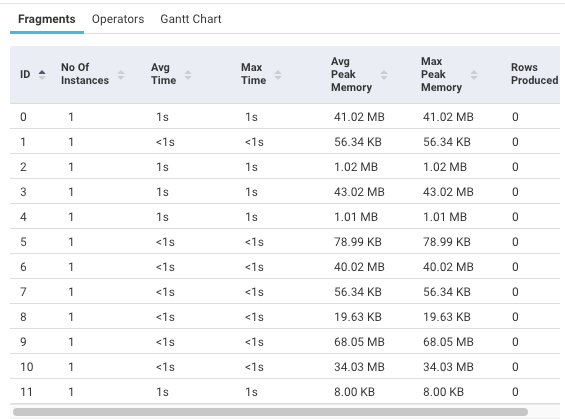
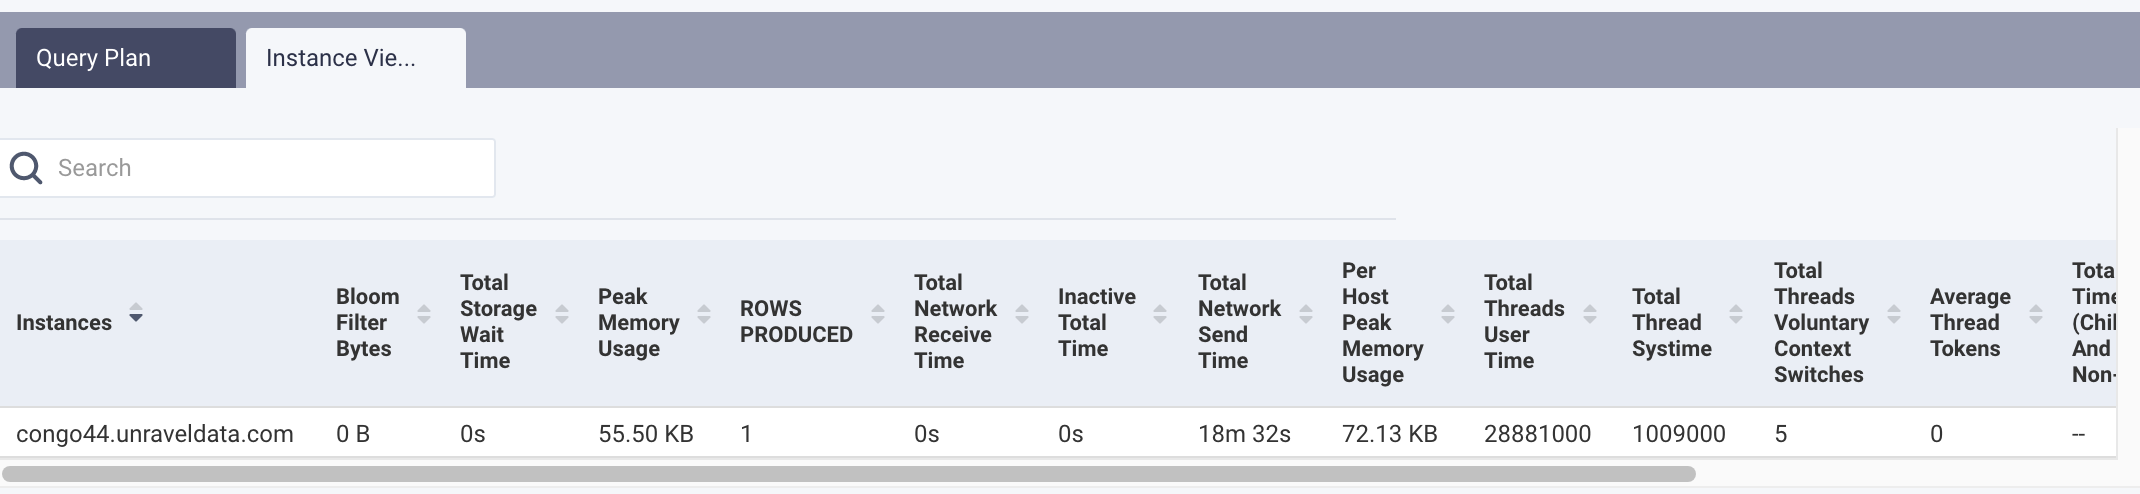
This window shows the Fragment and its KPIs. It defaults to the table of the Fragment's Operators with the associated KPIs for the operations. Clicking the operator brings up the operator window. (See Operators for more information.) You can view the Query Plan or the Instance View.
Instance View: Lists each instance with its KPIs.
Operators: Displays a list of all operators for all fragments. You can search the operator's name. Click the operator to display its details.
Scan HDFS details

Aggregate details

Exchange details

Hash Join

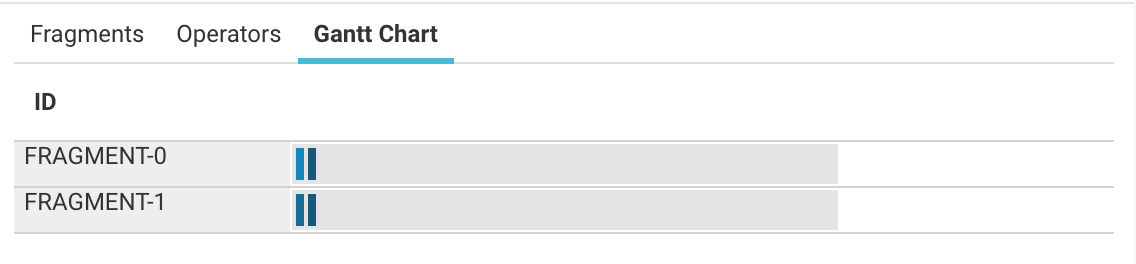
Gannt Chart: Charts the fragments and the time spent on each operation. Hover over a section to see the operation and its KPIs.
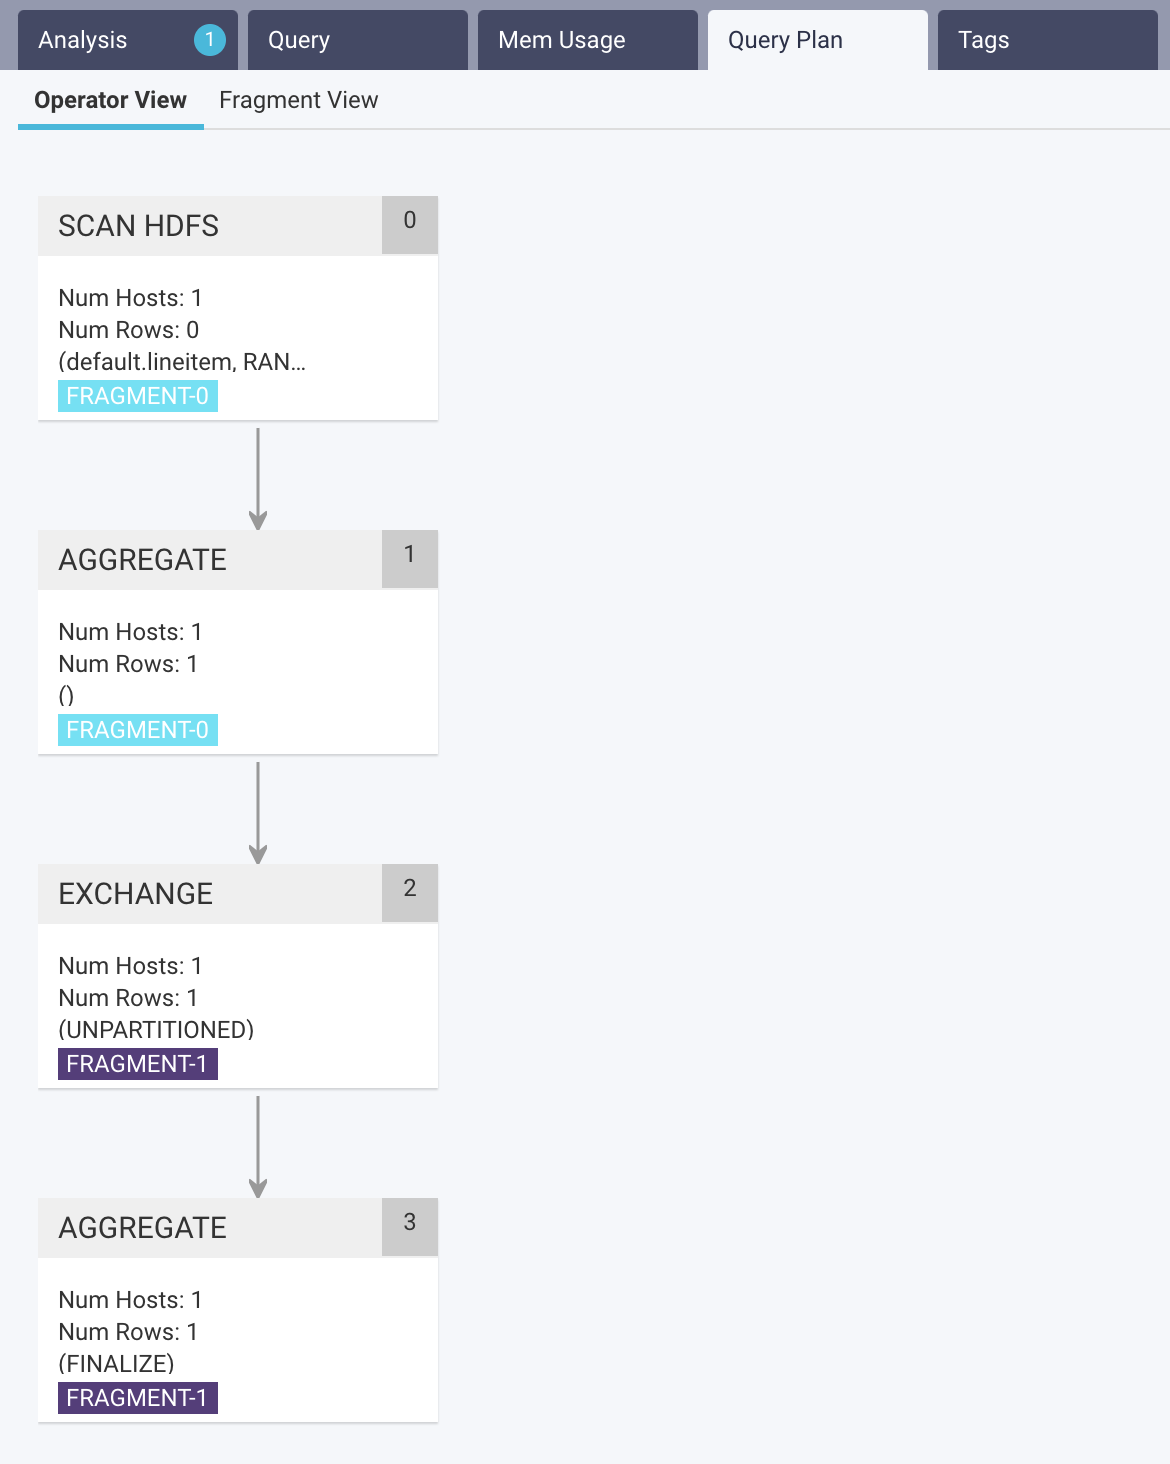
Query plan: Shows the query plan in fragment or operator view. Both the fragment and operator view are shown here. Hover over the operator to get detailed information. Click the button to switch views.
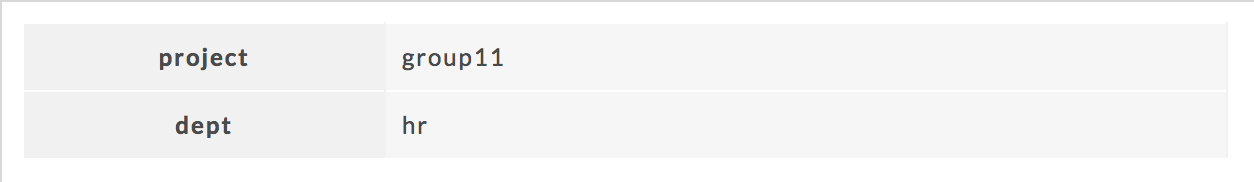
Tags: The defined tag keys and values for the app. This example has two tag keys, project and dept , with each having one value, group11 and hr , respectively.
Right tabs
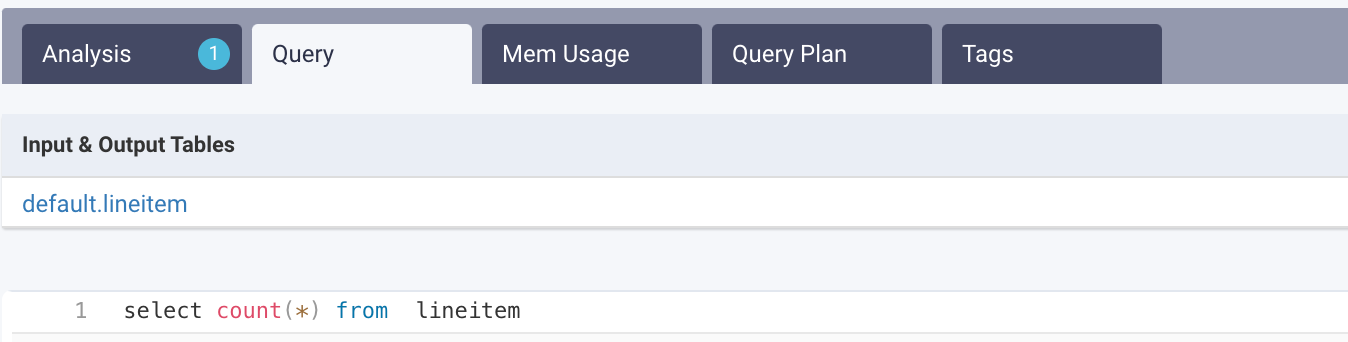
Query: Shows the query plan code. Click Query Copy to copy the query. See Impala APM image above for the Query Tab.
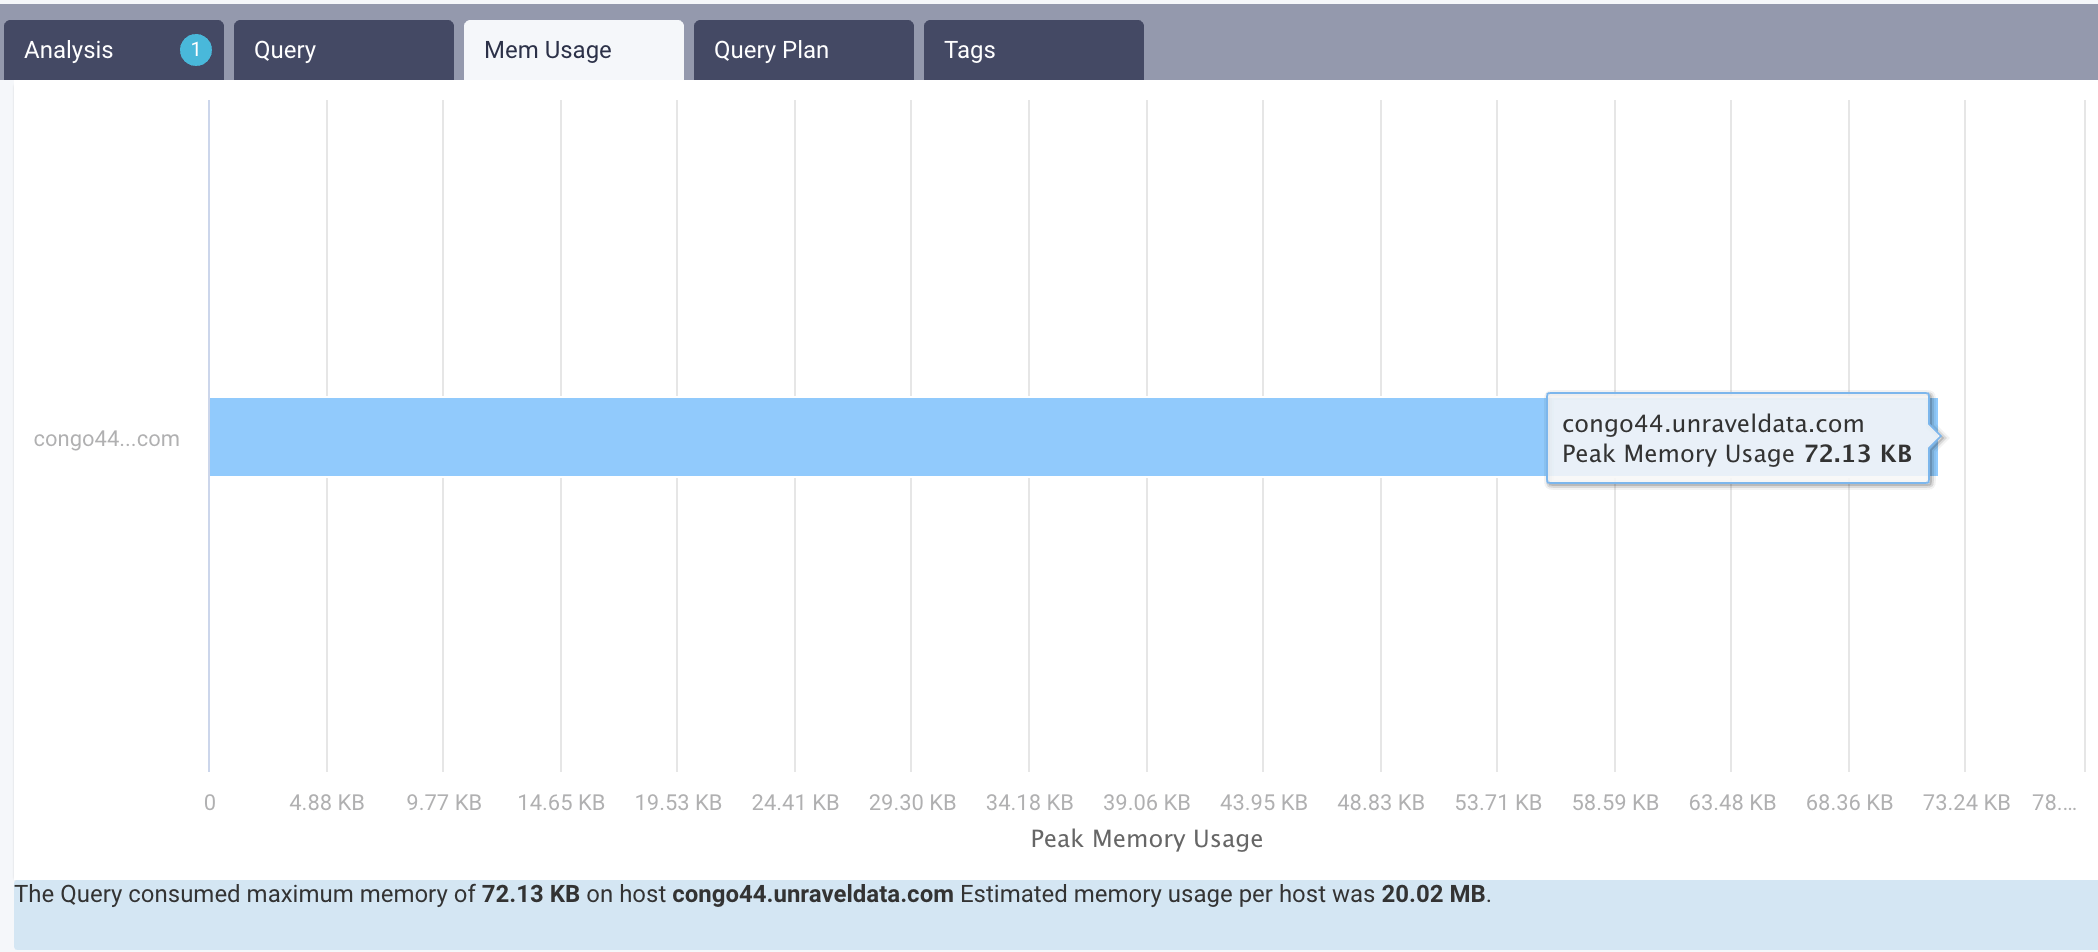
Mem Usage: Graphs the Memory Usage by peak usage. Notes the maximum memory used on what host and the estimated memory per host.