AWS EMR Cost and Wastage Report
A report to analyze the spending and wastage on AWS - Elastic Map Reduce (EMR). You can create this report either from the UI or the command line. You can analyze various costs incurred in running EMR clusters on AWS.
Note
The AWS EMR Cost and Wastage report is compatible only with Unravel 4.7.8.0 version.
Click Generate Reports > New button.
In the New Report dialog box, enter the following details.
Items
Description
General
Name
Name of the report.
Environment
Select your platform. The reports corresponding to the selected platform are only listed in the Report type. If you select the All option, all the reports are listed.
Report type
Type of report. Select AWS EMR Cost and Wastage Report.
Schedule
Select the checkbox to schedule the report to run daily, hourly, weekly, or monthly. You can also set the schedule can using a cron expression. You can expand the Example drop-down and select the corresponding options. The next four sample run times are displayed for reference.
Retention
The number of days to retain the report files. All the reports are stored in the
unity-one/src/assets/reports/jobsdirectory. After completion of the retention period, the report files are automatically purged.Parameters
Look Back
The period ranges in days when applications can be selected for report generation. A notification is displayed above this option that informs about the duration when data is available for the report.
Use Exact Date-Time
Check this option and select the from and to dates to schedule the report for the exact time range specified. The only anomaly with this option is that the same report will be scheduled to be generated repeatedly.
Tags
Specify the Key-Value pair for the tags. You can add or remove a pair. This is a mandatory field.
TopK
Specify the top number of applications, which you want to be included in the report. This is a mandatory fie
Tags cost threshold($)*
Specify a cost threshold for the tags in USD. If the cost exceeds the specified threshold, it will indicate an increase. The default value is 10 USD.
Tags average idle time threshold(%)*
Specify a threshold in percentage for the average duration of idle time for tags. The default value is 50.
Cpu idle utilization threshold(%)*
Specify a threshold in percentage for the idle utilization of the CPU. The default value is 30.
Memory idle utilization threshold(%)*
Specify a threshold in percentage for the idle utilization of memory. The default value is 30.
Notifications
Email to
Email ID to send the notification when the report is generated. You can specify multiple email IDs with comma separation. You can also select the Attach Files to Email checkbox to receive the reports as an attachment.
Advance Options
Profile Memory
Select this option if you want to generate logs that help to troubleshoot scenarios where the report takes excessive time to generate or fails to generate.
Caution
The option will increase the report run time excessively.
Click OK. The generated reports will be listed under Reports on the App UI.
Select the generated report and then click Run. After the report is successfully run, the details of the report runs are listed in the Run box on the right.
Click the following:
HTML files link to view the report details.
Input parameters link to view the parameters you chose to run the report.
Log file link to view the logs of the report.
From the terminal, change directories to
unity-one/srcdirectory.cd /opt/unravel/data/apps/unity-one/src
Use a screen editor, such as vi editor, to edit the
job.jsonfile and copy-paste the following text into the file.{ "enabled": false, "retention_days": 30, "profile_memory": false, "report_type": "aws_emr_cost", "params": { "start_date": null, "end_date": null, "days": 30, "topk": 20, "cpu_idle_threshold": 30, "memory_idle_threshold": 30, "tags_cost_threshold": 10, "cluster_idle_time_threshold": 50, "all_filters": { "Pillar": null, "username": null } }, "notifications": {} }Parameters
Description
start_date
Can be null or a valid start date.
end_date
Can be null or a valid start date.
days
The number of days to look back while downloading data.
topk
The number of applications to be shown in the report.
cpu_idle_threshold
The threshold in percentage for the idle utilization of the CPU.
memory_idle_threshold
The threshold in percentage for the idle utilization of memory.
tags_cost_threshold
The cost threshold for the tags in USD.
cluster_idle_time_threshold
The threshold in percentage for the idle time utilization of clusters.
all_filters
Filter options.
Save and exit the screen editor.
Run the following command to generate the report:
./unity-cli.sh report generate job.json awsEmrCost true
The AWS EMR Cost and Wastage report display the following sections:
This section provides detailed insights into the AWS EMR cost and wastage.
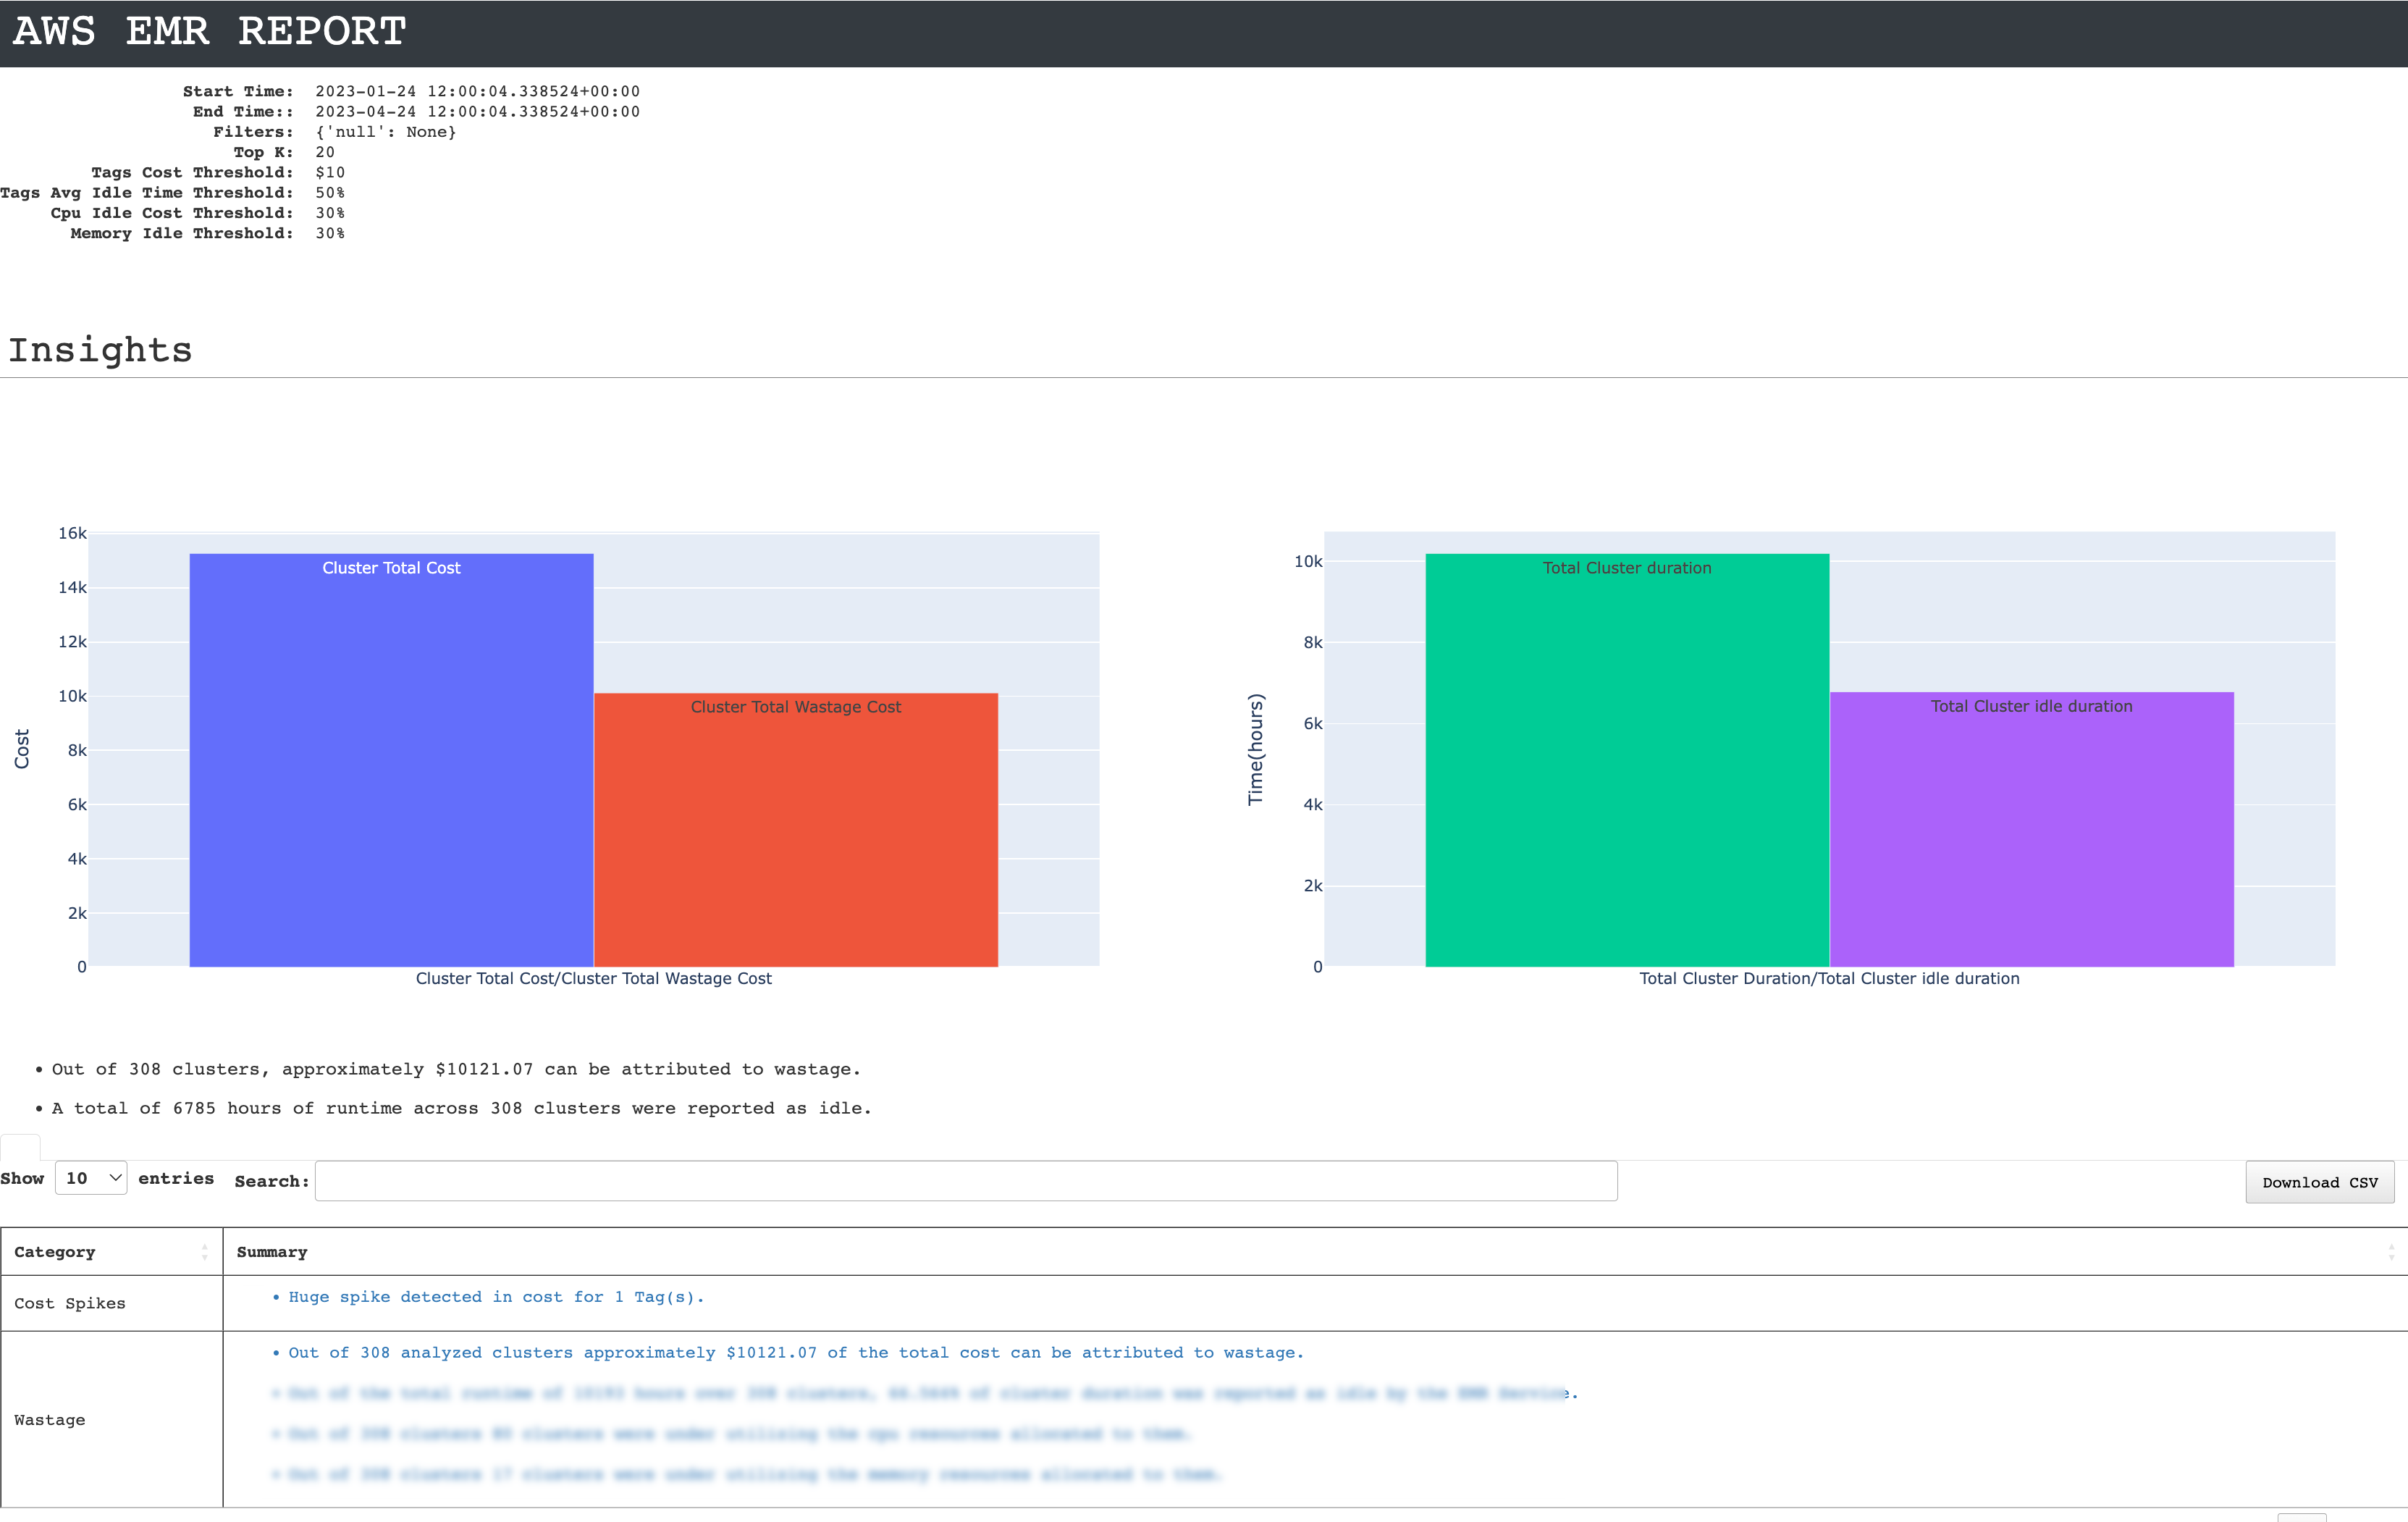
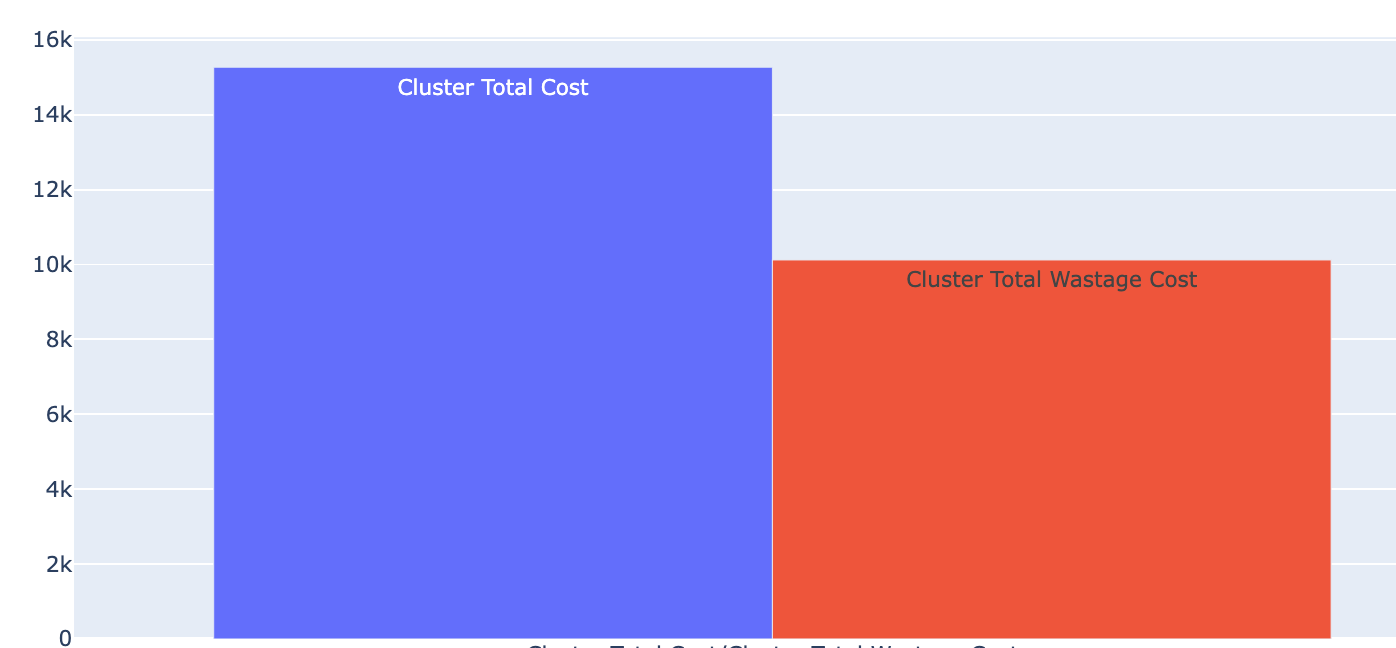
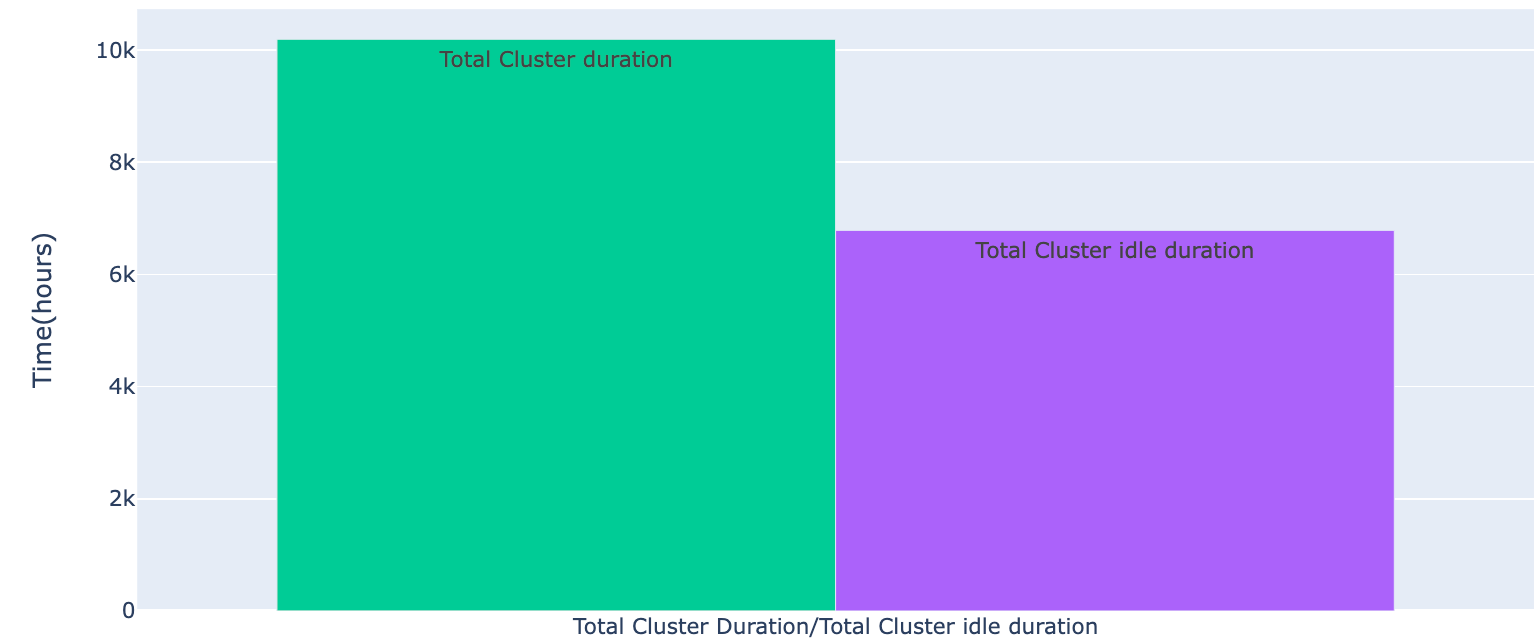
The total cluster cost and wastage in terms of expenditure and duration are plotted on the trend graph for the specified time period.
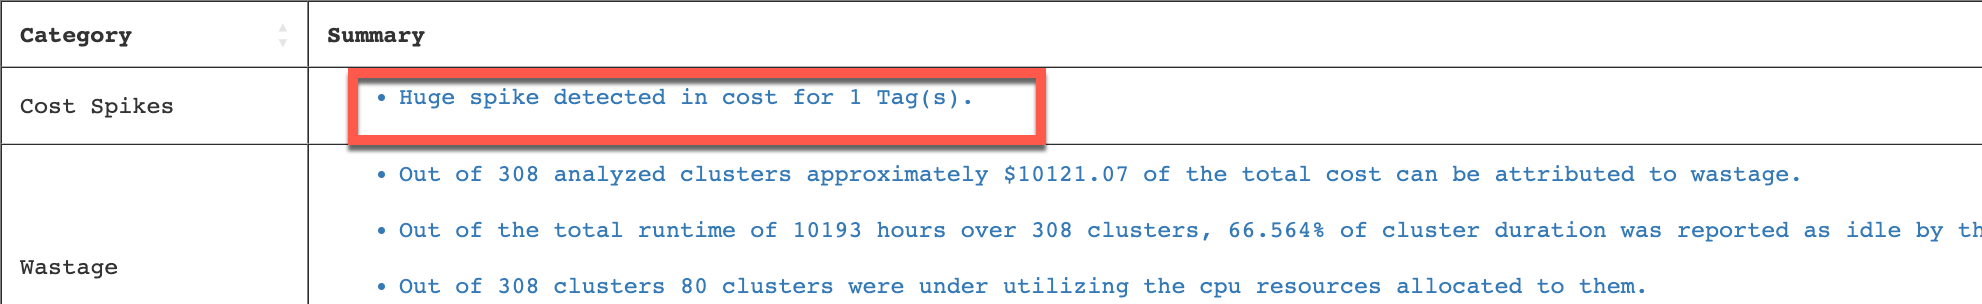
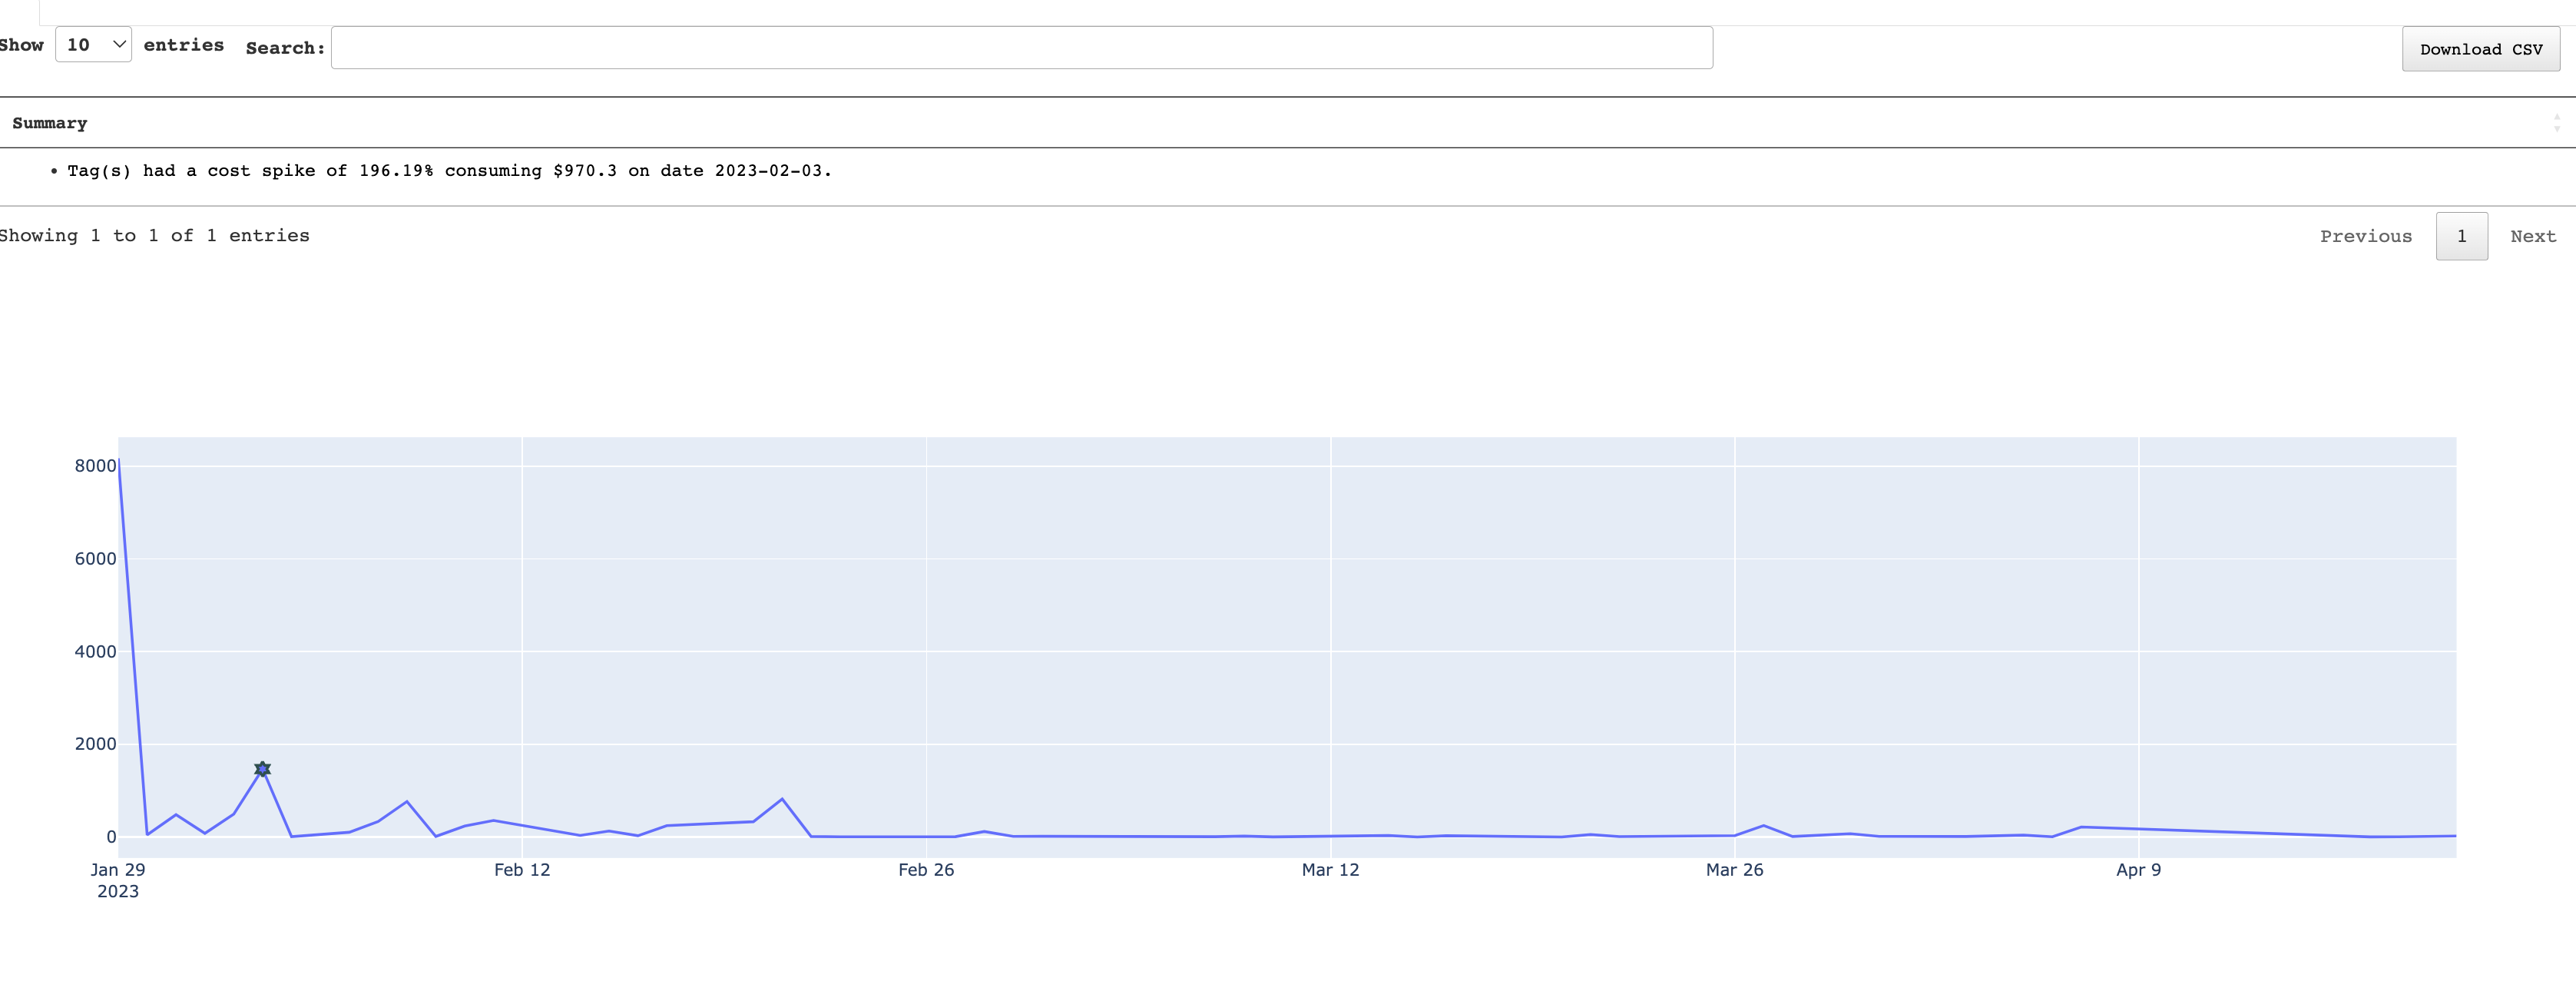
Insights are provided for cost spikes and wastages in the clusters. Click a link in the summary column to view the specifics of the insight alongwith a detailed trend graph, which plots the cost spikes and wastages. You can also download the CSV of the insights summary.
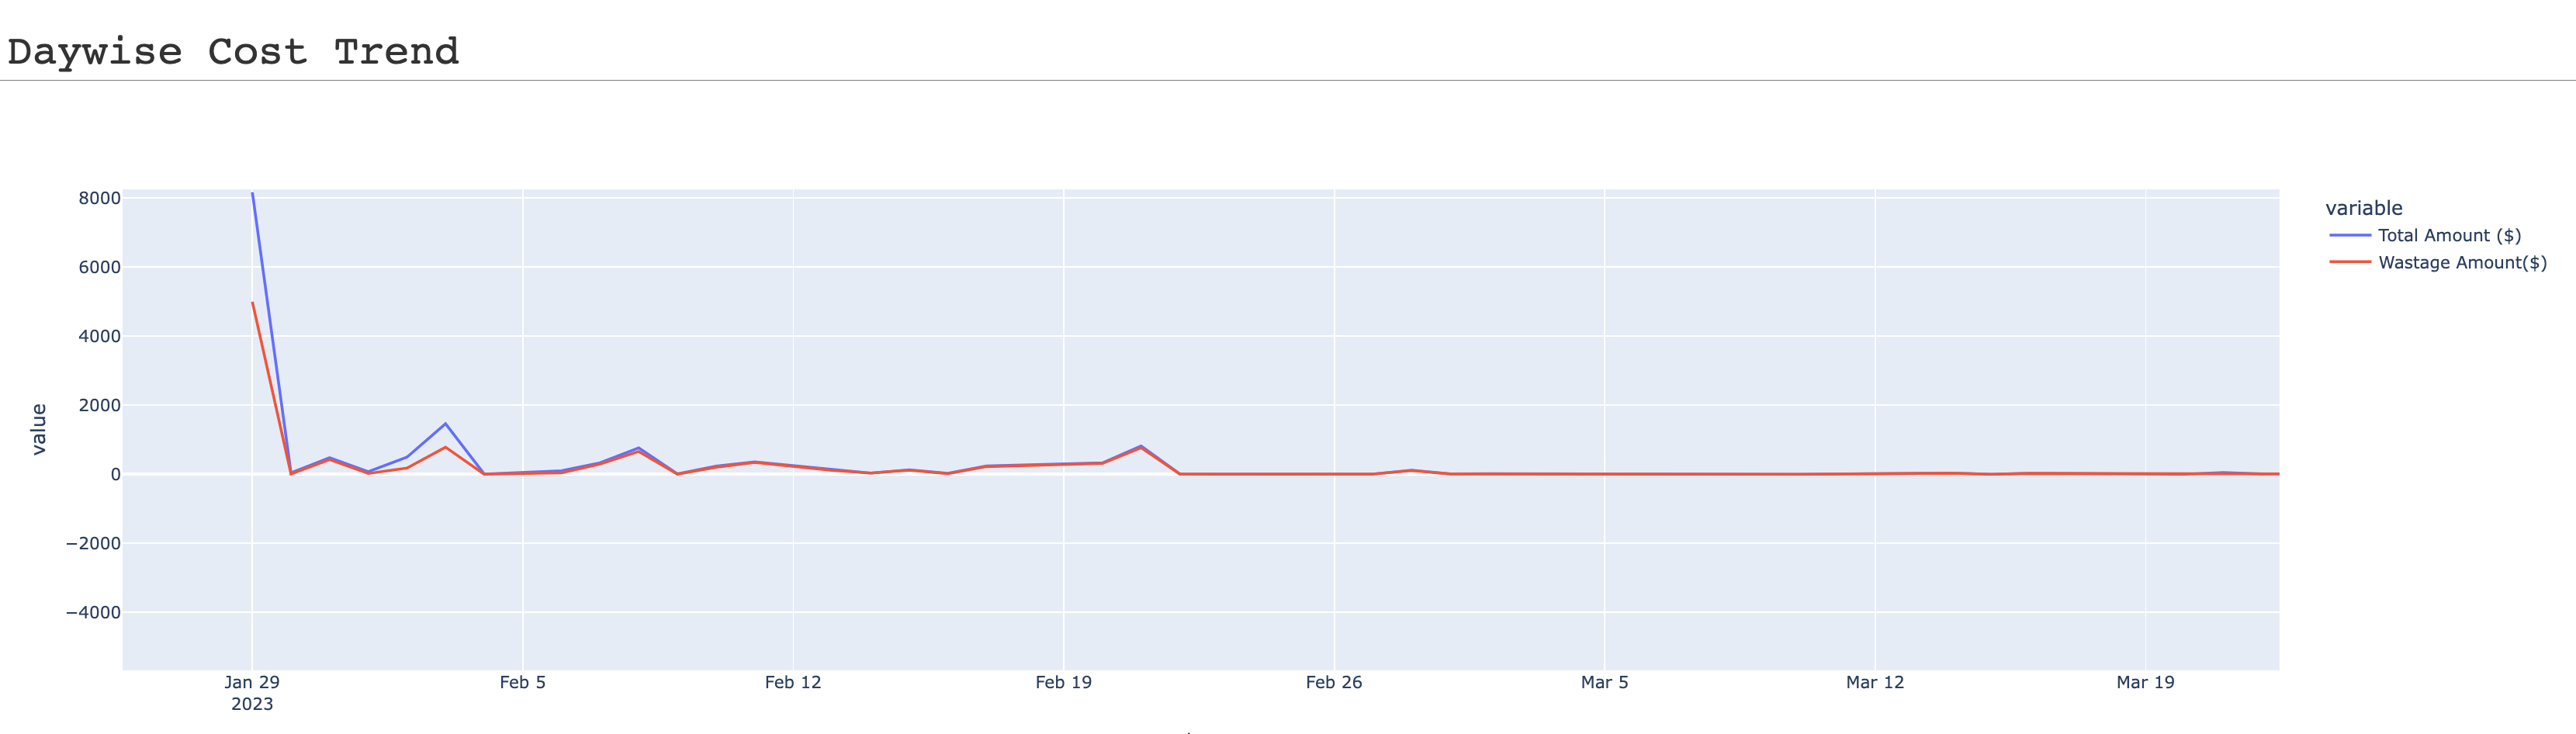
In this section, the following items are shown:
A line graph that plots two variables i.e. the total expenditure versus the wastage amount for each day in the specified period range for all the clusters. Click the variable names on the right to toggle between the variables.
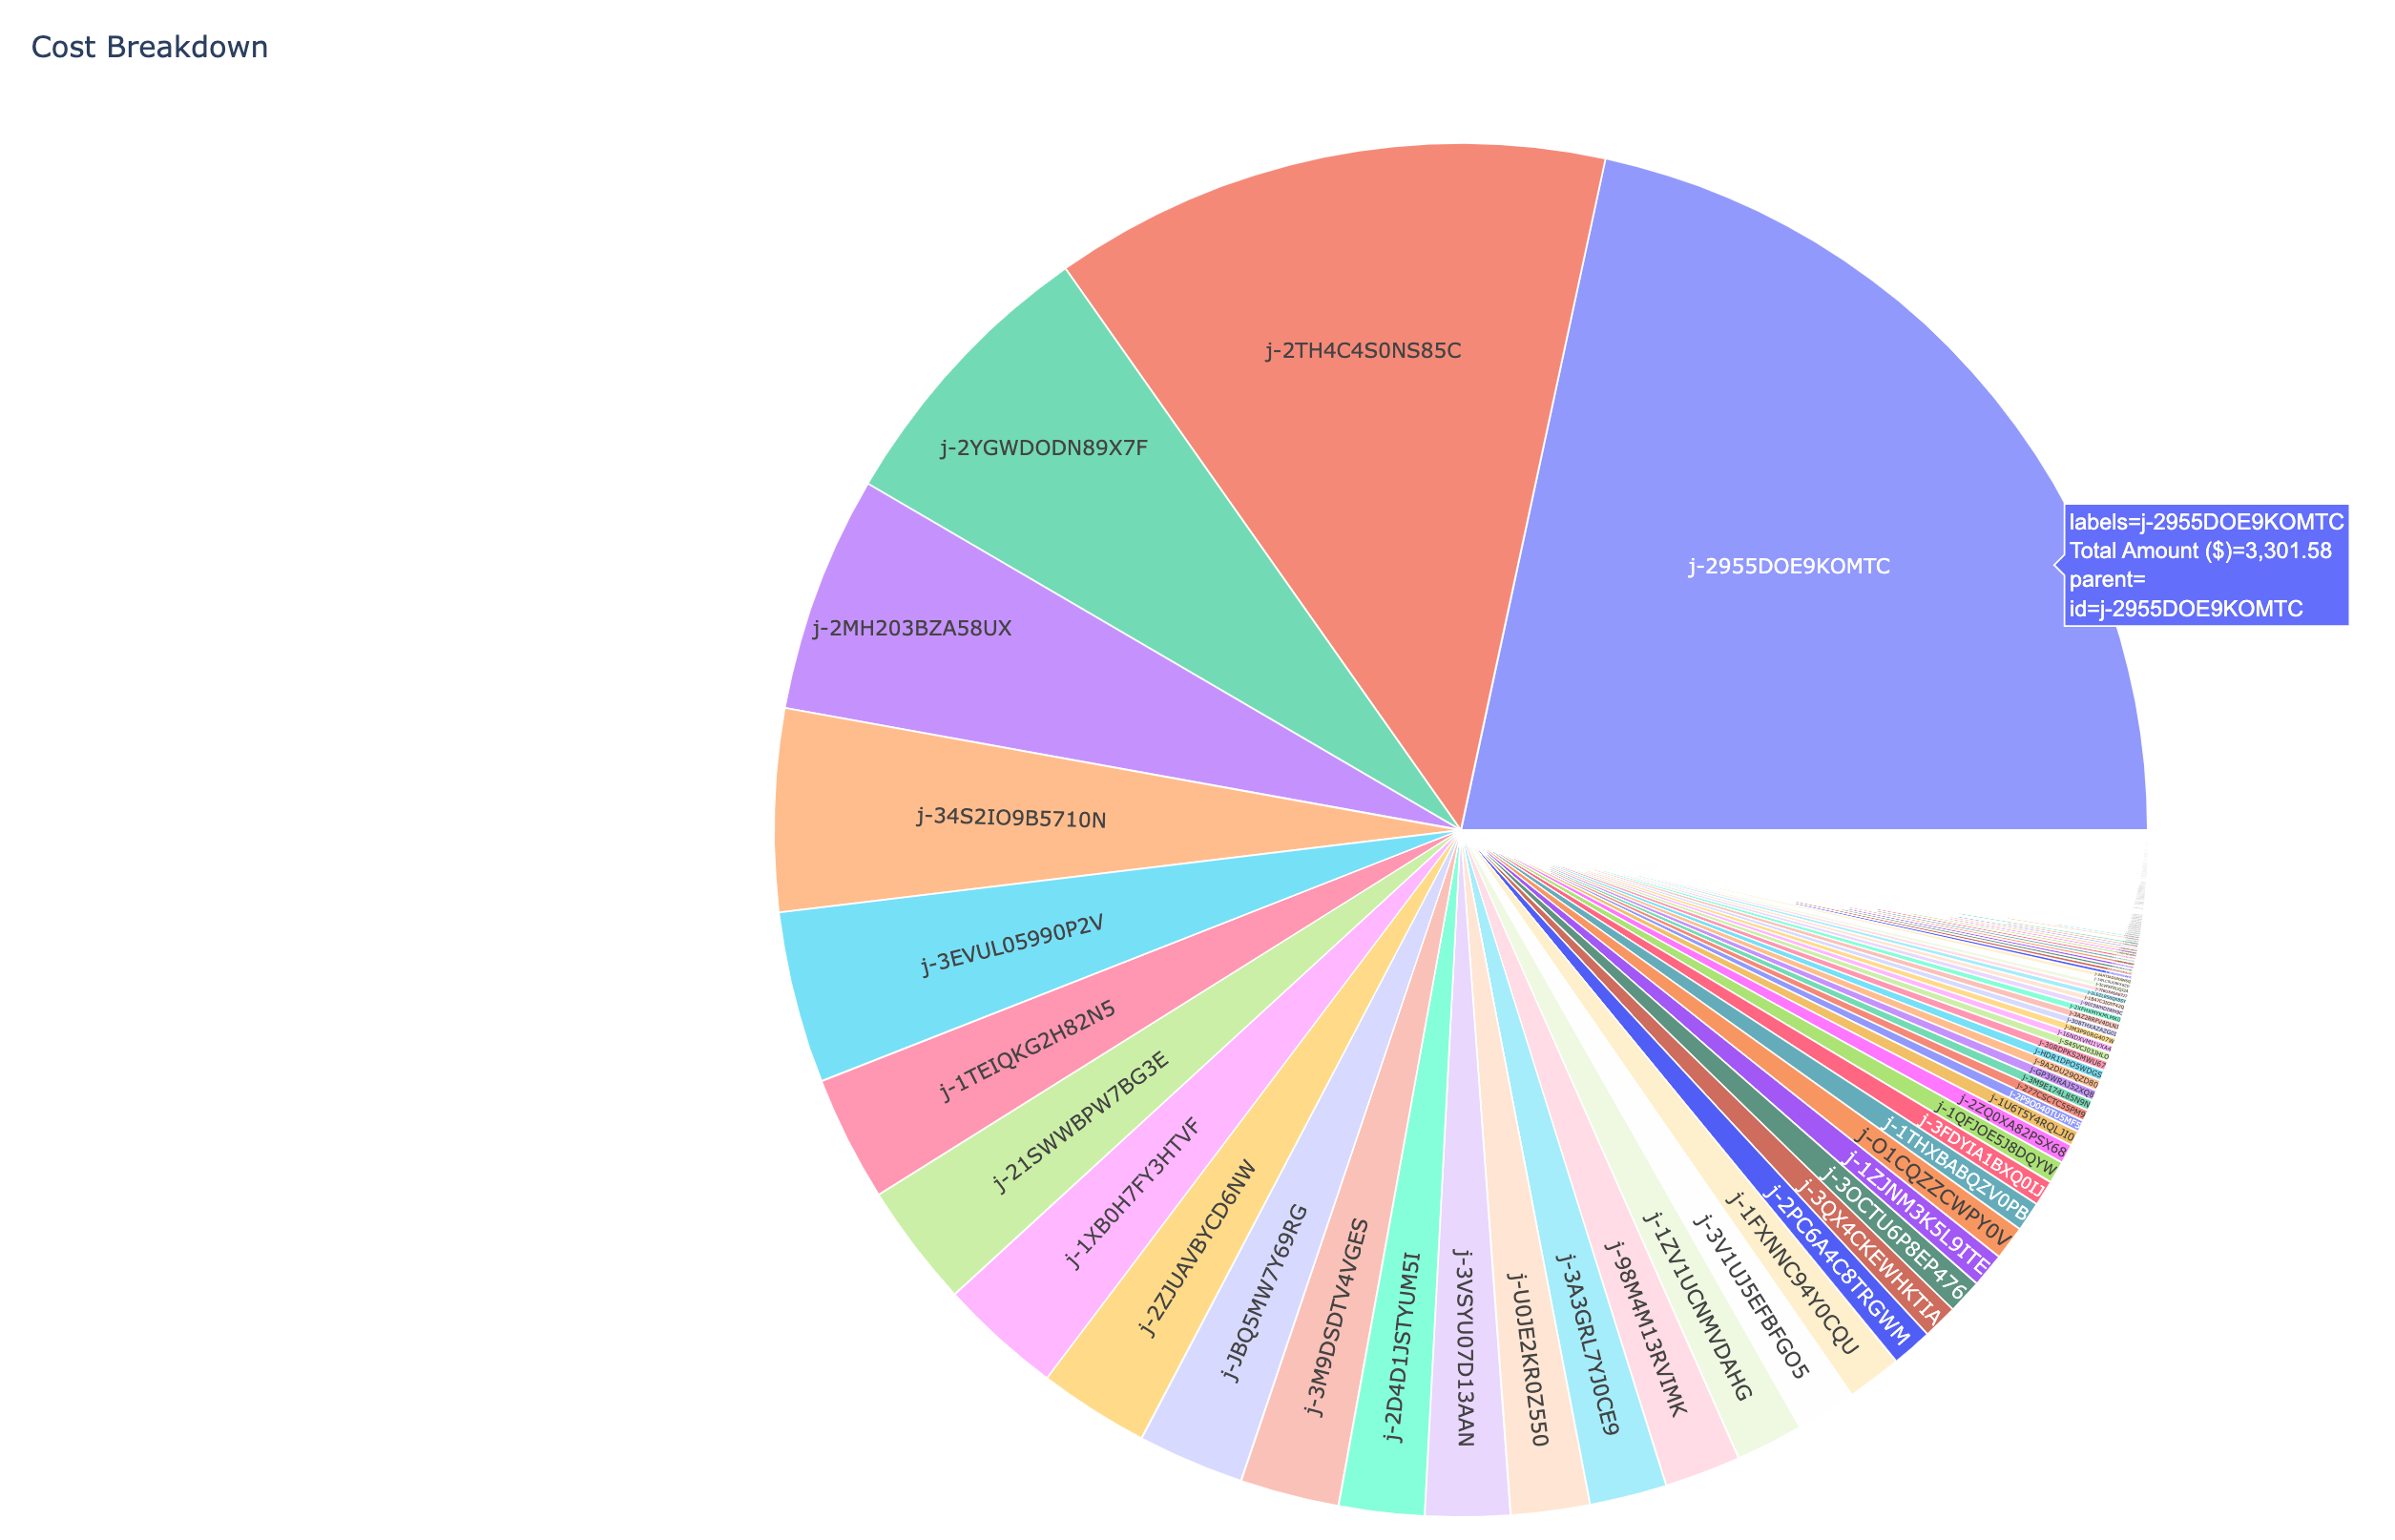
A pie chart with sectors representing the total cost.
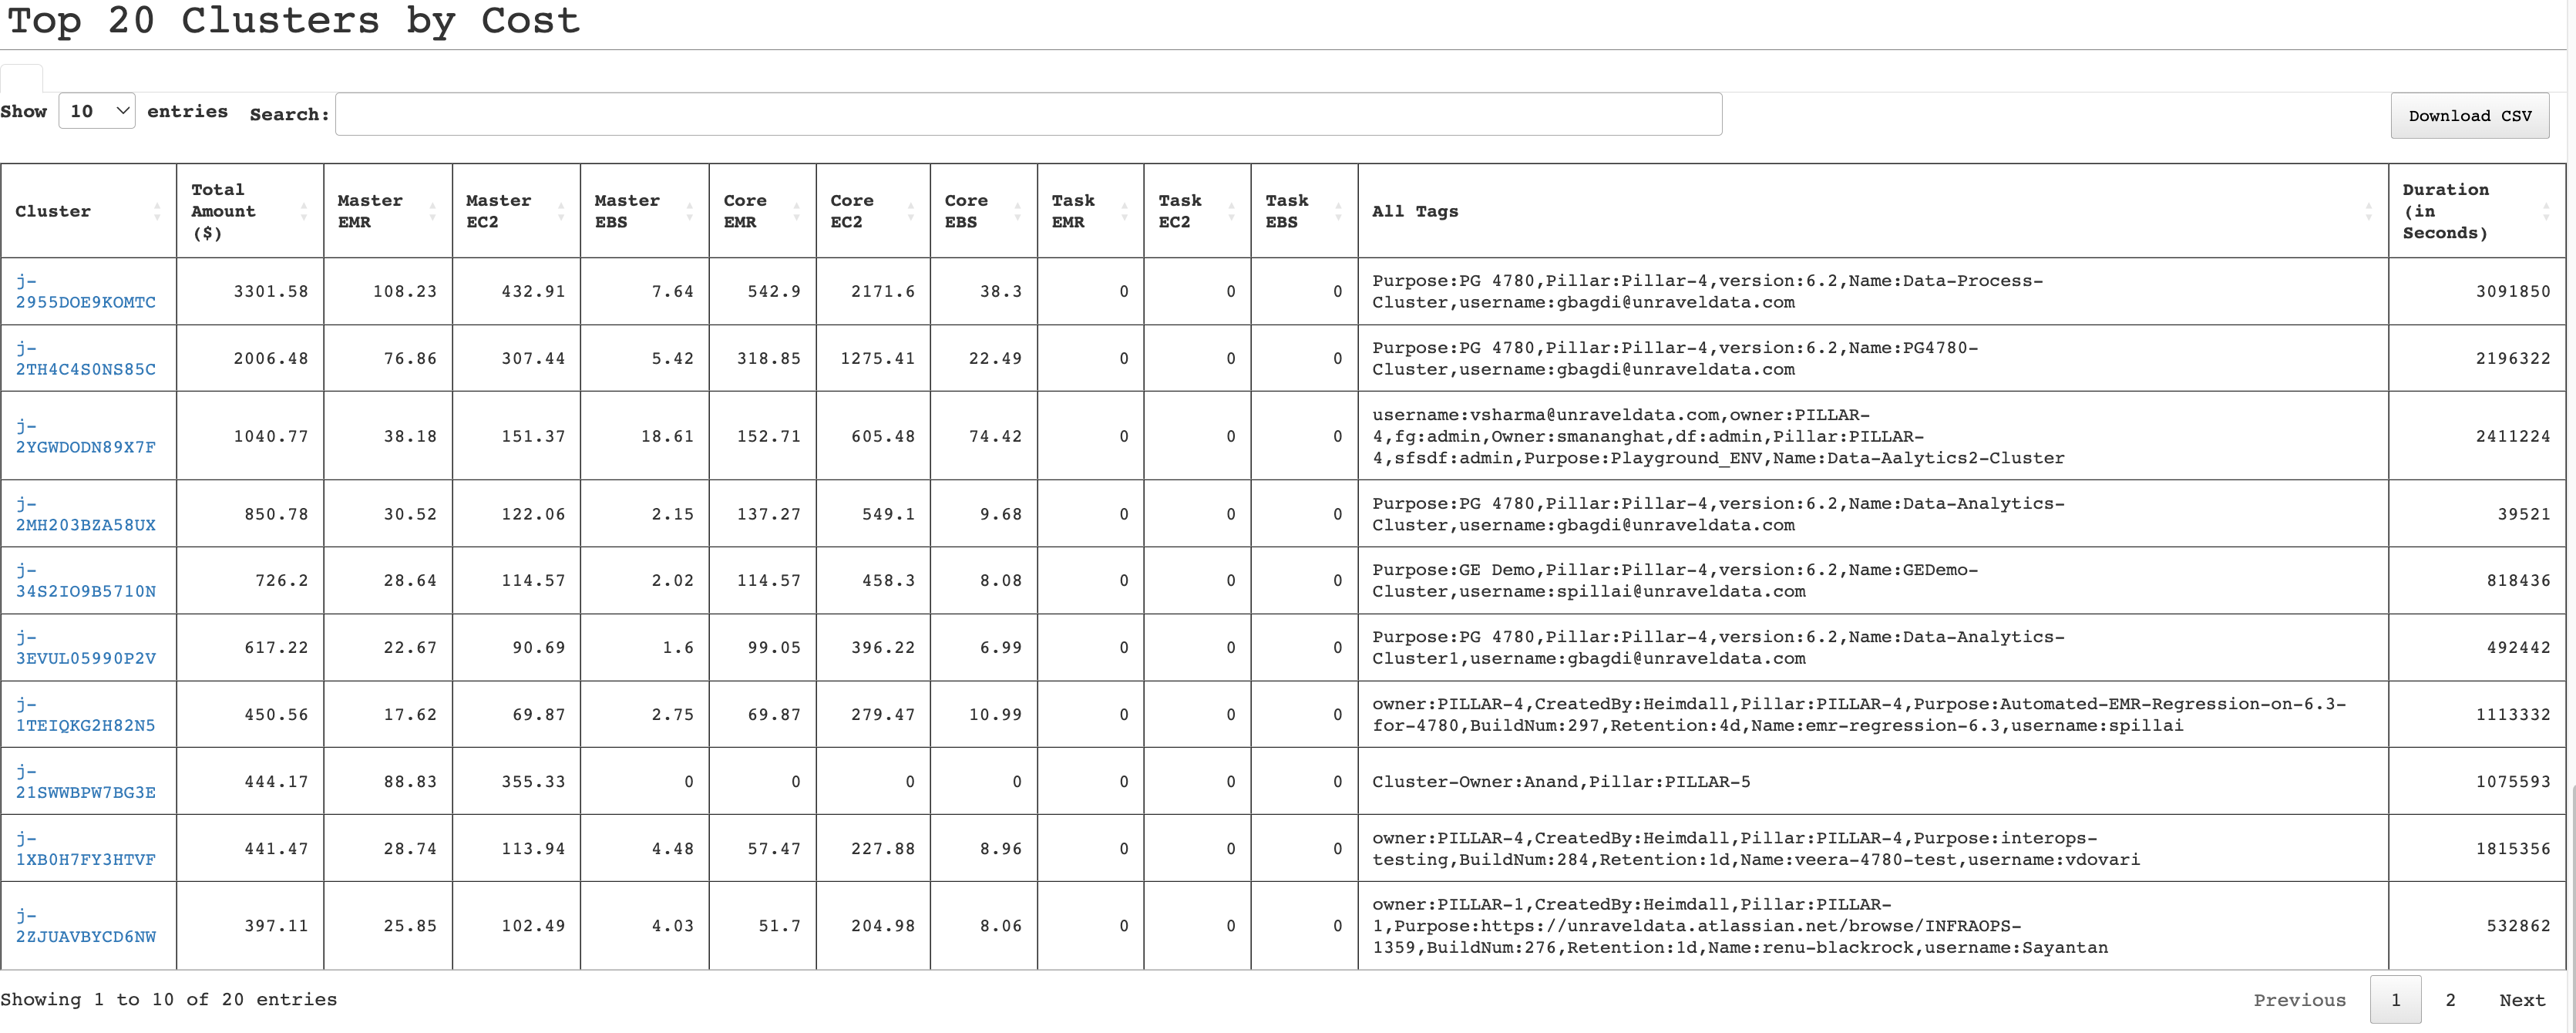
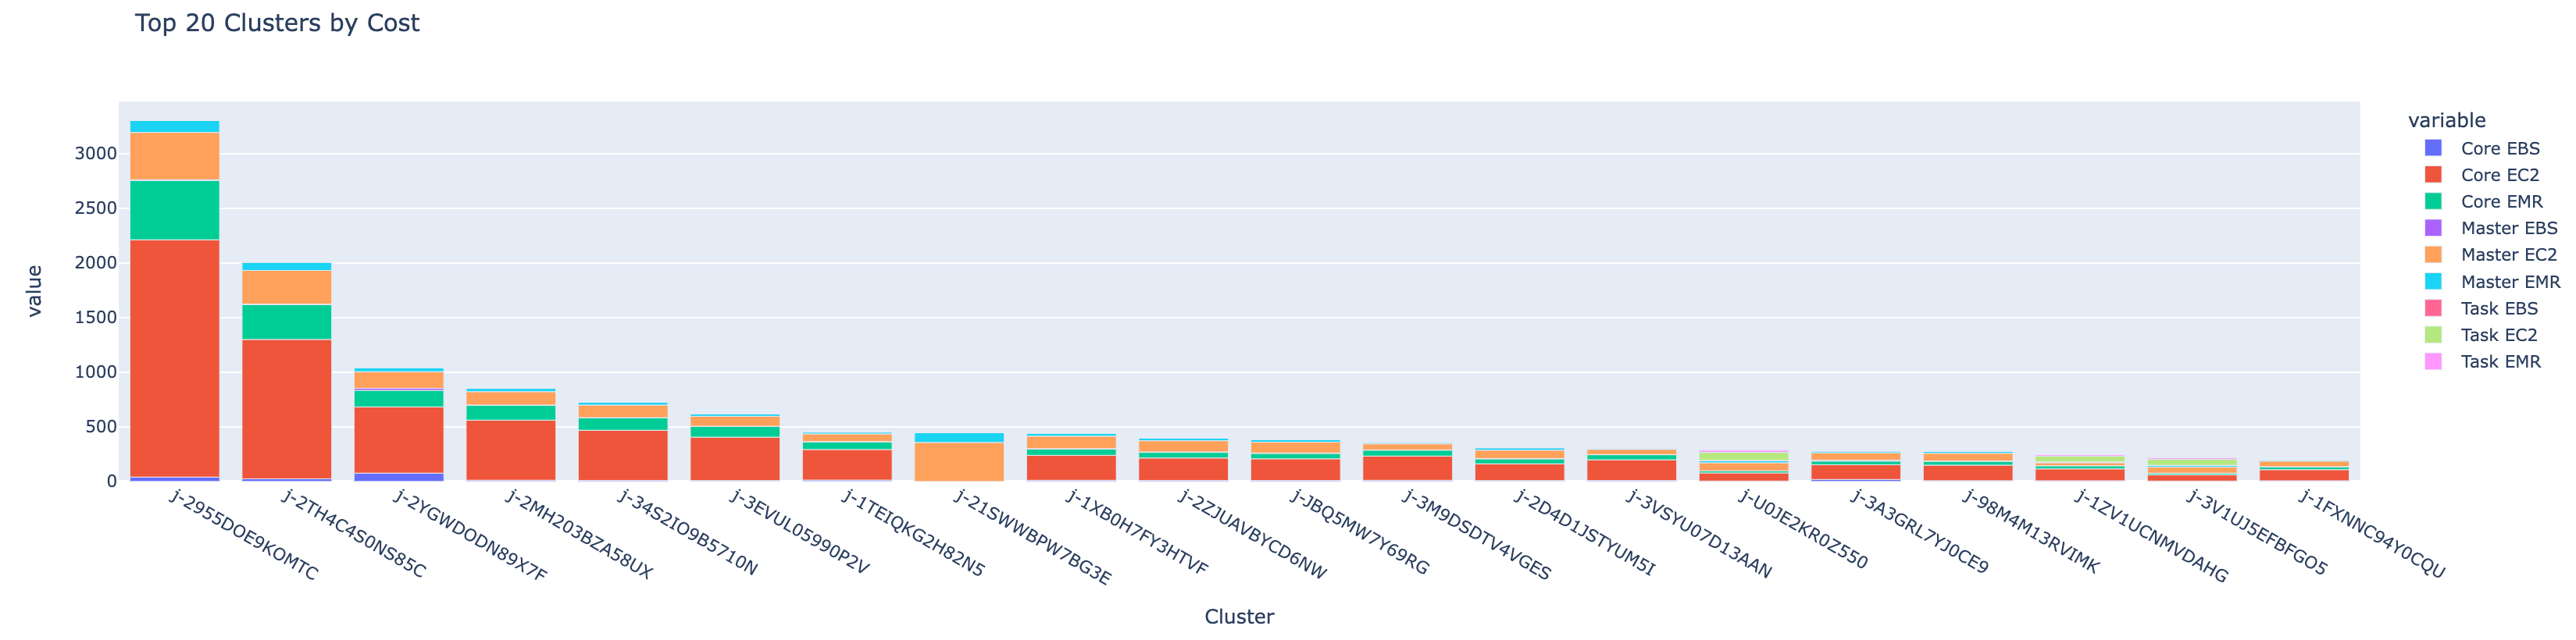
This section lists the top number of clusters by cost in a detailed table. The top clusters by cost are also represented node-wise in a bar graph