Azure bill analysis report
This report allows you to analyze Microsoft Azure billing and get cost analysis, trends, and insights for different entities such as Jobs, Clusters, Users, and so on.
Click Generate Reports > New button.
In the New Report dialog box, enter the following details.
Items
Description
General
Name
Name of the report.
Environment
Select your platform. The reports corresponding to the selected platform are only listed in the Report type. If you select the All option, all the reports are listed.
Report type
Type of report. Select Azure bill analysis.
Schedule
Select the checkbox to schedule the report to run daily, hourly, weekly, or monthly. You can also set the schedule using a cron expression. You can expand the Example drop-down and select the corresponding options. The next four sample run times are displayed for reference.
Retention
The number of days to retain the report files. All the reports are stored in the
unity-one/src/assets/reports/jobsdirectory. After completing the retention period, the report files are automatically purged.Parameters
Lookback
The period ranges in days when applications can be selected for report generation. A notification is displayed above this option that informs about the duration when data is available for the report.
Use Exact Date-Time
Check this option and select the from and to dates and times to schedule the report for the exact time range specified. The only anomaly with this option is that the same report will be scheduled to be generated repeatedly.
Tags
Specify the tags that should be included in the report. You must enter the tag key and value. Click Add to add more tags. Click Remove to remove an already specified tag.
Billing file path
Specify the path to the billing file. You must download the billing csv from Azure beforehand and add it to the Unravel node.
Azure Account Subscription type
Specify any of the following subscription types:
Pay As You Go Account
Enterprise
TopK
The count or number to analyze Top K entities.
Job Cost Threshold
Specify an amount in USD that denotes the job cost threshold. Costs exceeding this threshold are analyzed.
User Cost Threshold
Specify an amount in USD that denotes the user cost threshold. Costs exceeding this threshold are analyzed.
Cluster Cost Threshold
Specify an amount that denotes the cluster cost threshold. Costs exceeding this threshold are analyzed.
Tag(s) Cost Threshold
Specify an amount that denotes the tag's cost threshold. Costs exceeding this threshold are analyzed.
Notifications
Email to
Email ID to send the notification when the report is generated. You can select the Attach Files to Email checkbox to receive the reports as an attachment.
Advanced Options
Profile memory
Select this option if you want to generate logs that help to troubleshoot scenarios where the report takes excessive time to generate or fails to generate.
Caution
The option will increase the report run time excessively.
Click OK. The generated reports will be listed under Reports on the App UI.
Select the generated report and then click Run. After the report is successfully run, the details of the report runs are listed in the Run box on the right.
Click the following:
HTML Files link to view the report details. The following HTML files are generated for the Azure billing analysis report:
summary report.html
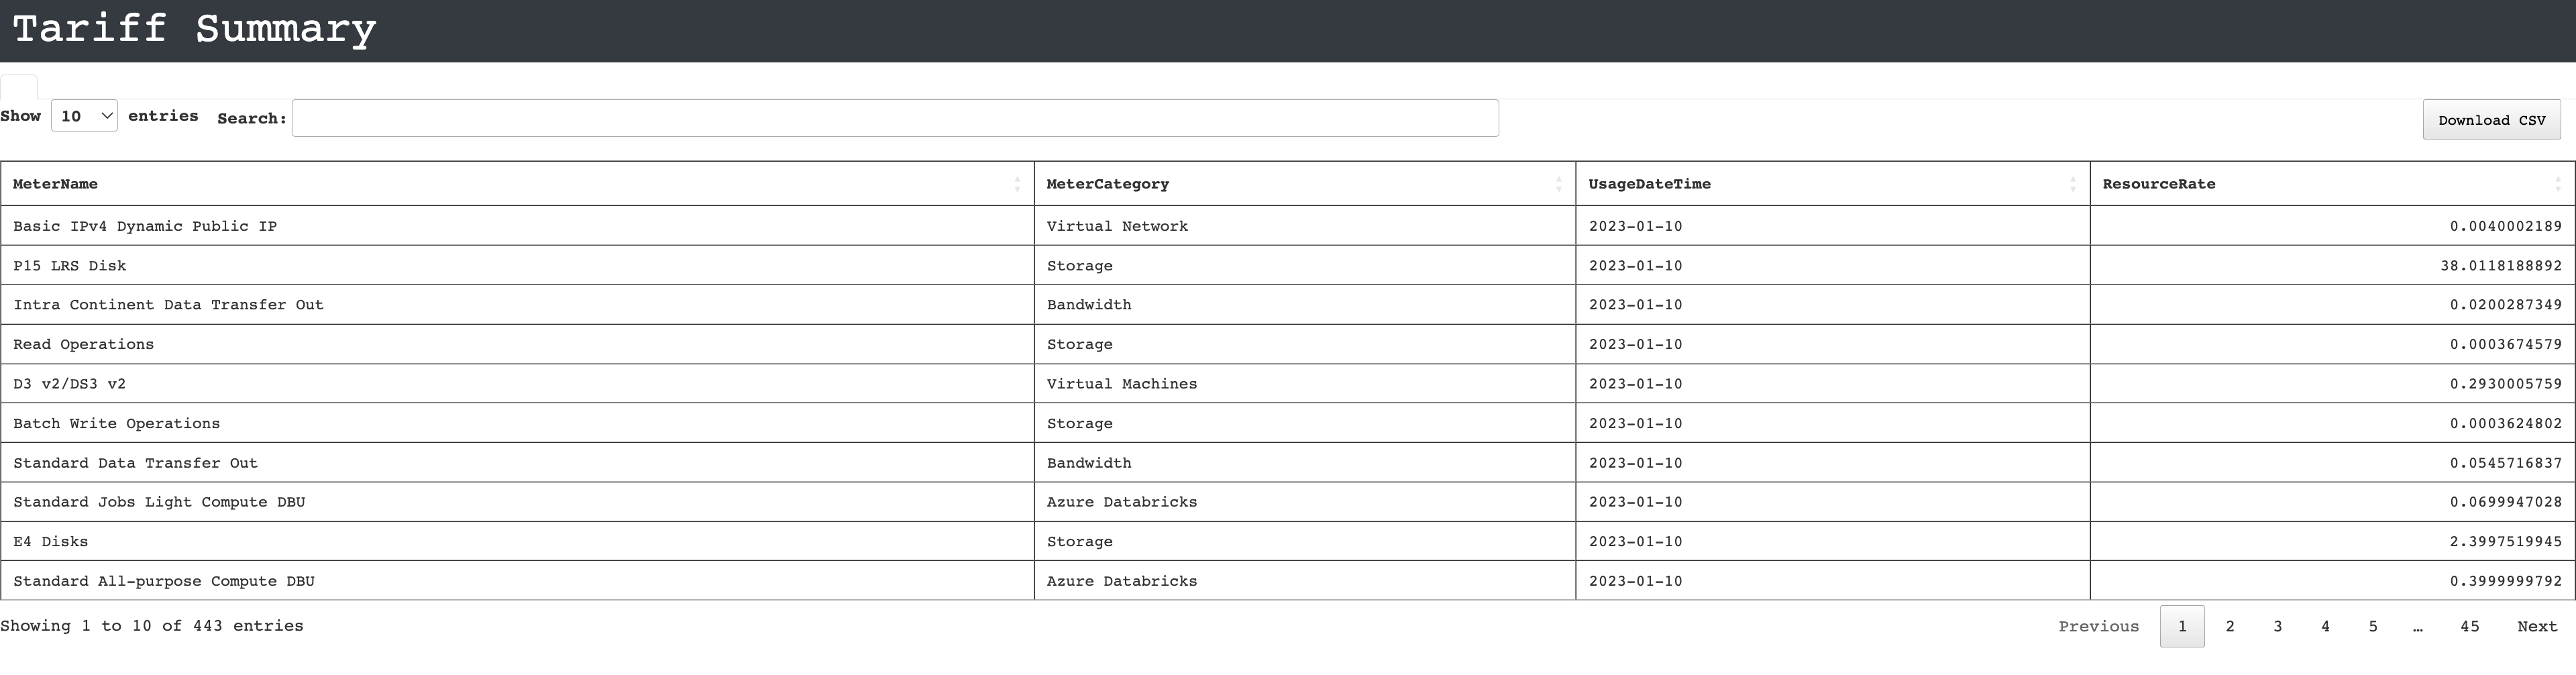
tariff_summary.html
Input parameters link to view the parameters you chose to run the report.
Log file link to view the logs of the report.
The following HTML files are generated for the Azure billing analysis report:
This report consists of the following:
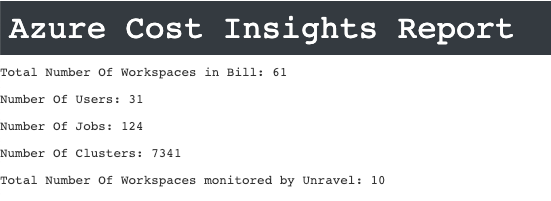
Azure Cost Insights report
This section of the summary report provides the number of workspaces, users, jobs, and clusters involved in the report.
Insights
The insights report specifies all the insights with a link to more details of specific insights.
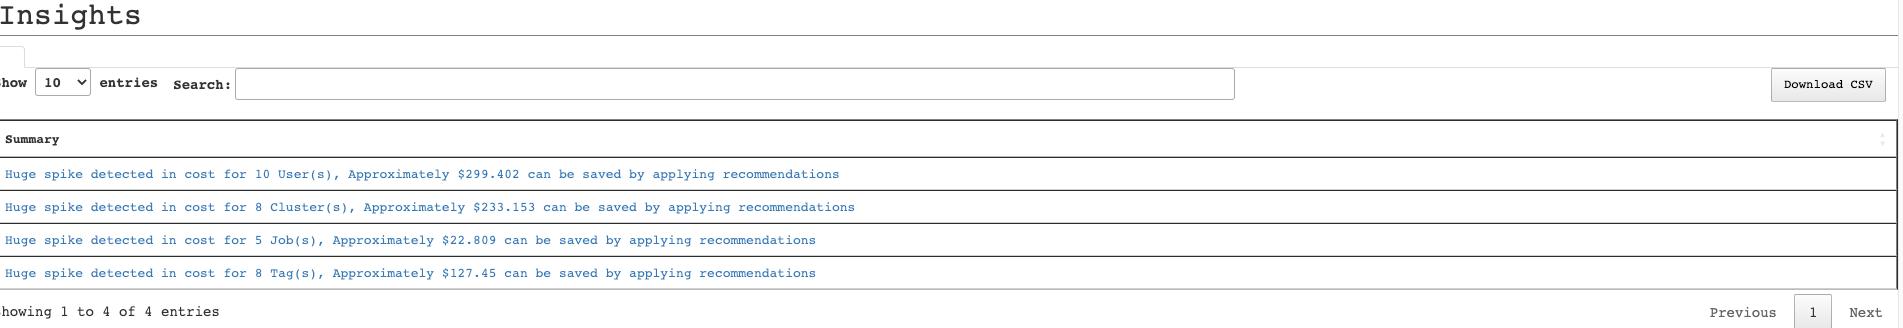
For example, in the above image, when you click the link of the highlighted insight it takes you to a details page with the following sections:
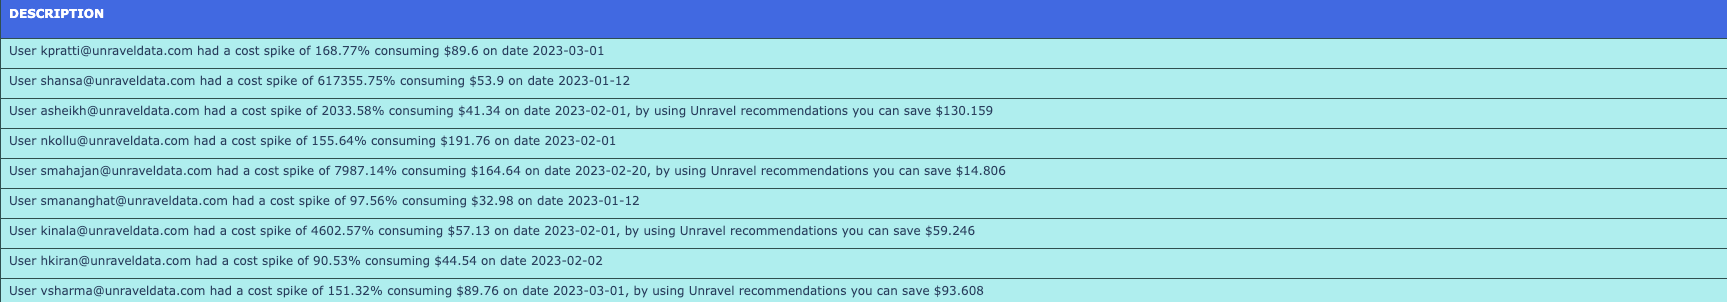
Insights details: More details of each of the user specified in the highlighted insight is shown.
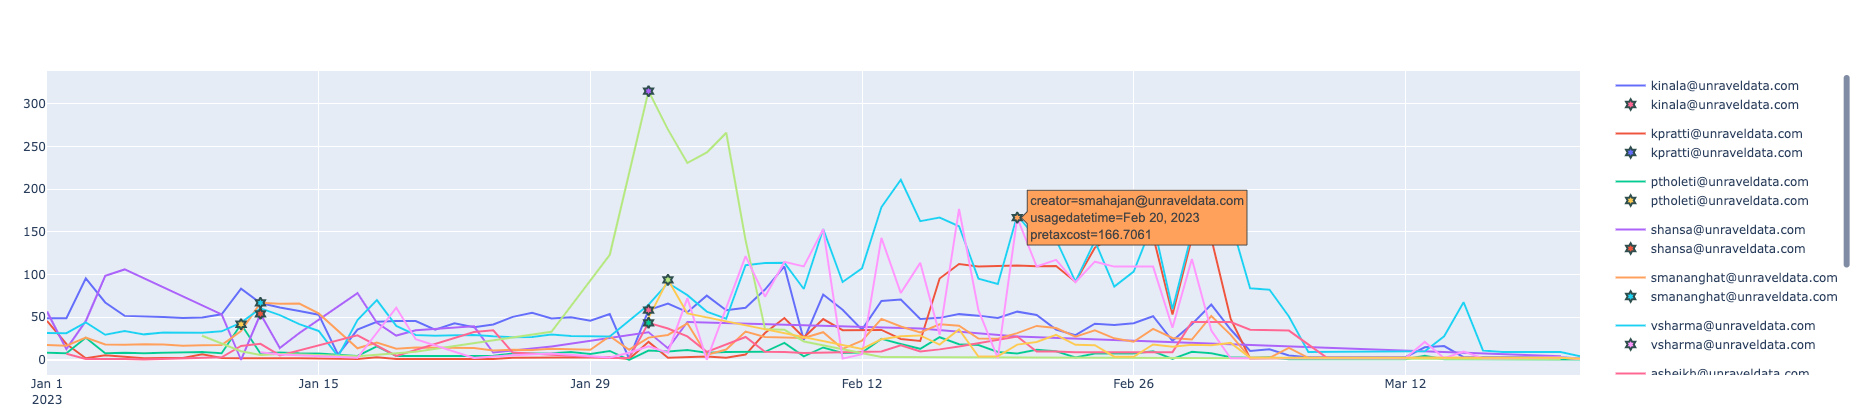
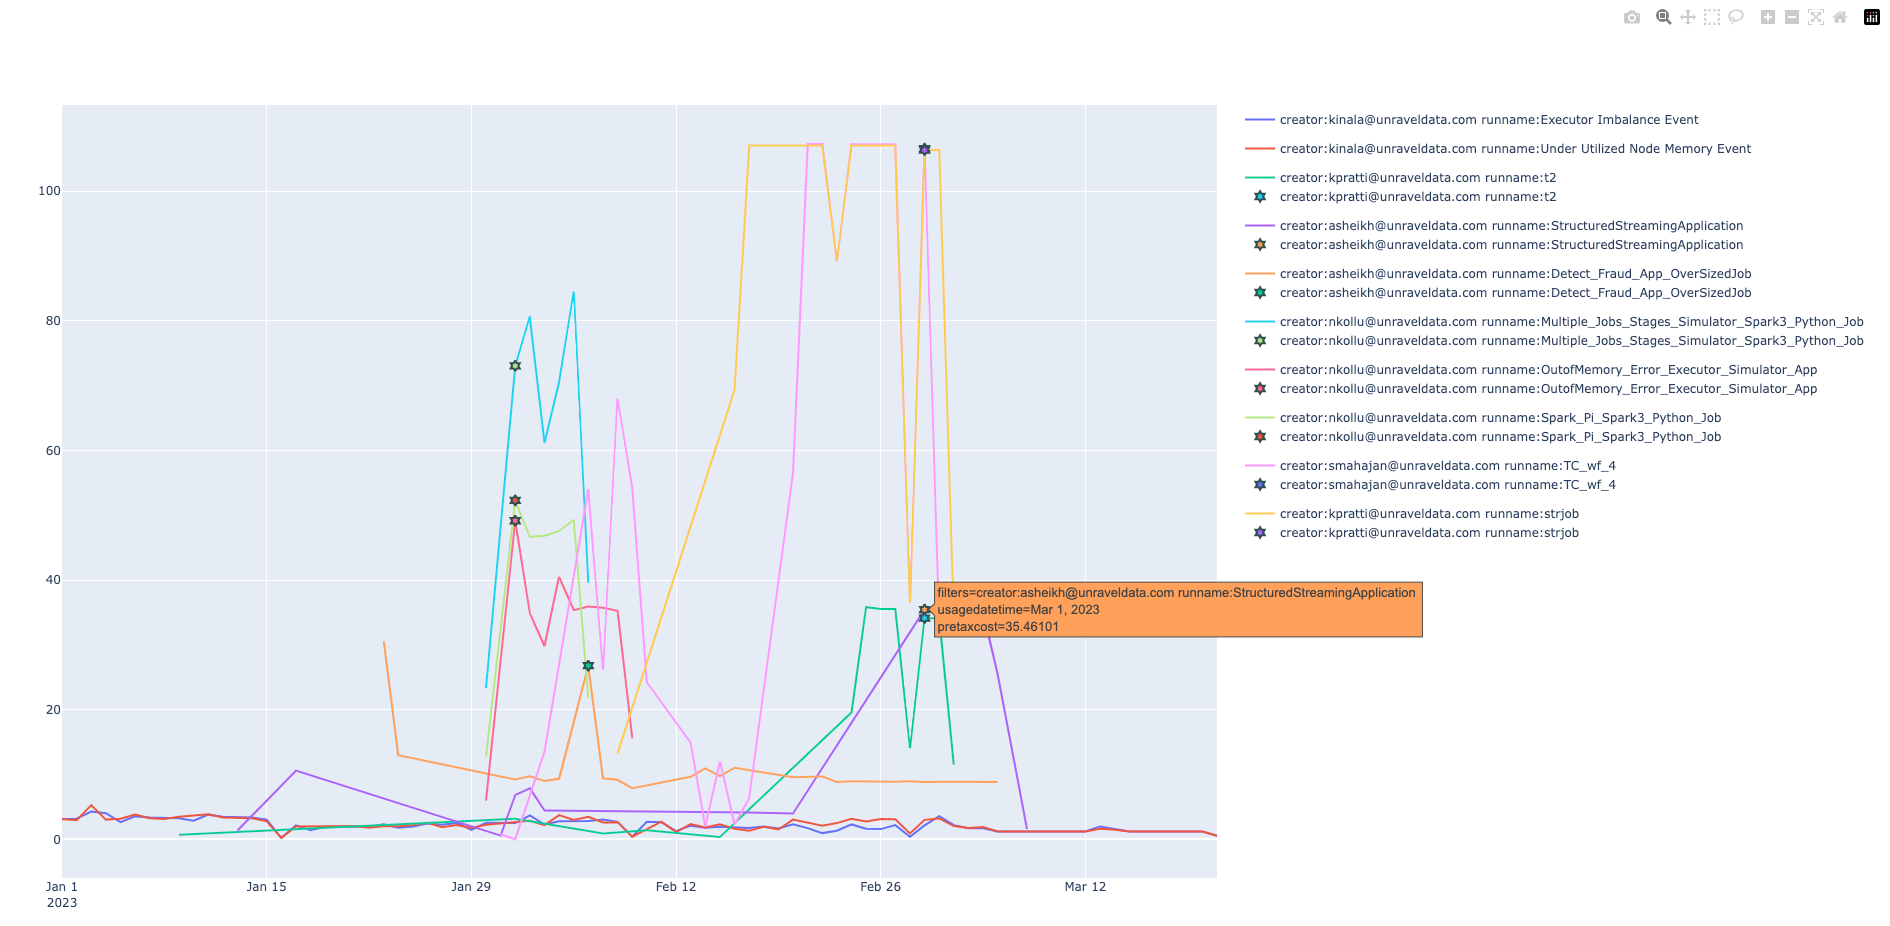
Trend chart: This chart plots the cost incurred by each user over a time range. The highest cost incurred by the users is highlighted. You can click any users from the right panel to either remove or add a specific user trend line in the chart.
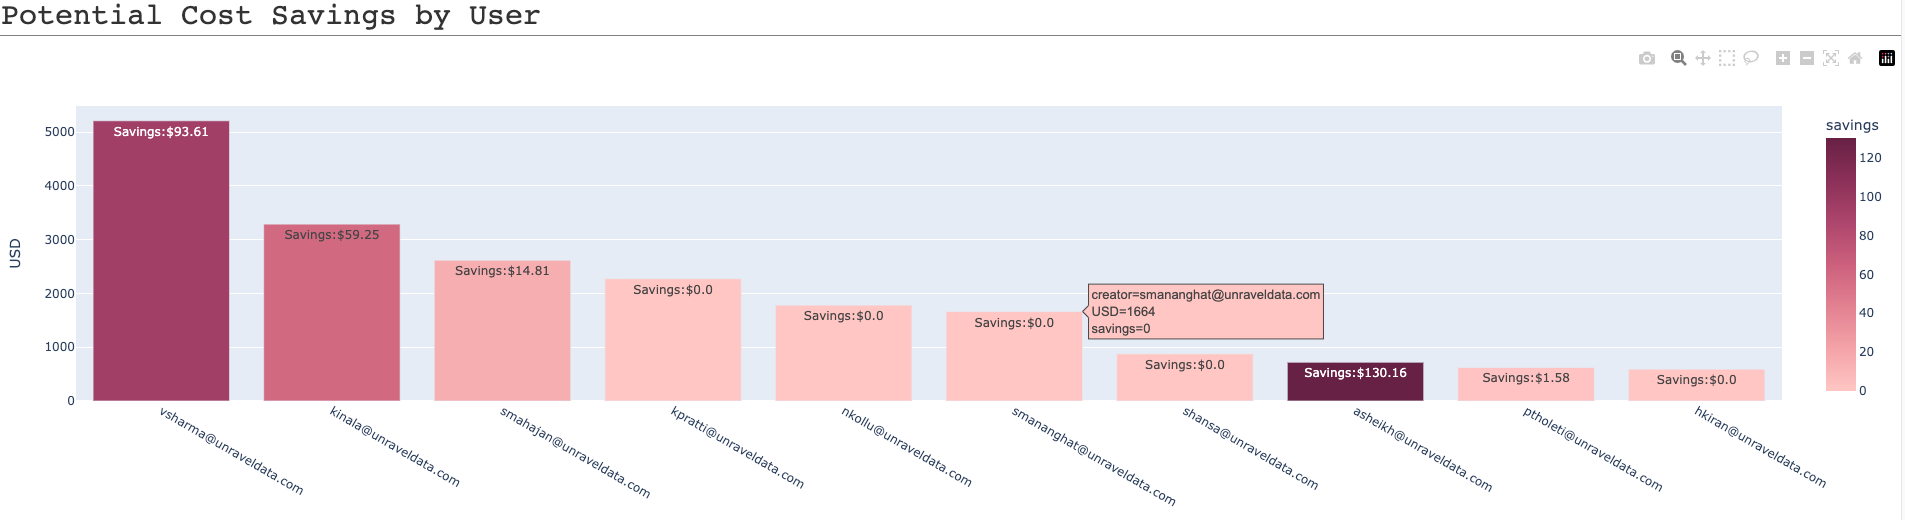
Bar graph for potential cost savings by user: This trend graph provides potential savings that can be done by each user based on Unravel insights.
Cost breakdown by user: The cost breakdown for each user in a tabular format along with the savings. You can download the table details in CSV format. The following columns are listed in the table:
Creator: lists the users.
Pretaxcost: Sum of the cost invoiced for a specific user.
UnravelMonitoredCost: Sum of cost invoiced for the clusters monitored by Unravel.
Savings: The total savings that can be achieved by applying Unravel's recommendations. Savings with -1 indicate that no savings were estimated.
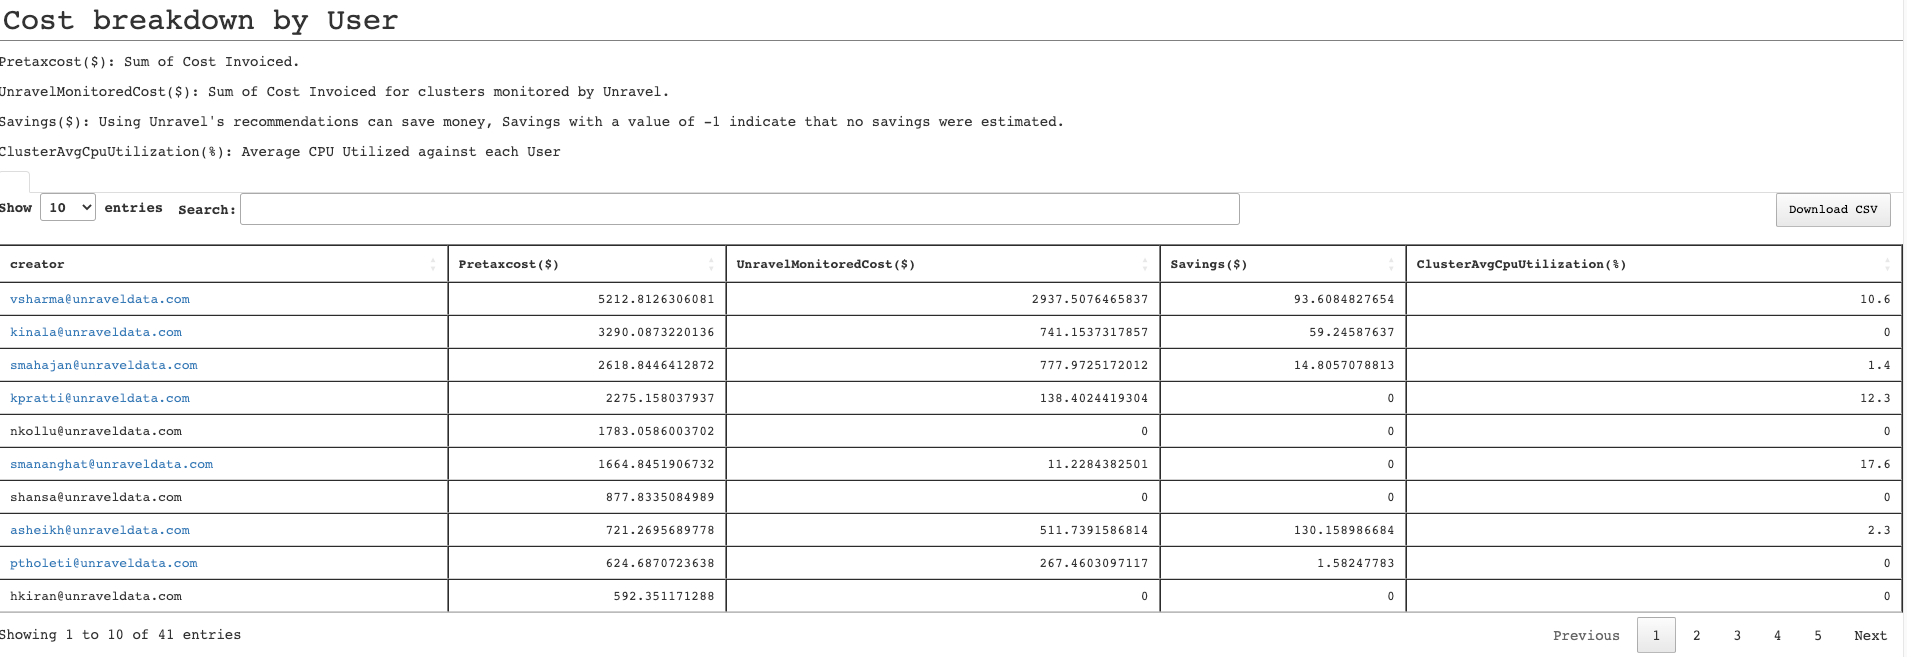
Note
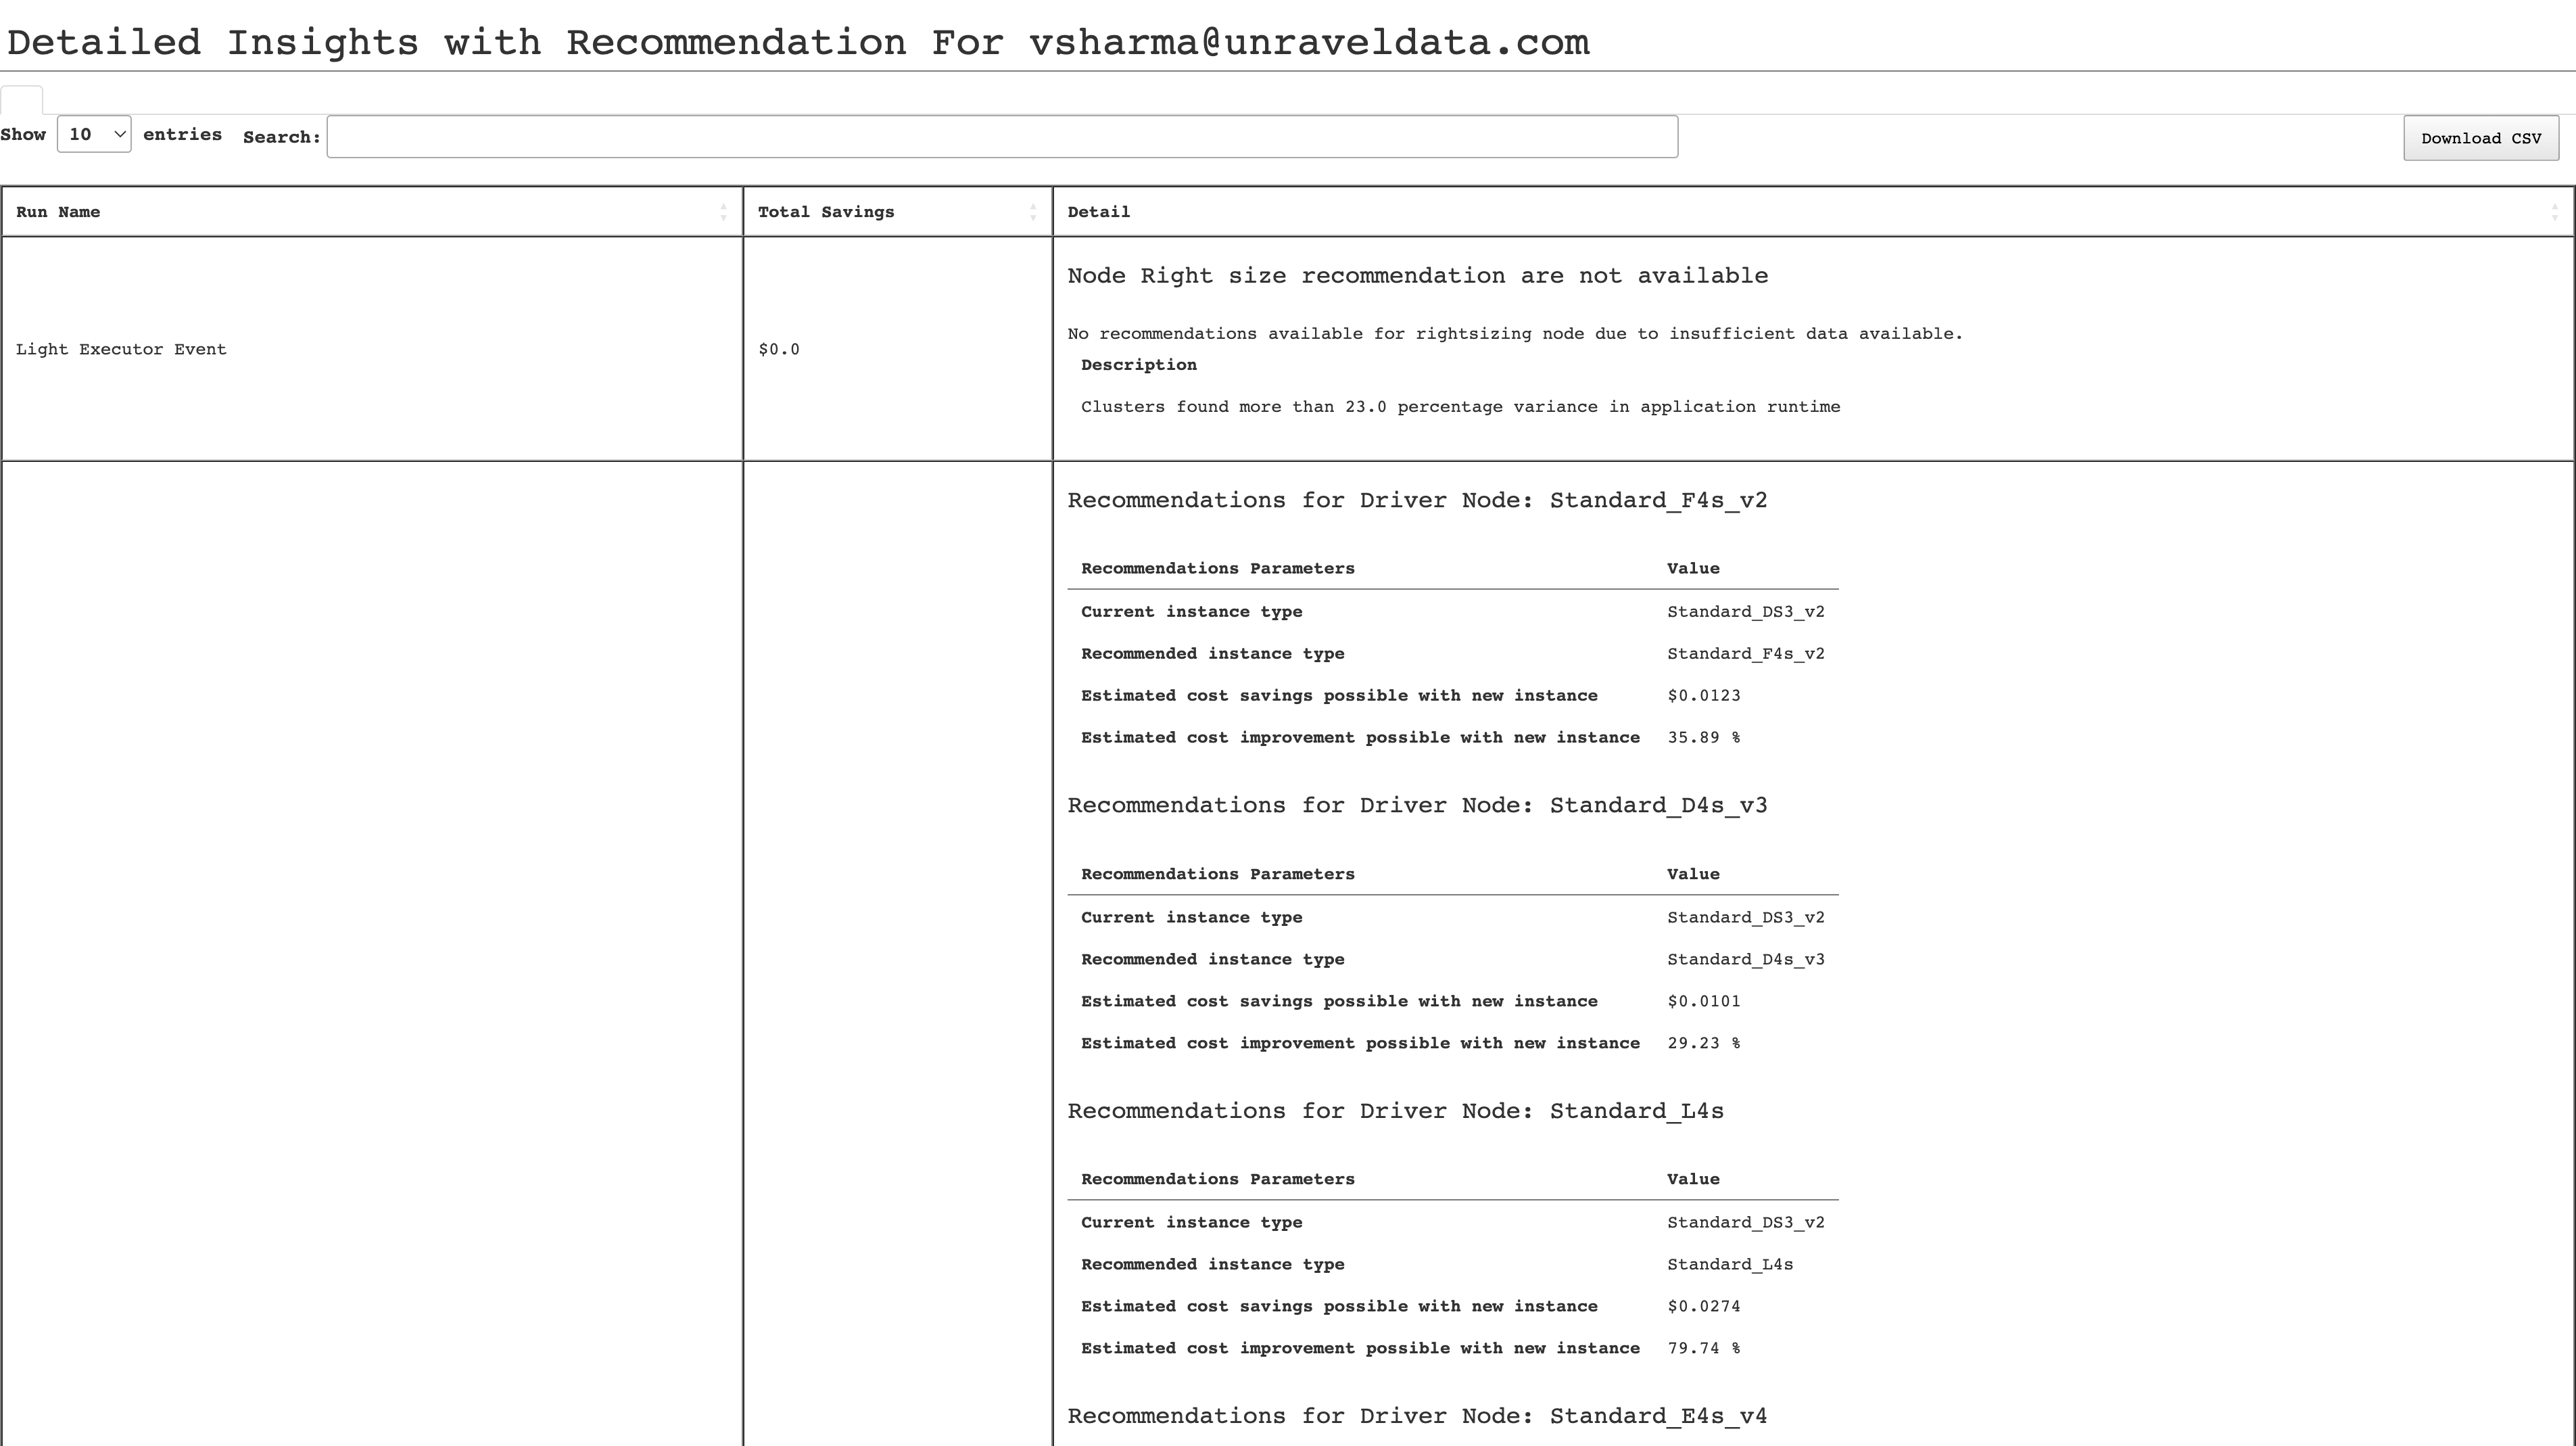
If there is a user link available in the Creator column, it indicates there are recommendations for that specific user. Click the link to find details of the recommendations.
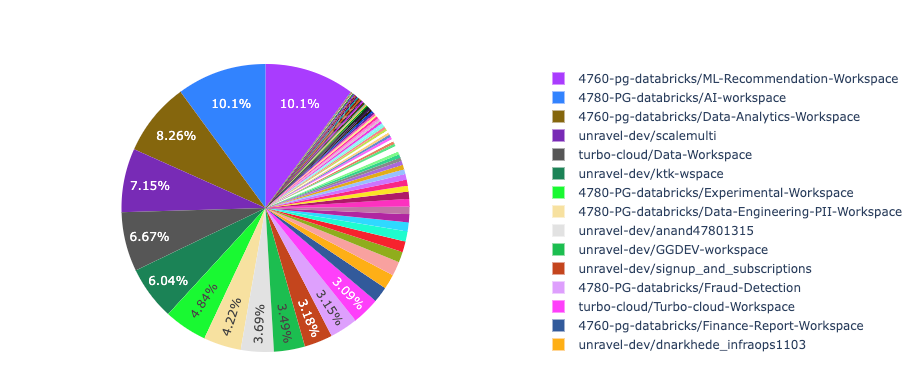
Cost breakdown based on workspaces
The cost breakdown is presented in a pie chart for the highest cost by workspaces.
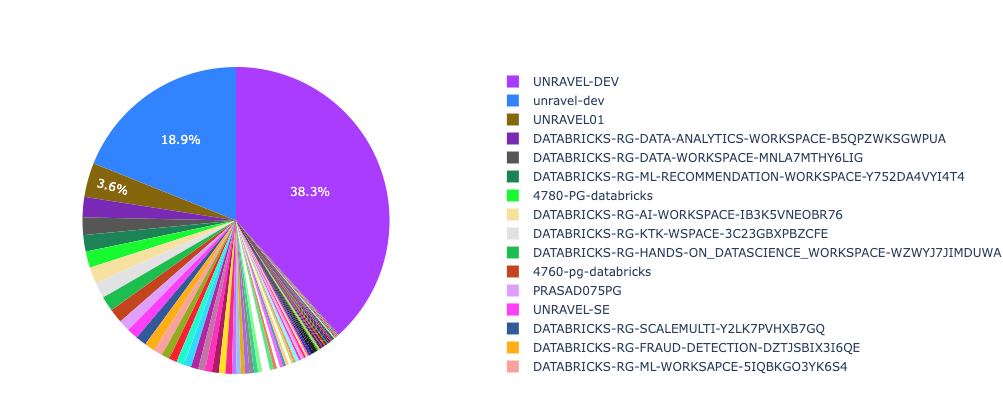
Cost breakdown based on resource groups
The cost breakdown is presented in a pie chart for the highest cost by resource groups.
Tag(s) based breakdown
The cost breakdown is presented in a pie chart for the highest cost incurred by tag types:
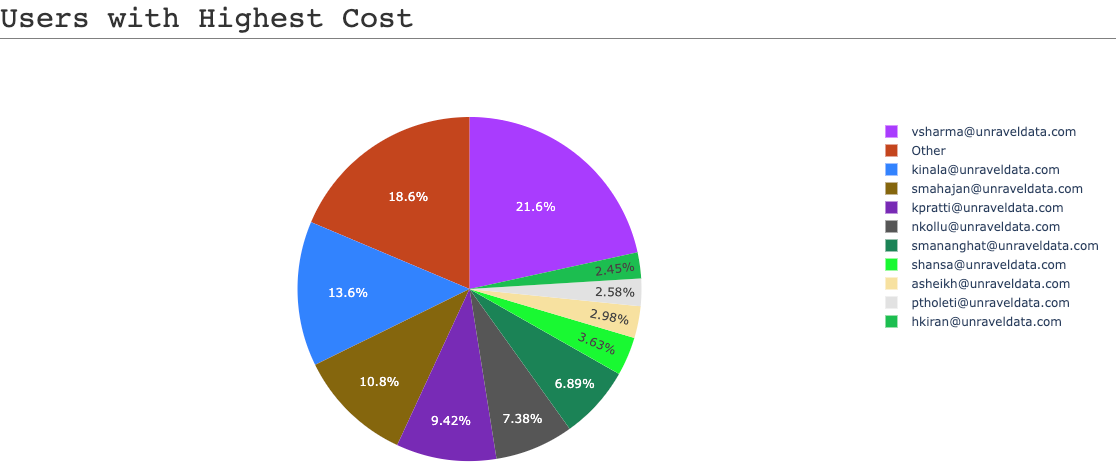
Users with the highest cost: The cost breakdown in a pie chart for the highest cost incurred by users.
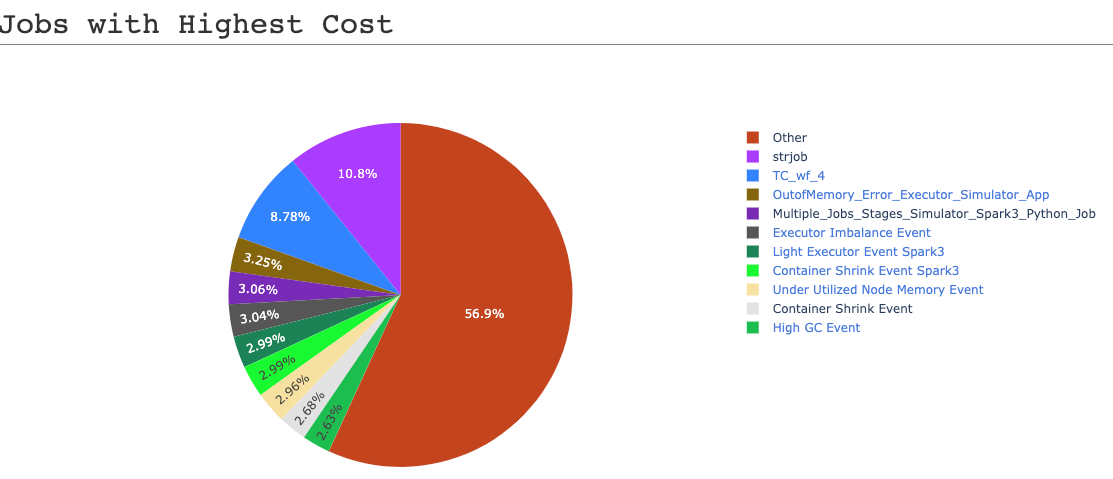
Jobs with the highest cost: The cost breakdown in a pie chart for the highest cost incurred by jobs.
Tags with highest cost: The cost breakdown in a pie chart for the highest cost incurred by different tags.
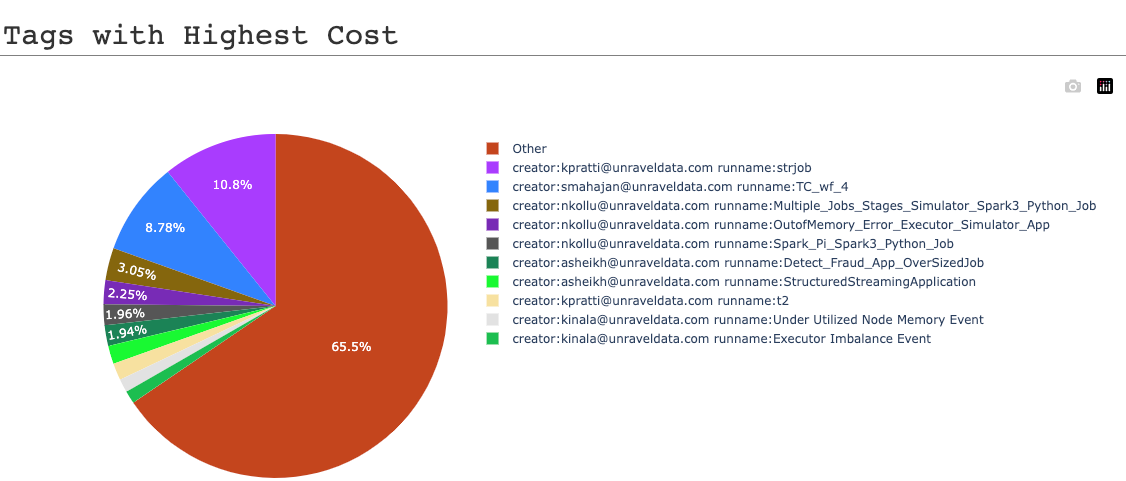
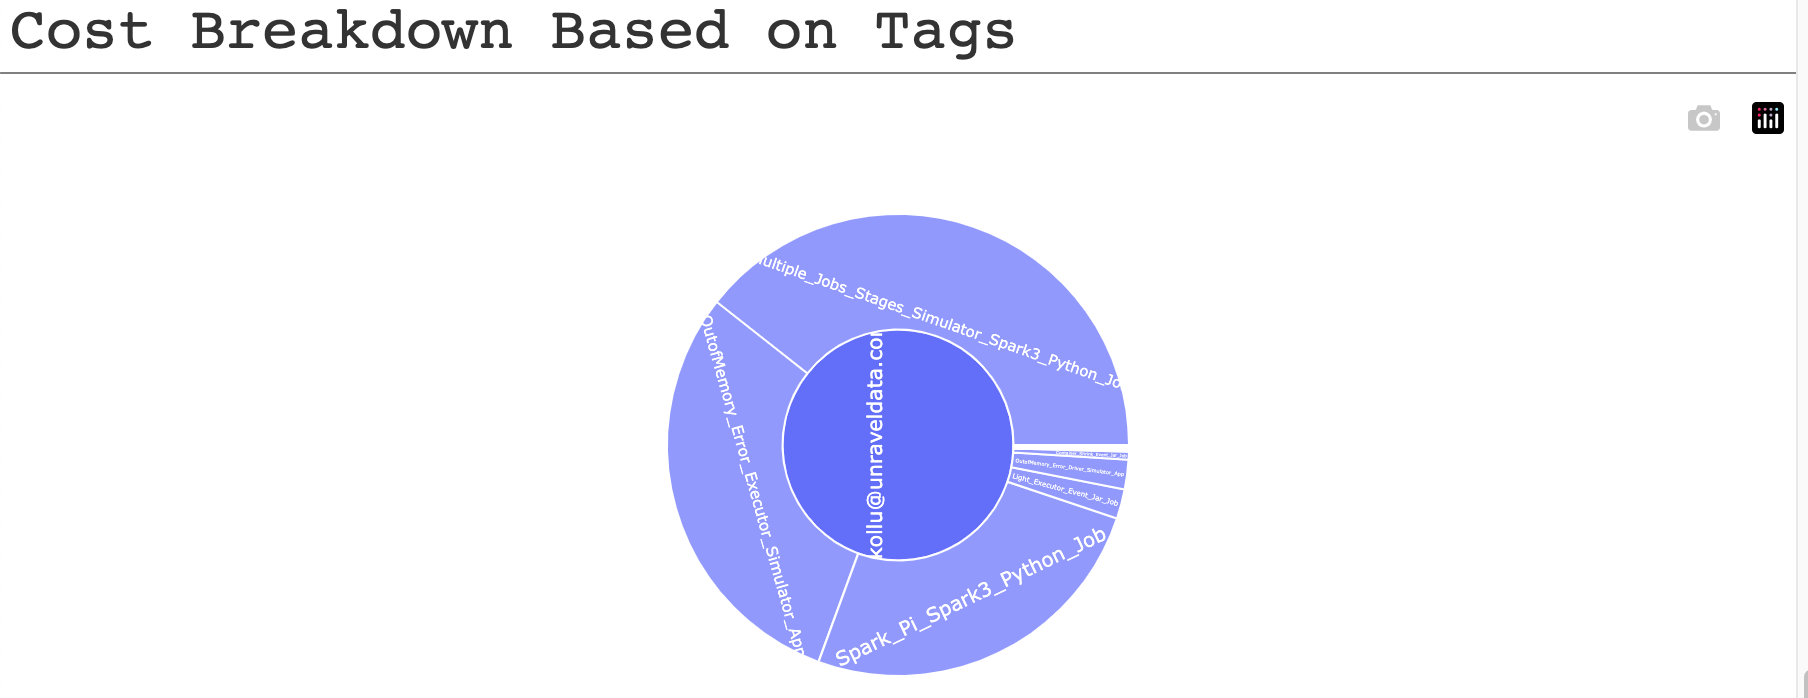
Cost breakdown based on tags: The overall cost breakdown in a pie chart for the highest cost incurred by tags.
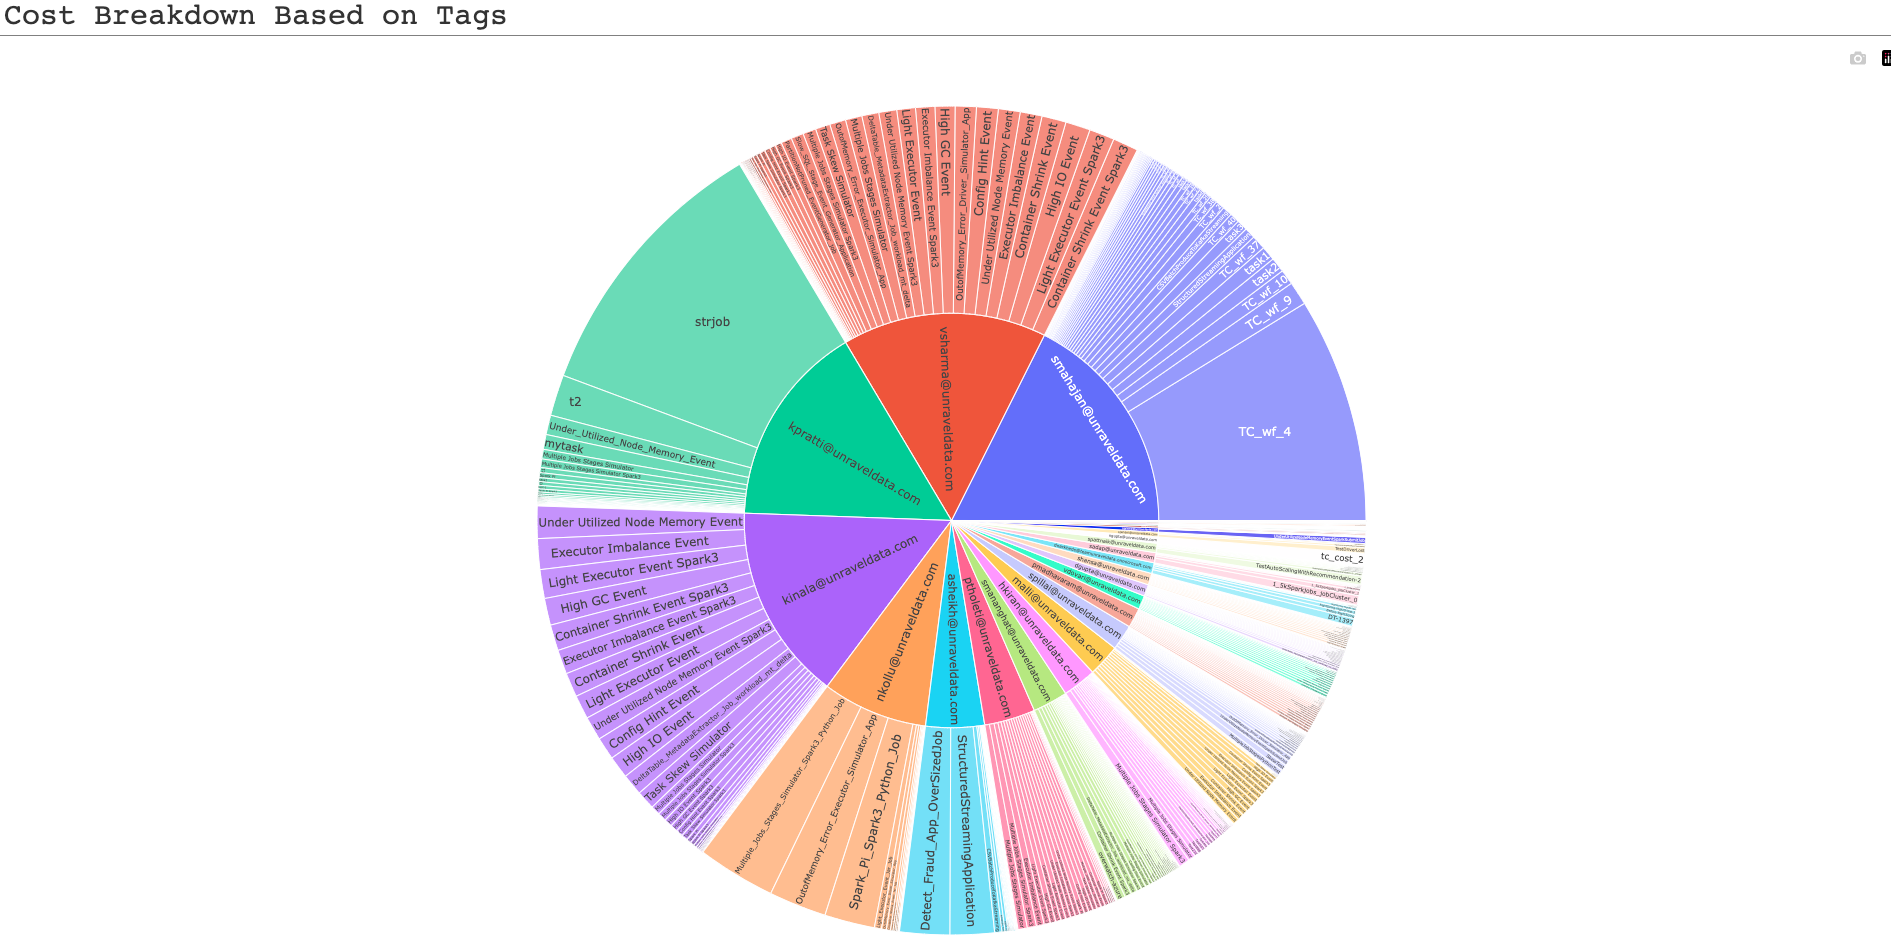
You can click a slice on the pie chart to view the details of a specific tag. Click again on the pie chart to view all the slices.
The day-wise costs are plotted in a line graph.
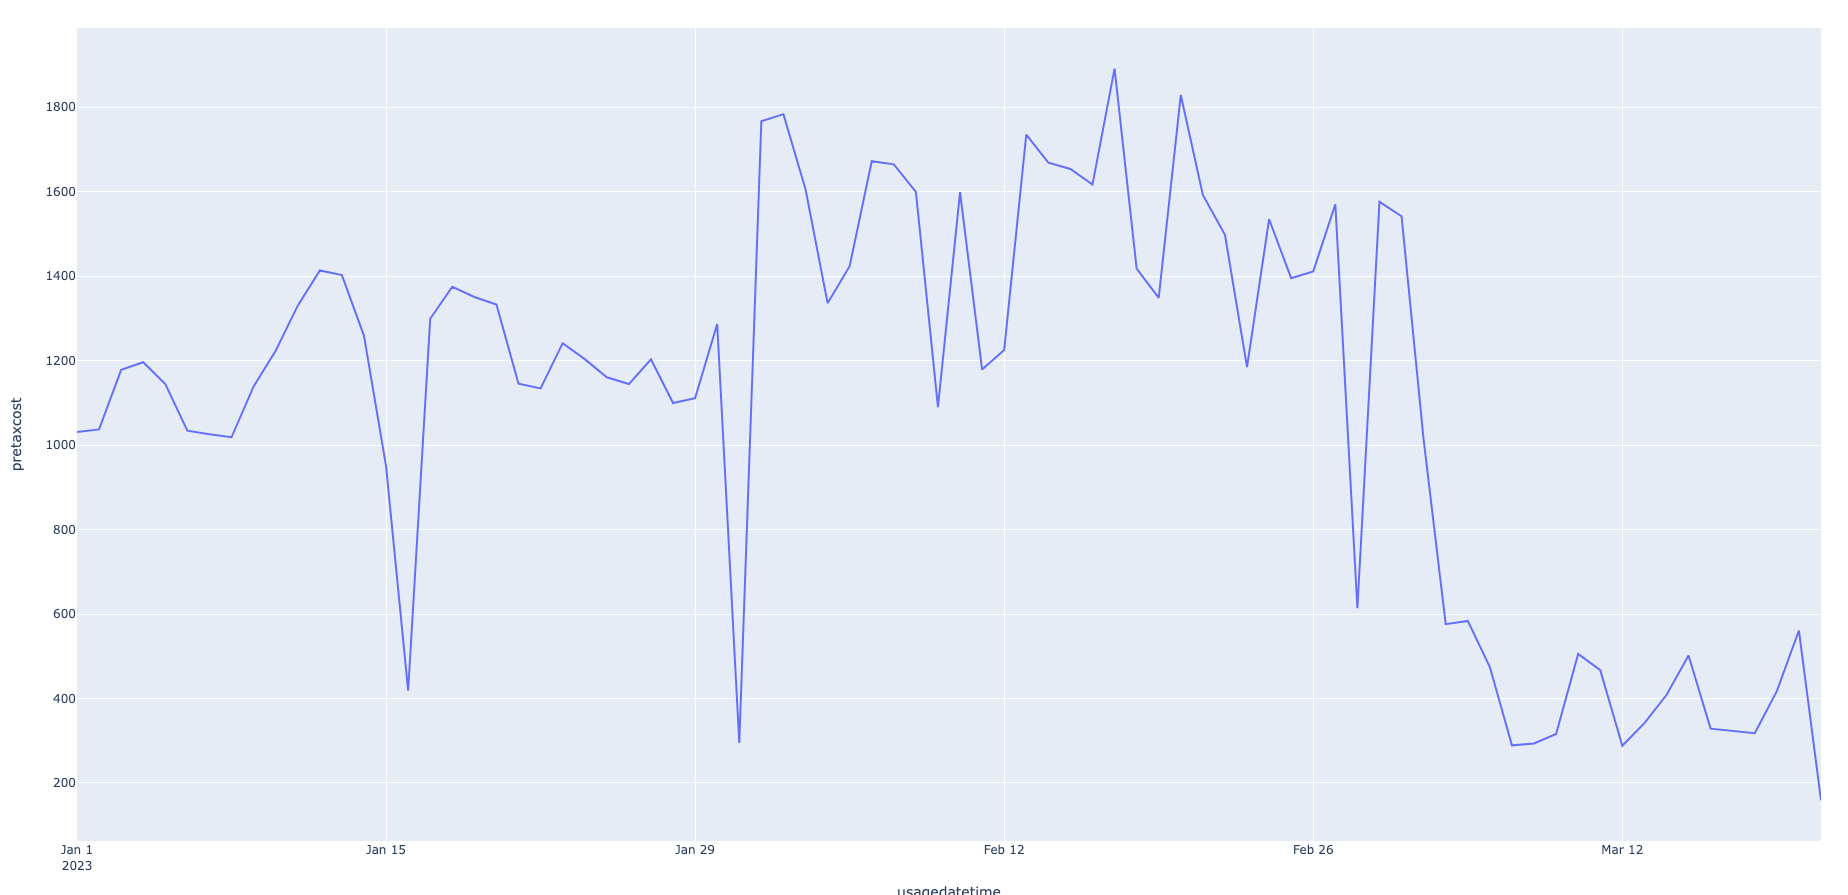
The cost trend is plotted for different tags and the highest cost incurred for each tagged item is highlighted.
This report provides information on the rates in dollars for each service that Azure provides over a period.