HDFS Usage Analysis Report
The report provides a detailed analysis of HDFS file usage.
Click Generate Reports > New button.
In the New Report dialog box, enter the following details.
Items
Description
General
Name
Name of the report.
Environment
Select your platform. The reports corresponding to the selected platform are only listed in the Report type. If you select the All option, all the reports are listed.
Report type
Type of report. Select HDFS Usage Analysis report.
Schedule
Select the checkbox to schedule the report to run daily, hourly, weekly, or monthly. You can also set the schedule can using a cron expression. You can expand the Example drop-down and select the corresponding options. The next four sample run times are displayed for reference.
Retention
The number of days to retain the report files. All the reports are stored in the
unity-one/src/assets/reports/jobsdirectory. After completion of the retention period, the report files are automatically purged.Parameters
TopK
The count of top storage-intensive files and users that must be included in the report.
Path depth
The path level to run the analysis.
Warm threshold in days*
Files that are not accessed for a while are considered as warm. You can specify the threshold in days for such files. If the data is not accessed within this threshold, then it is considered as warm.
Cold Threshold in days*
Files that are no longer used or files that need to be archived are considered as cold. You can specify a threshold in days for such files. If the files are not accessed or used within that threshold, then it is cold.
Cluster*
Specify the cluster.
Notifications
Email to
Email ID to send the notification when the report is generated. You can specify multiple email IDs with comma separation. You can also select the Attach Files to Email checkbox to receive the reports as an attachment.
Advance Options
Profile Memory
Select this option if you want to generate logs that help to troubleshoot scenarios where the report takes excessive time to generate or fails to generate.
Caution
The option will increase the report run time excessively.
Click OK. The generated reports will be listed under Reports on the App UI.
Select the generated report and then click Run. After the report is successfully run, the details of the report runs are listed in the Run box on the right.
Click the following:
HTML files link to view the report details.
Input parameters link to view the parameters you chose to run the report.
Log file link to view the logs of the report.
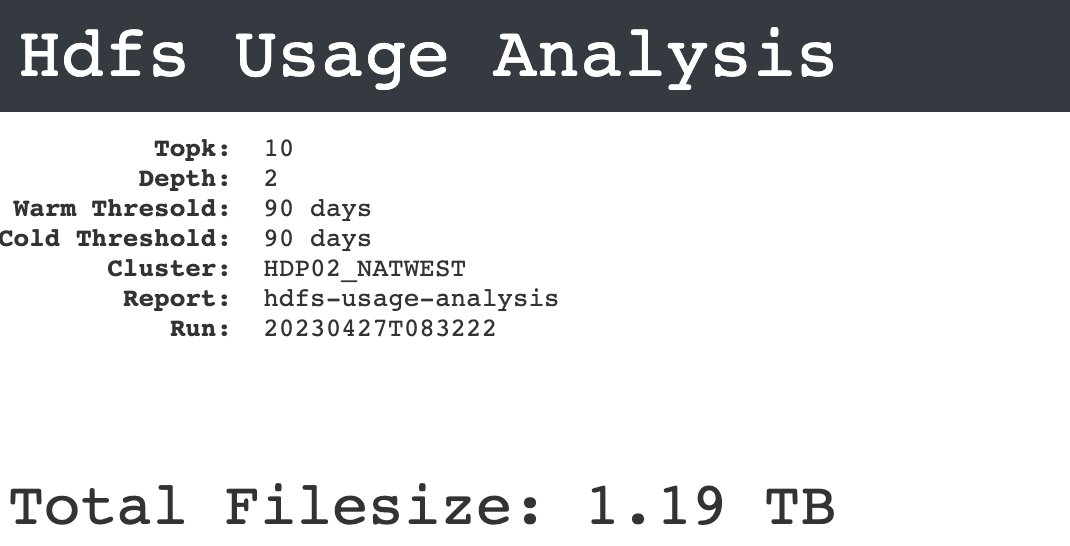
The HDFS Usage Analysis report displays the following sections:
This section provides the total HDFS file size.
This section provides the breakdown of hot, cold, and warm files based on their corresponding accesses.
Hot: Files that are often accessed are considered as hot.
Warm: Files that are not accessed for a while are considered as warm.
Cold: Files that are no longer used, or files that need to be archived are considered as cold.
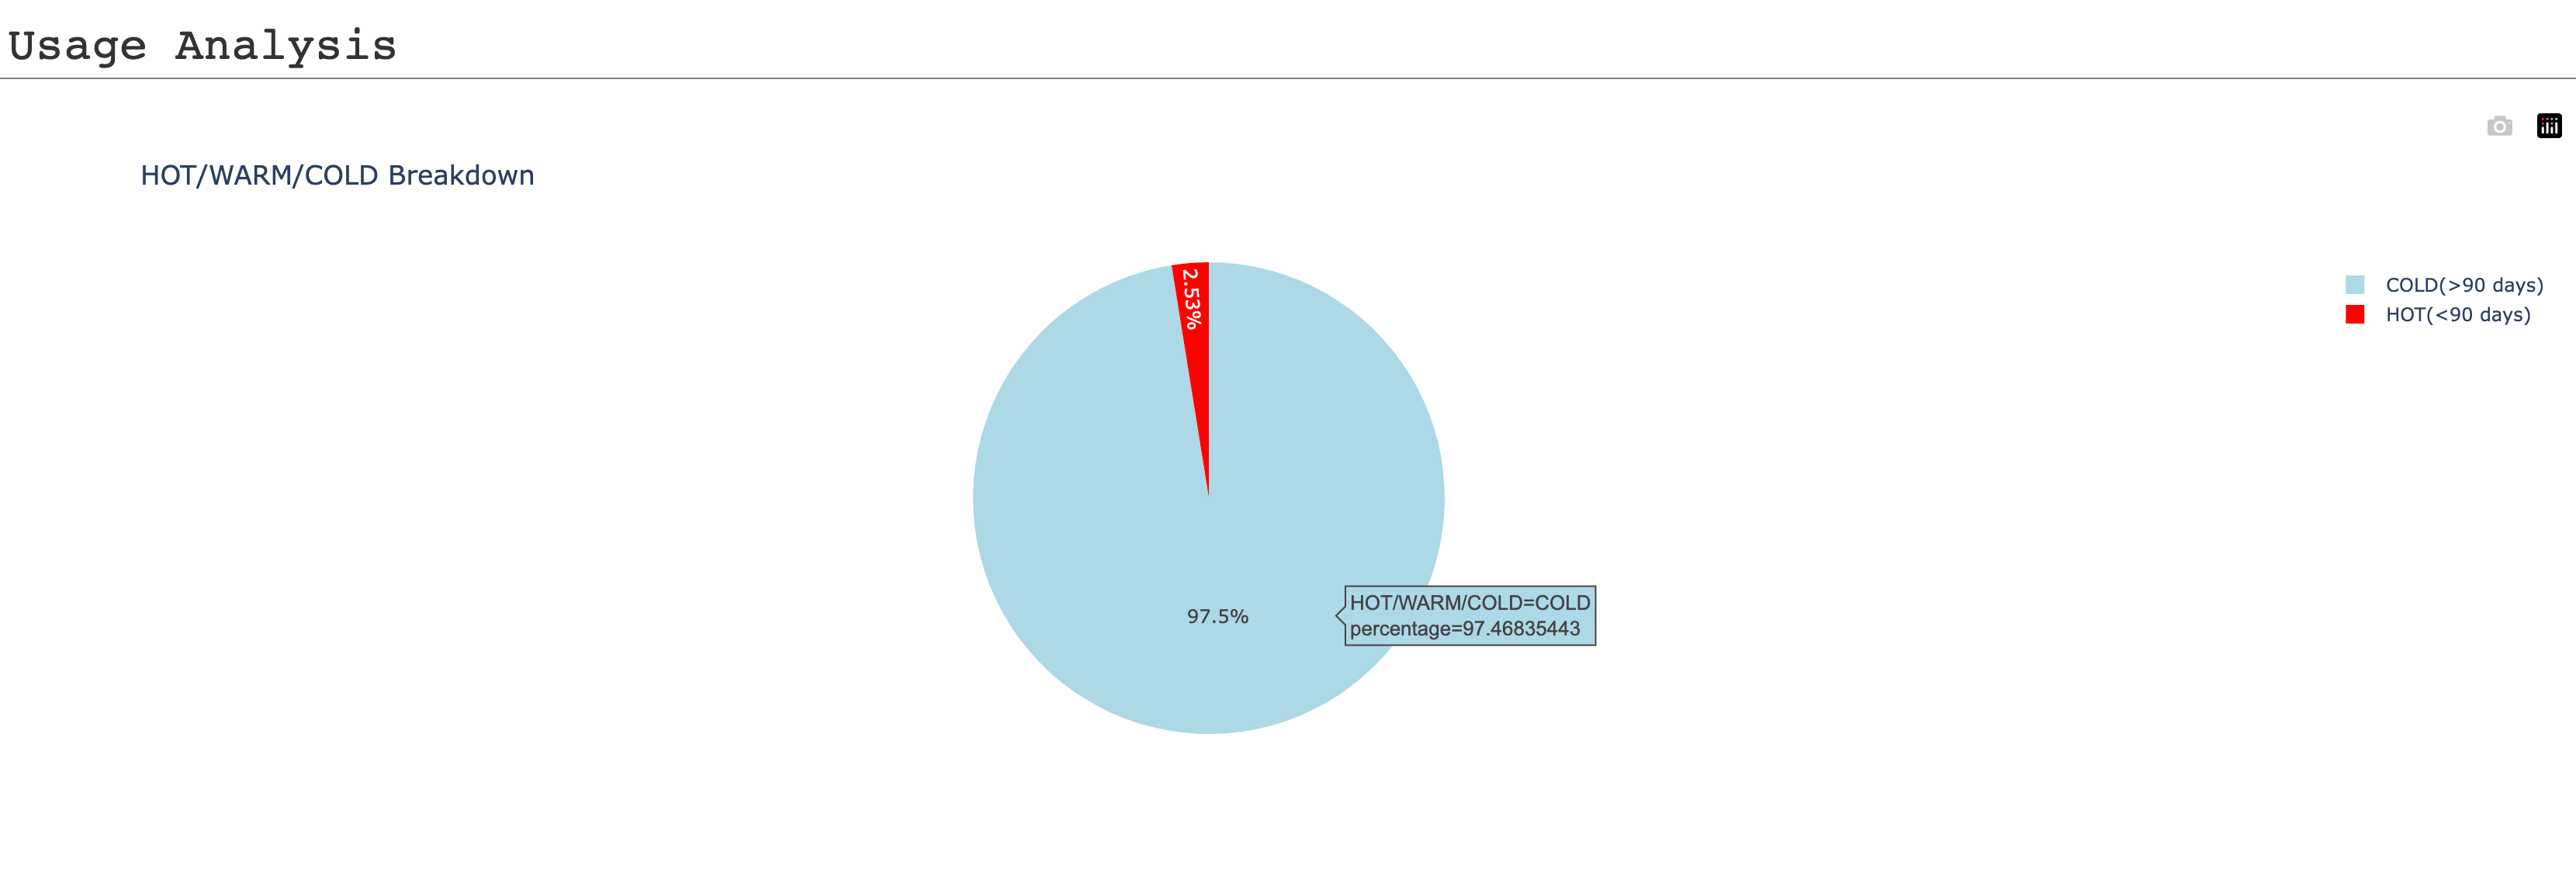
You can do the following in this section:
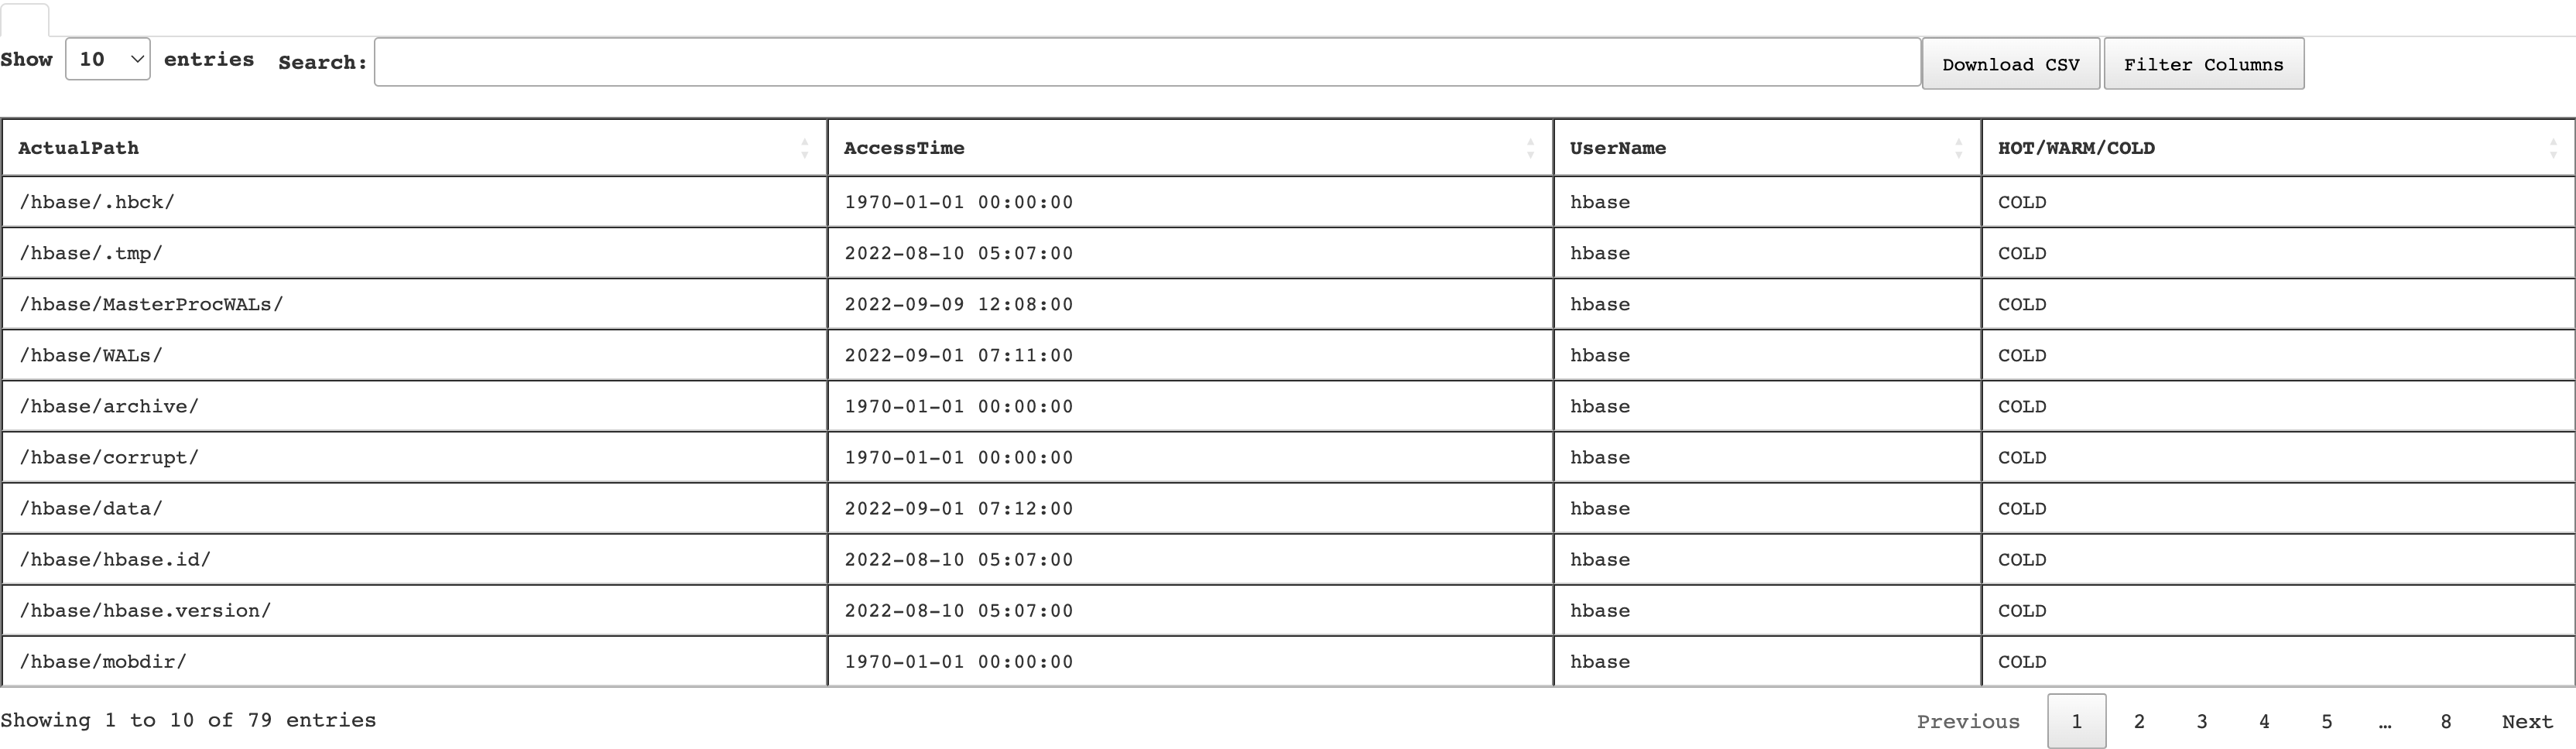
View the pie chart and table details, which analyze the type of usage (hot, warm, and cold) of the HDFS files.
In the Search box, of the table enter partially or entirely the file path to find the usage details of a specific HDFS file in a cluster.
Click the Filter Columns button and select the columns that you want to be listed in the Usage analysis table.
Click the Download CSV button to export the details of the HDFS files usage analysis in a CSV format.
This section provides the details of the top K storage-intensive users. The details are also plotted on a bar graph.
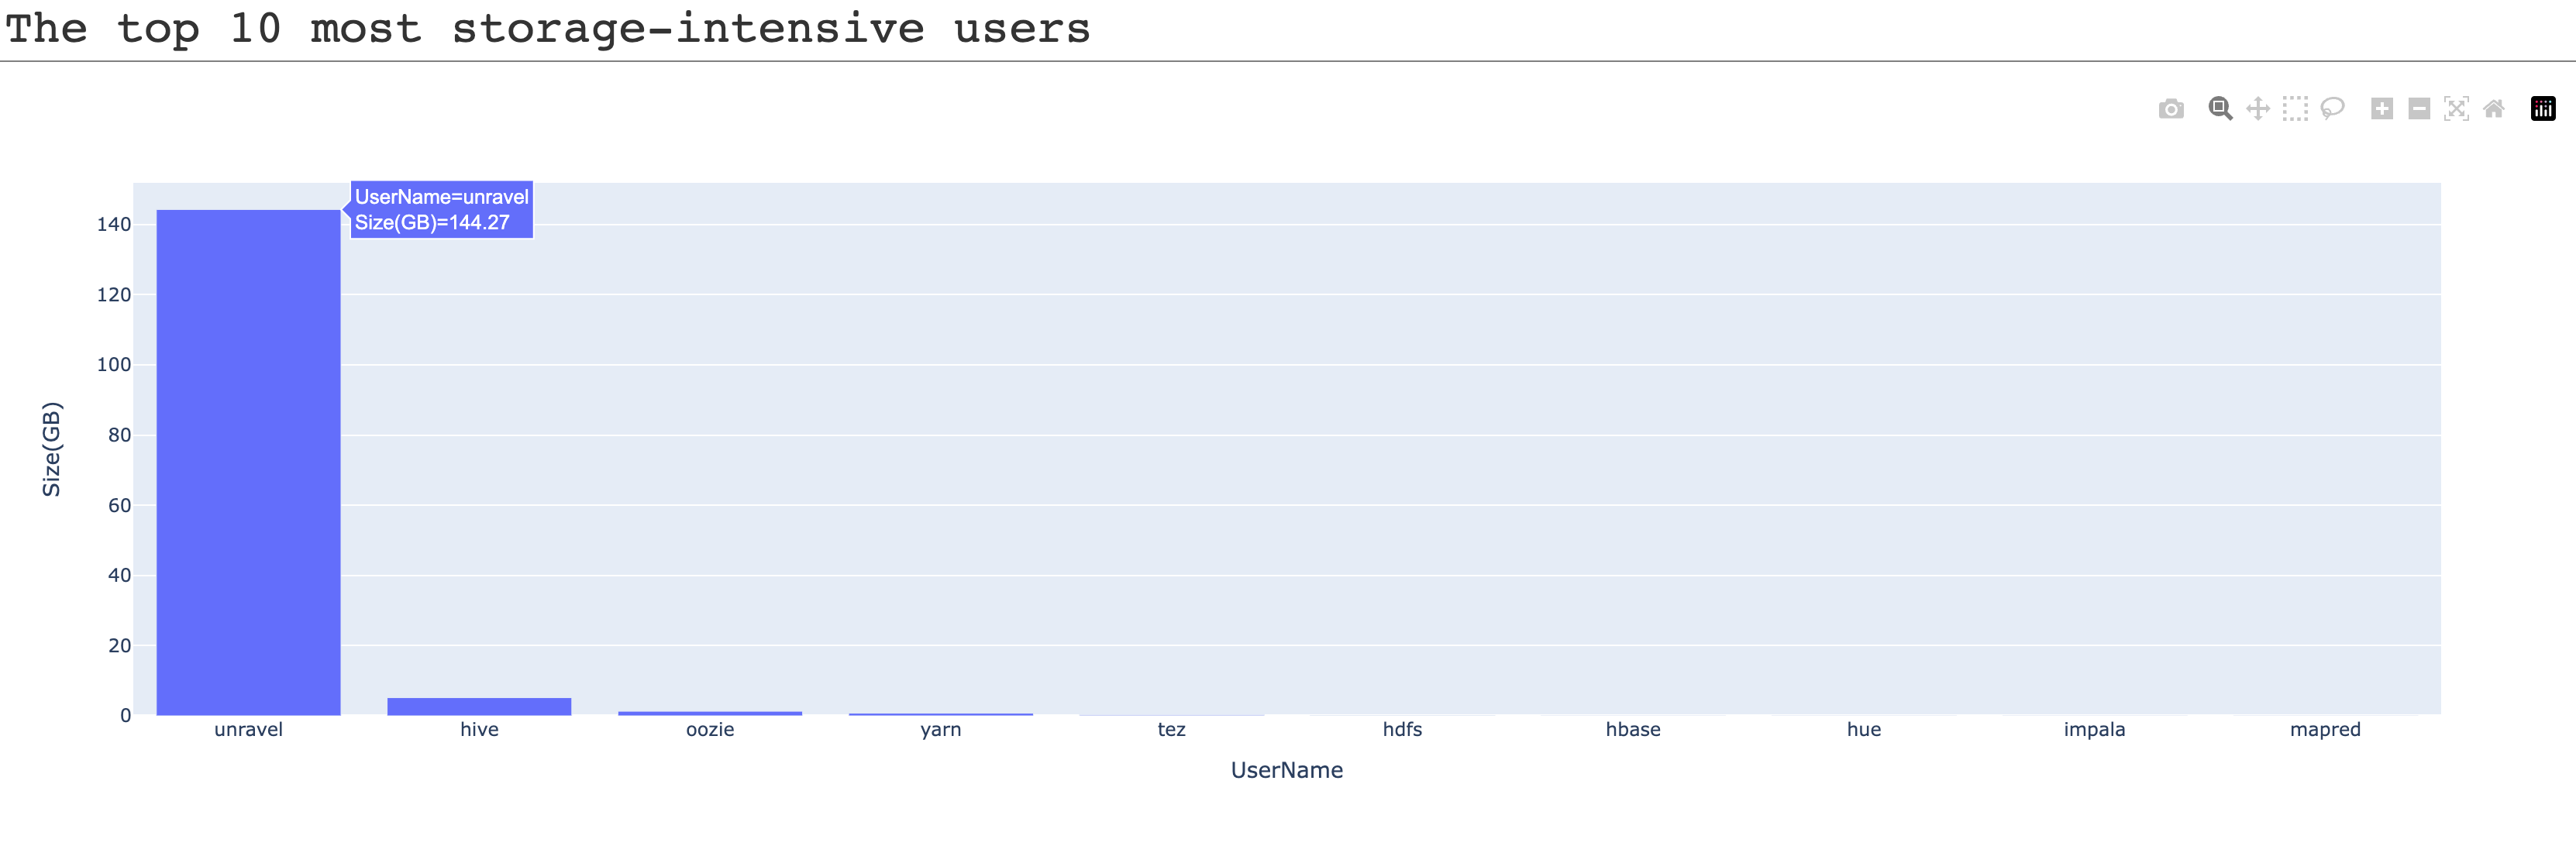
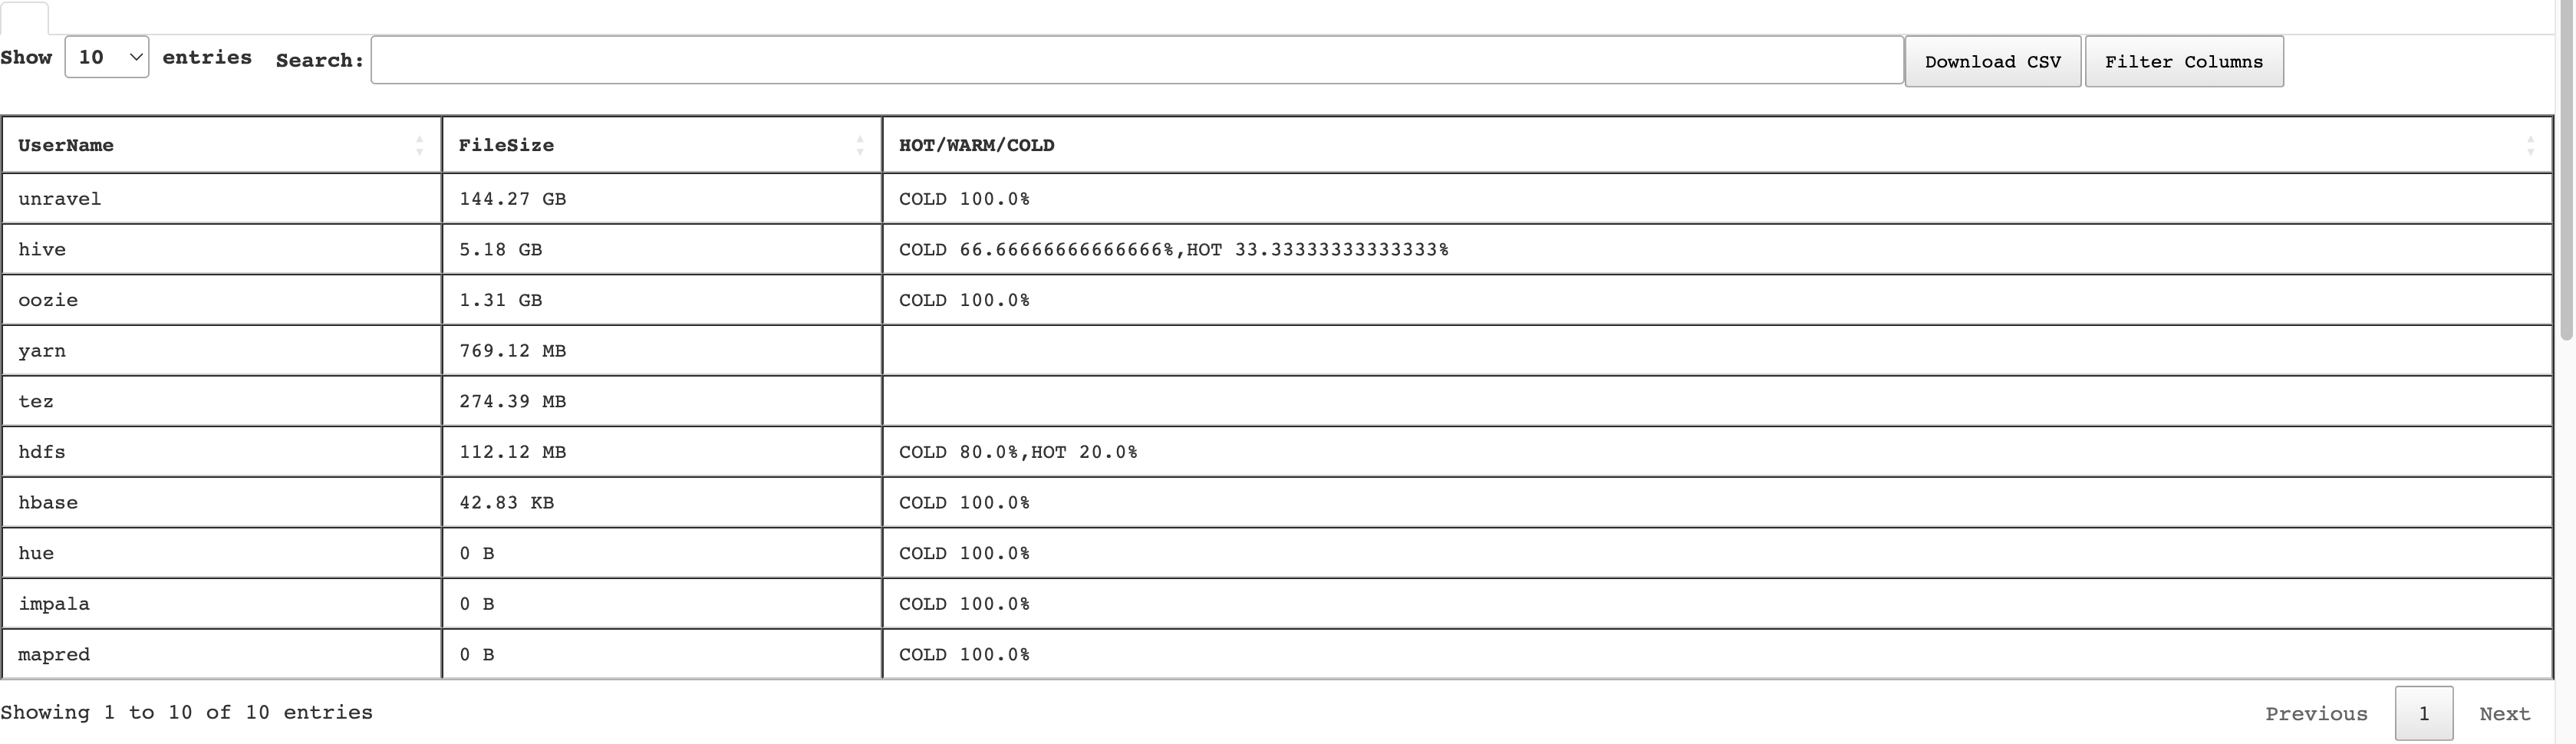
You can do the following in this section:
View the bar chart, which plots the top storage intensive user, and the table with details of each user and their corresponding usage of the HDFS files.
In the Search box, of the table enter partially or entirely the username to find the usage details of a specific user.
Click the Filter Columns button and select the columns that you want to be listed in the TopK table.
Click the Download CSV button to export the TopK details of the files usage by the user in a CSV format.
This section provides the details of the top K storage-intensive files. The details are also plotted on a bar graph.
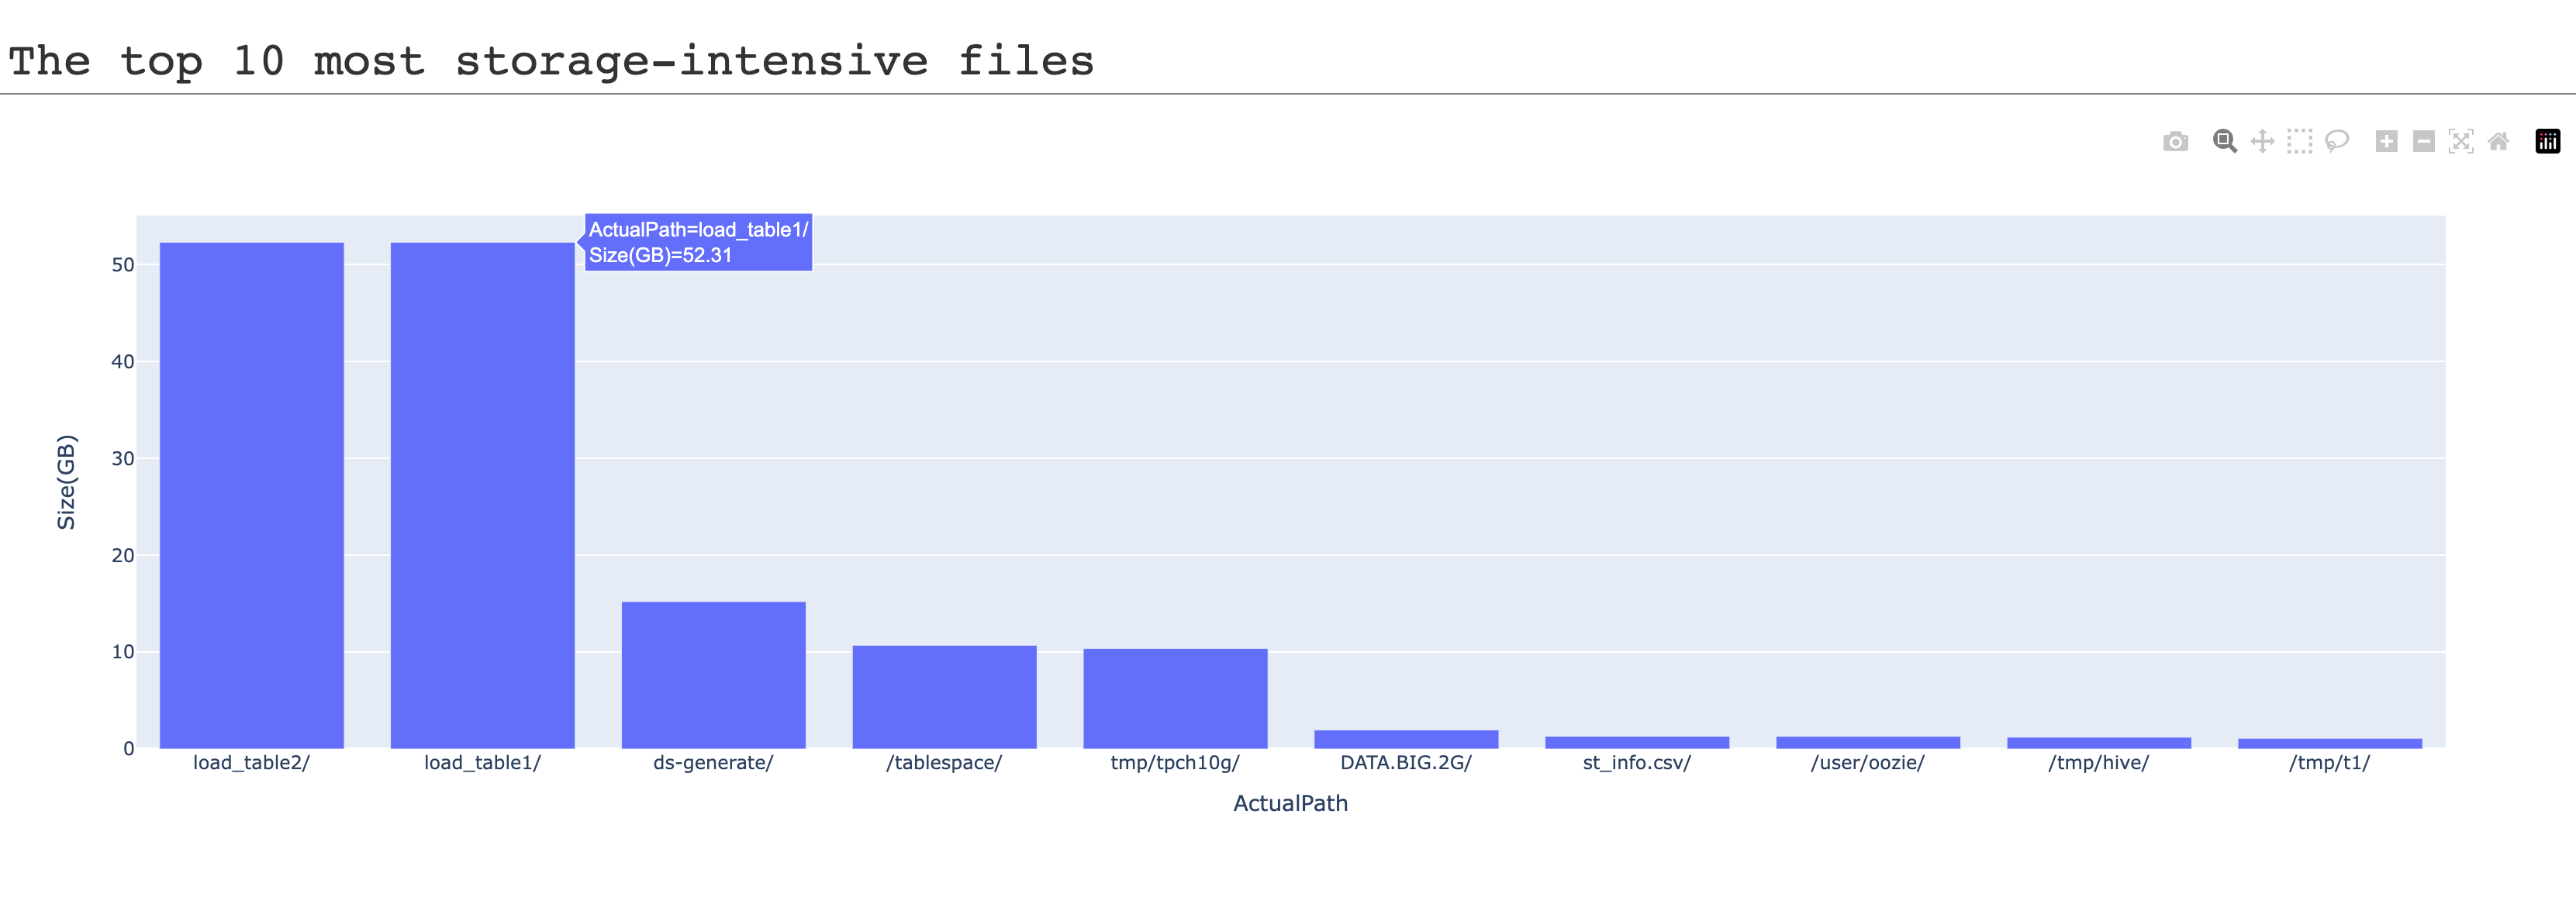
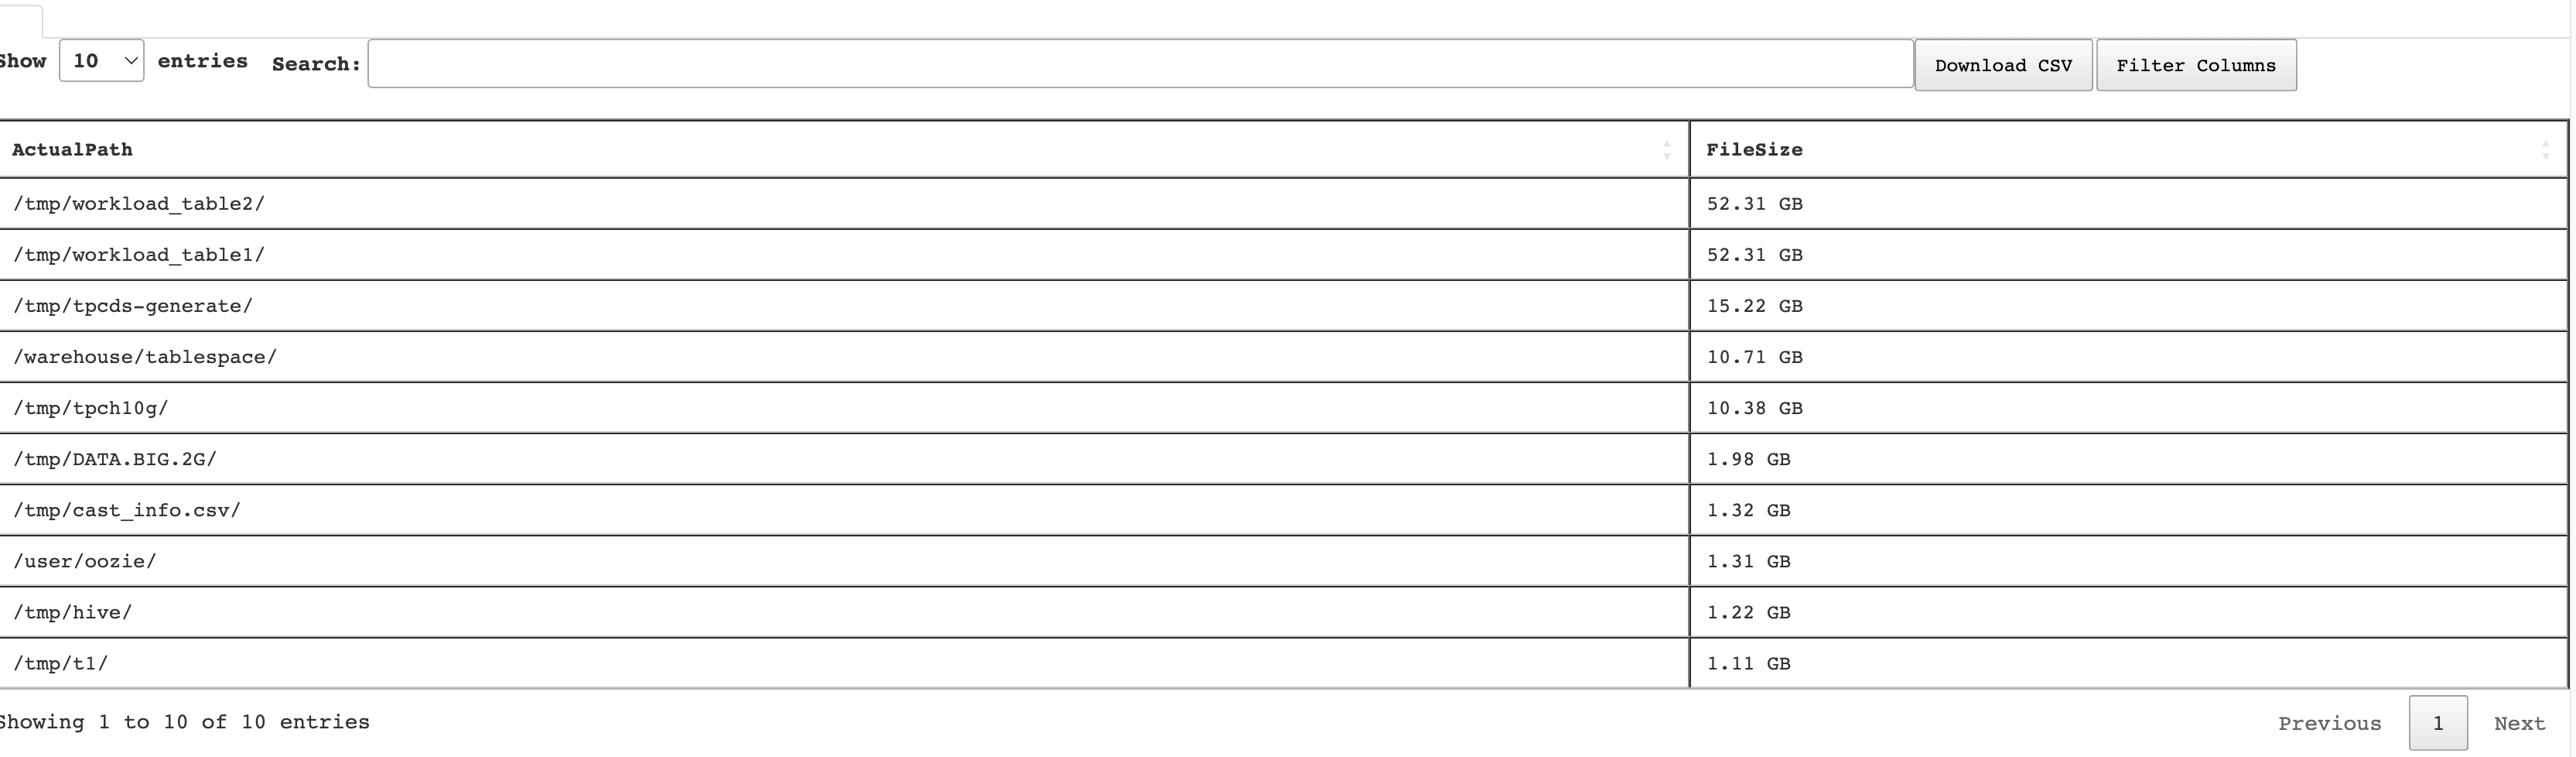
You can do the following in this section:
View the bar chart, which plots the top storage-intensive files, and the table with details of the HDFS files.
In the Search box, of the table enter partially or entirely the file path to find the file size of a specific file.
Click the Filter Columns button and select the columns that you want to be listed in the TopK table.
Click the Download CSV button to export the TopK details of the files in a CSV format.