Unravel Spark pipeline and Table worker benchmarking
The Unravel 4.7.9.1 release is aimed at bringing the performance of Spark pipeline and Table workers to scale. Extensive benchmark testing was conducted to compare the performance of the Spark worker and Table worker between versions 4.7.5.0 and 4.7.9.1. Based on the analysis, this document presents the results and recommended settings for 4.7.9.1.
The Spark worker was tested for the following:
Average message processing rate per consumer per second is the number of Kafka messages processed per second.
Average percentage of CPU utilization
Total memory allocation
A comparative study was also done between Unravel 4.7.5.0 and 4.7.9.1 versions. This study used G1GC (Garbage First Garbage Collector) and ZGC (Z Garbage Collector) configurations for different JAVA versions. The study analyzed the extent of performance improvement that can be achieved with and without these configurations for Unravel versions 4.7.5.0 and 4.7.9.1.
Based on the findings, Unravel recommends node sizing, database sizing, and GC settings to help you achieve enhanced performance.
The Table worker daemon, responsible for populating the Data page, was tested for the following with polling batch sizes of 1 million, 500 K, and 100 K against tables and partitions metadata.
Polling and processing time
Memory utilization
Based on the findings, Unravel provides recommendations for the polling limits of tables and partitions that are best suited for achieving the desired polling and processing time as well as max memory consumption.
Spark worker
In this section, the Spark worker performance results are presented in terms of processing rate, CPU utilization, and memory allocation. These results were generated with simulated data without event log loading. The performance benchmark testing was done in a standalone (on-prem) environment, multi-cluster (on-prem) environment, and Databricks (cloud) environment.
The following configurations were used to survey the Spark worker performance:
G1GC configuration in a standalone (on-prem) environment with custom JDK JAVA 8.
G1GC and ZGC are configured in the multi-cluster (on-prem) environment with default JRE 17.
G1GC and ZGC configuration in Databricks cloud environment with default JRE 17.
Configurations | Standalone (on-prem) environment | Multi-cluster (on-prem) environment | Databricks (cloud) environment |
|---|---|---|---|
JAVA version | Custom JDK - JAVA 8 | Default JRE 17 | Default JRE 17 |
Setup | Single node setup with 1 Spark worker and 8 consumers Insights worker with a default memory of 6 GB | Single node setup with 1 Spark worker and 8 consumers Insights worker with a default memory of 6 GB | Single node setup with 1 Spark worker and 32 consumers. Insights worker with a default memory of 6 GB |
Maximum Allocated memory | 16 GB | 16 GB | 54 GB |
Unravel node sizing | CPU: 8 cores Memory: 64 GB Disk space: 500 GB | CPU: 8 cores Memory: 64 GB Disk space: 500 GB | CPU: 32 cores Memory: 125 GB Disk space: 1 TB |
Cluster type | CDH. | 4 edge nodes (2 CDH and 2 CDP clusters) | Azure Databricks |
Database | External MySQL 8.0.33 Tuning parameters:
| External MariaDB 10.5 Tuning parameters:
| Azure MYSQL 5.7 was used with the following parameters:
|
Spark worker performance results
The following graphs present the Spark worker performance results in terms of message processing rate, which is the number of Kafka messages processed per second, CPU utilization, and memory allocation.
Note
These results are generated with com.unraveldata.process.event.log set to false, which means the results were generated without event log loading. Setting this parameter to true may result in a slight deviation in the performance numbers.
The results showed that an average of 40 to 65 mps processing rate per consumer could be expected even with the event log loading.
The average CPU utilization was 25% to 30% against a total allocated memory of 16% for on-prem (standalone and multi-cluster environments). For Databricks, the average CPU utilization was 10% against an allocated memory of 54%.
Findings
The Standalone environment (custom JDK JAVA 8), with the G1GC configuration, showed an average processing rate of 70 mps per consumer.
The multi-cluster environment (default JRE 17), with the ZGC configuration, showed an average of 80 mps improvement in the processing rate compared to the G1GC configuration, which showed an average of 65 mps.
The Databricks environment (default JRE 17), with the ZGC configuration, showed an average of 45 mps improvement in the processing rate compared to the G1GC configuration, which showed an average of 40 mps.
Comparative analysis of Spark worker performance in 4.7.9.1 Vs. 4.7.5.0
A comparative analysis was conducted to study the processing rate per consumer of the Spark worker performance in the Standalone on-prem environment with custom JDK - JAVA 8. The following image show the Spark worker performance in Unravel version 4.7.9.1 versus the performance in version 4.7.5.0.
Upgrading from Unravel version 4.7.5.0 to 4.7.9.1 with the G1GC config can achieve a 212 % improvement in the average processing rate for the Spark worker. The average CPU utilization is reduced to 20 - 25 %, and the average memory allocation is reduced to 16 GB for 8 consumers in a single Spark worker. The results are presented in the following tables:
Configurations | Results for average processing rate |
|---|---|
4.7.5.0 version without G1GC | 25 mps |
4.7.5.0 version with G1GC | 40 mps 60% improvement over 4.7.5.0 version without G1GC configuration after applying the G1GC configurations. |
4.7.9.1 without G1GC | 55 mps 120% improvement over 4.7.5.0 version without G1GC configuration in the Unravel 4.7.9.1 version without applying the G1GC configuration. |
4.7.9.1 with G1GC | 78 mps 212% improvement over 4.7.5.0 version without G1GC configuration in the Unravel 4.7.9.1 version after applying the G1GC configuration. |
Findings
| |
Configurations | Results for average % of CPU utilization |
|---|---|
4.7.5.0 version without G1GC | 40% |
4.7.5.0 version with G1GC | 30% |
4.7.9.1 without G1GC | 23% |
4.7.9.1 with G1GC | 25% |
Findings Upgrading from Unravel version 4.7.5.0 to Unravel version 4.7.9.1, with or without applying the G1GC configurations, the CPU utilization is between 20 - 25 percent. Whereas with the 4.7.5.0, with or without the G1GC configurations, the CPU utilization is between 30 - 40 percent. | |
Configurations | Results for memory allocation |
|---|---|
4.7.5.0 version without G1GC | 48 GB memory allocated for 8 Spark workers with 6 GB memory for each worker. |
4.7.5.0 version with G1GC | 48 GB memory allocated for 8 Spark workers with 6 GB memory for each worker. |
4.7.9.1 without G1GC | 16 GB memory allocated for 8 consumers in a single Spark worker. |
4.7.9.1 with G1GC | 16 GB memory allocated for 8 consumers in a single Spark worker. |
Findings Improved memory allocation for the Spark worker after upgrading to 4.7.9.1. | |
Learnings
For JRE version 8, using G1GC settings resulted in better performance.
JRE 17 already runs with G1GC settings by default. For JRE version 17, using ZGC settings resulted in better performance over G1GC.
Recommendations
Unravel recommends the following node sizing, DB sizing, and GC settings.
Node sizing recommendations | DB sizing recommendations | GC settings recommendations |
|---|---|---|
|
|
|
Table worker
A benchmark test was conducted to ensure the Table worker daemon was functioning efficiently with extensive scaling. The scaling test was done with Hive metastore using 2 million tables and 17 million partitions.
Two separate multi-cluster setups were set to get the performance results for the Table worker performance.
Configurations | Multi-cluster setup 1 | Multi-cluster setup 2 |
|---|---|---|
Setup | Single node setup with the Table worker configured with 10 GB memory and with 8 consumers in Spark worker. 10 GB is the default memory configuration for the Table worker. The rest of the daemons run with their corresponding default configurations. | Single node setup with the Table worker configured with 10 GB memory and with 8 consumers in Spark worker was used. |
Core node | CPU and memory configuration included machines with 8 cores and 64 GB RAM. | CPU and memory configuration included machines with 8 cores and 64 GB RAM. |
Cluster type | CDP. | CDH. |
Edge nodes | 3 | 3 |
DB configurations |
|
|
The results for collective polling/processing time and memory utilization were derived using the following scenarios in batch sizes of 1 Million, 500 K, and 100K.
Scenario 1: Total tables: 110.6K, Total partitions: 16.5M
Scenario 2: Total tables: 1.6M, Total partitions: 7M
Scenario 3: Total tables: 9135, Total partitions: 15M
Scenario 4: Total tables: 74.9K, Total partitions: 27M
The results are listed in the following table:
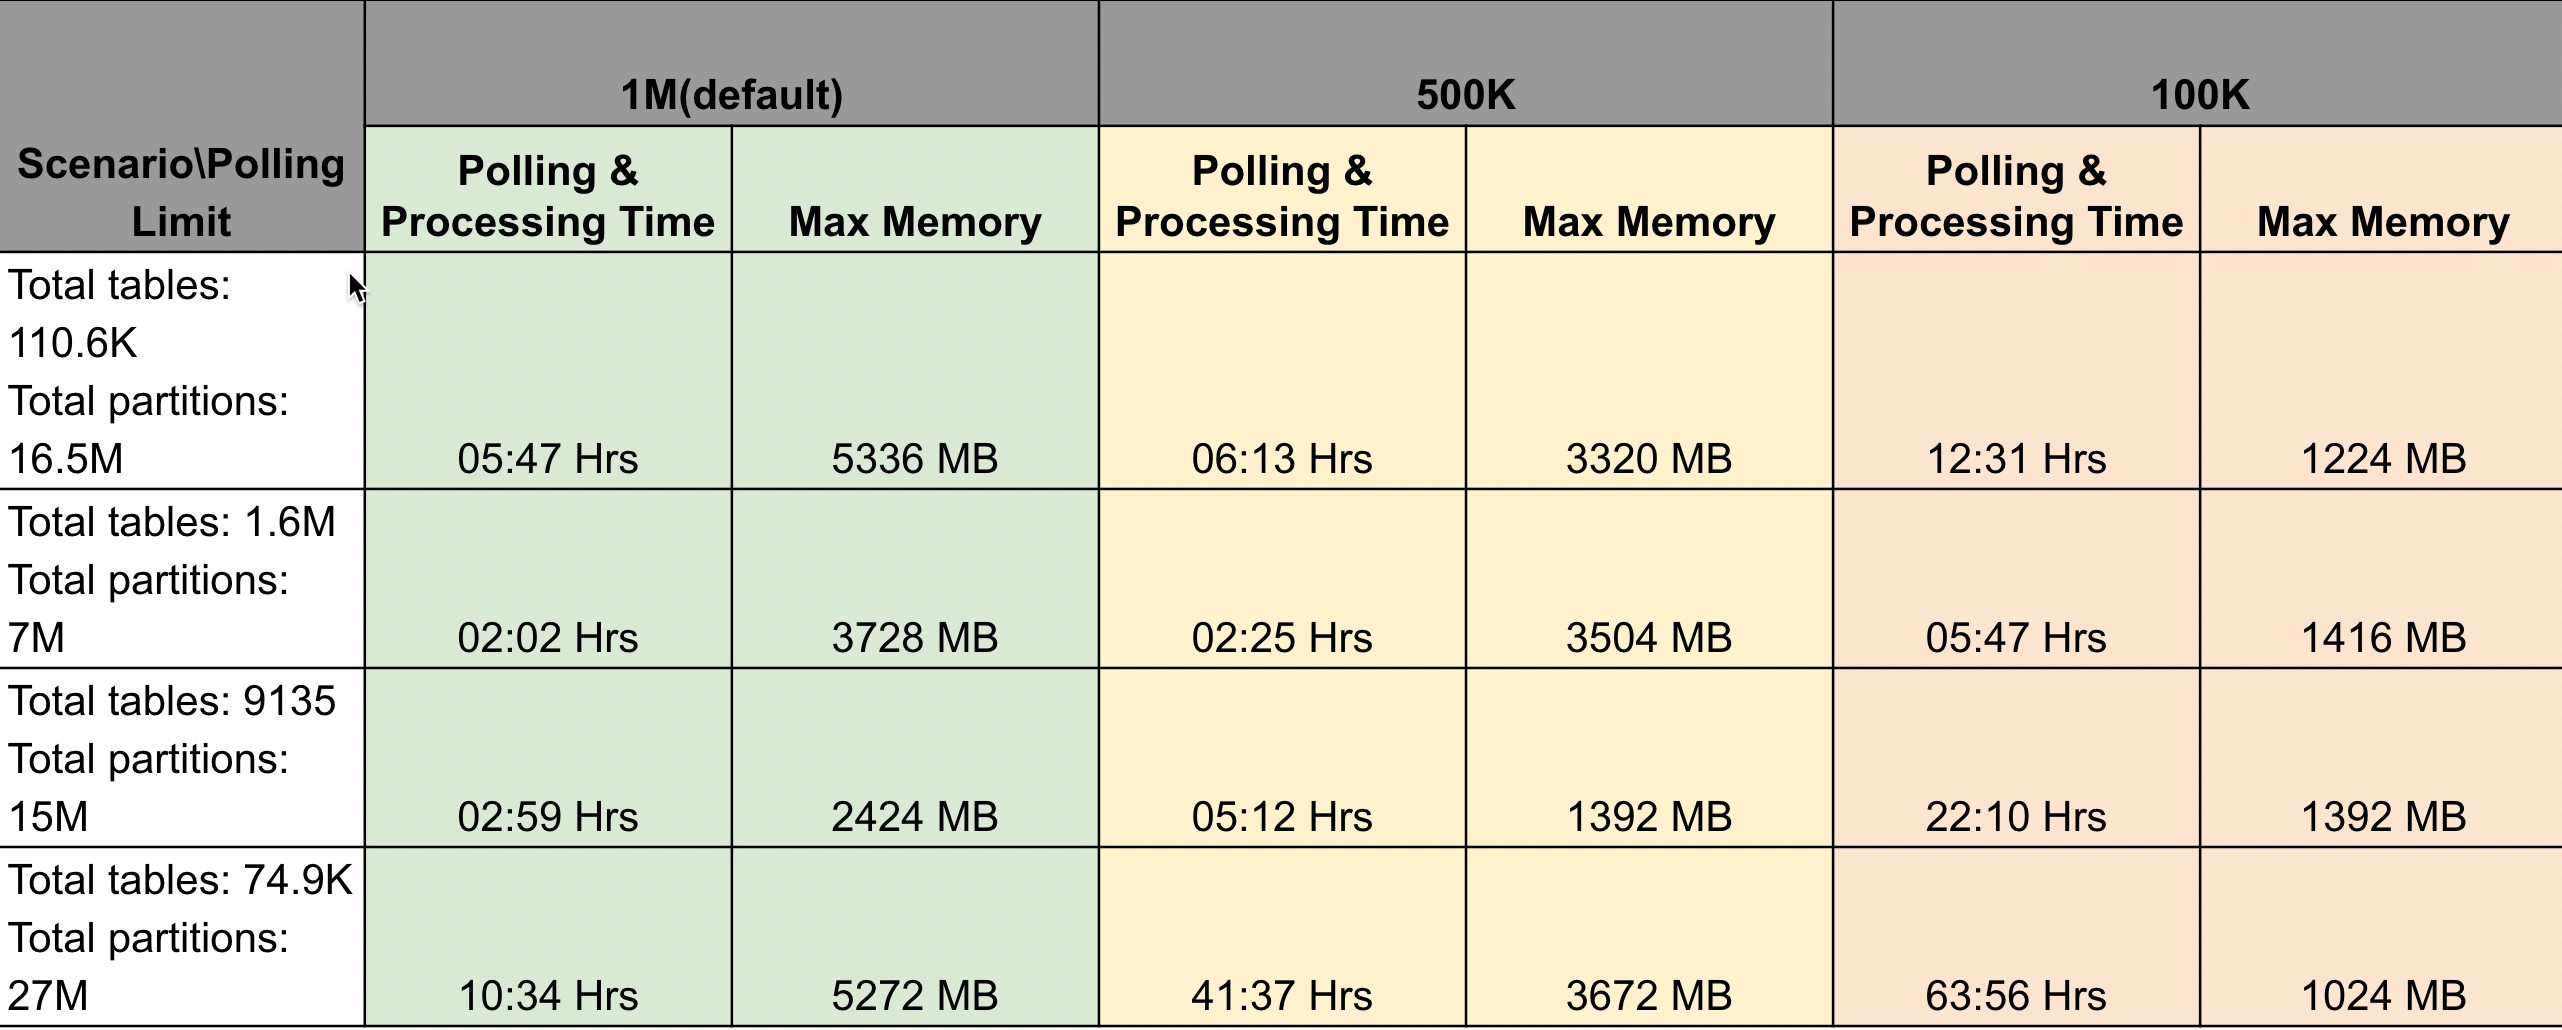
Recommendations
Table worker should not exceed the maximum memory utilization of 6 GB for any number of tables and partitions count, which is approximately 60% utilization of the total allocated memory of 10 GB (default).
Unravel recommends keeping the polling batch size at 1 million, the default batch size.
Configuration properties are available to modify the batch size for polling the table and partitions metadata based on the number of tables and partitions available in your Hive metastore. You can set different polling limits for tables and partition metadata.
Polling and processing time is inversely proportional to the polling limit, whereas the max memory is directly proportional to the polling limit. If you modify the batch sizes to below or above the default 1 million, you may have to compromise on the polling and processing time and the memory utilization.
Note
When the number of partition records in the Hive Metastore exceeds 27 million, there is a possibility that the data page may not display data in all the KPIs.