Job Runs
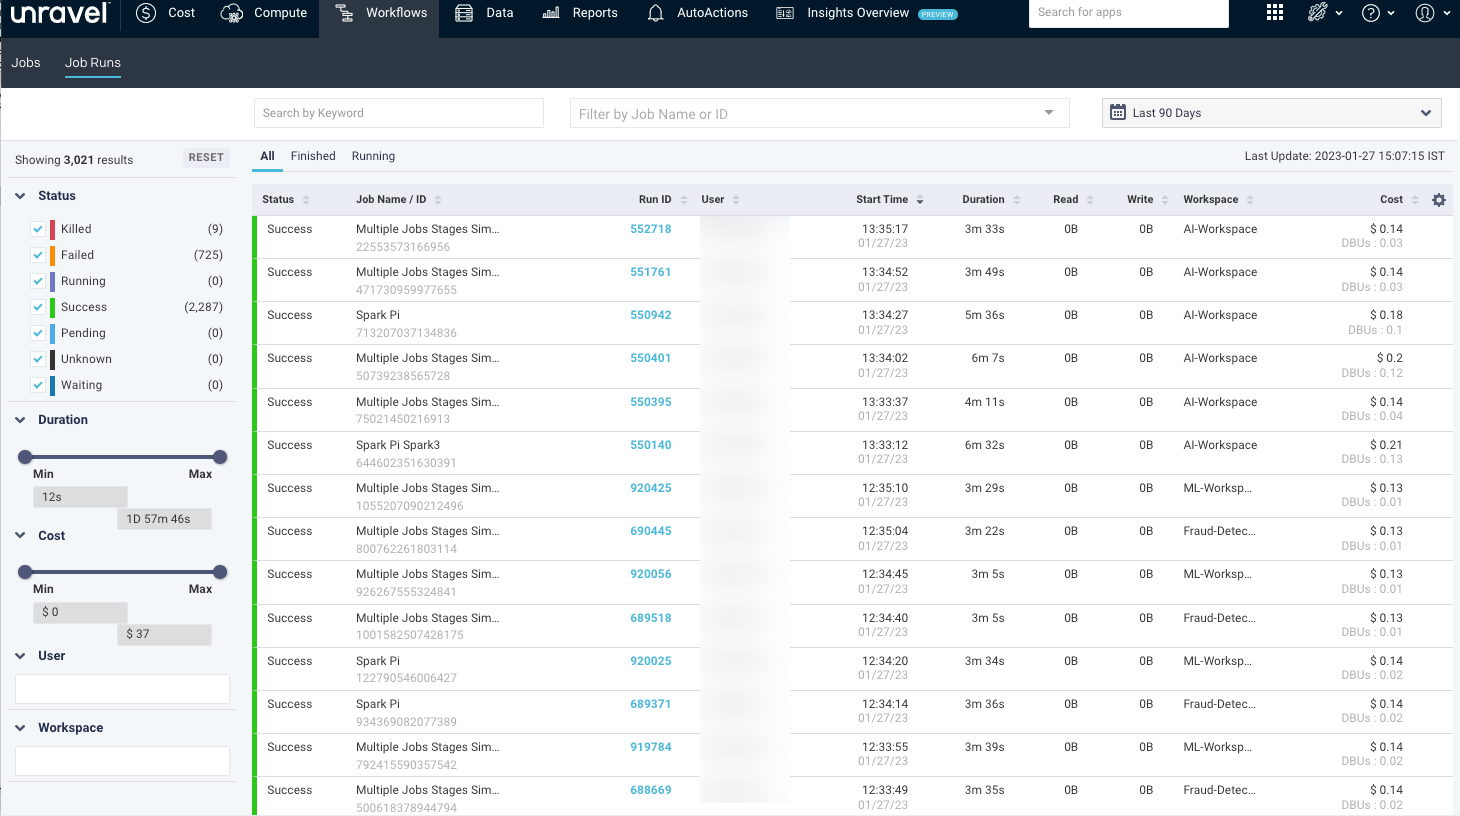
The Job Runs tab provides details about the job execution within different applications.
You can view a list of runs for all jobs.
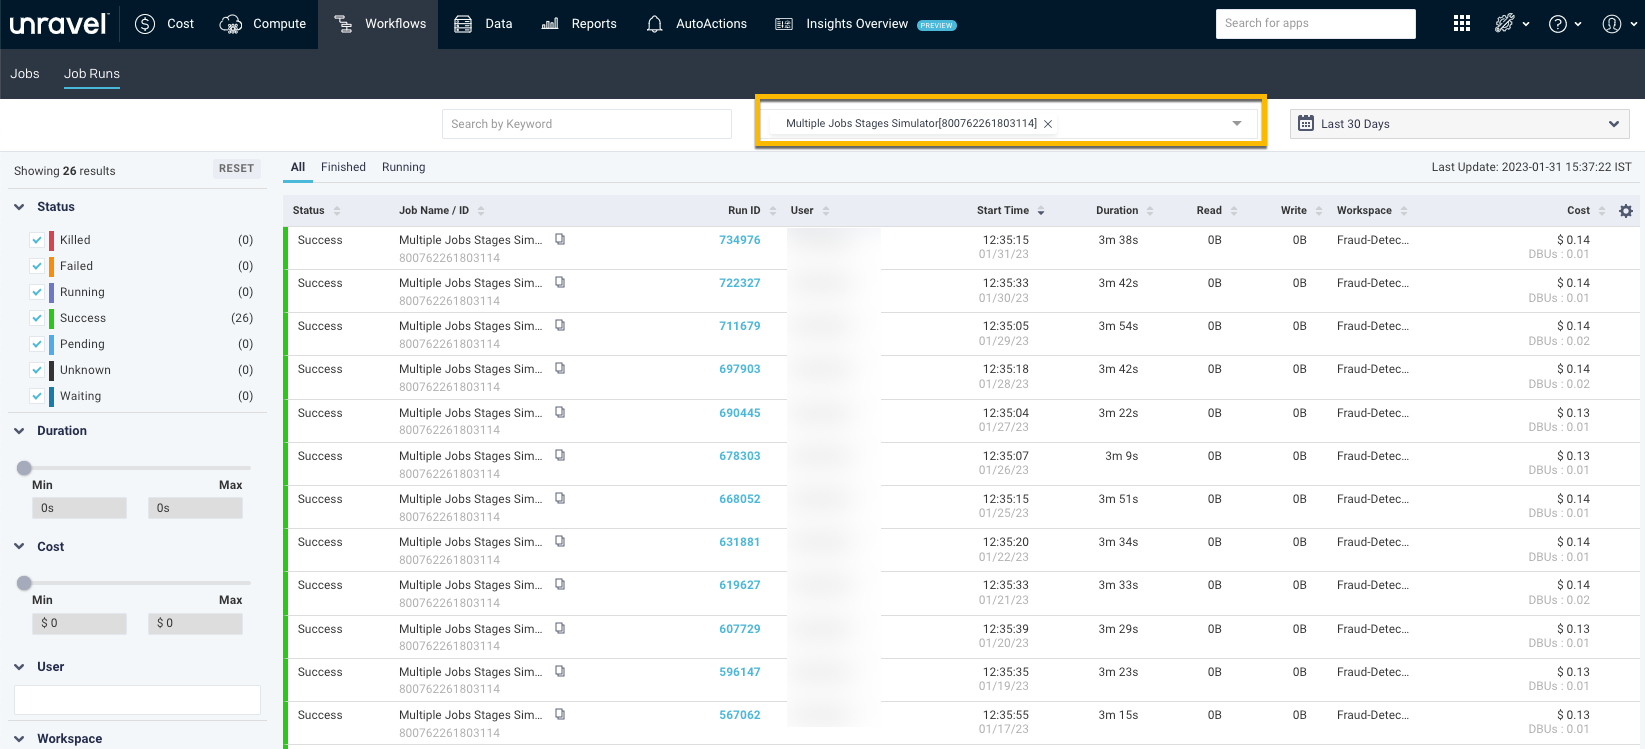
Alternatively, you can view a list of runs for the filtered jobs by using the job name or ID.
The details of a job run are listed in the following columns:
Columns | Description |
|---|---|
Status | App status. |
Job Name/ID | Name and unique ID of the job. |
Run ID | Unique ID of the run across a workspace. Click the link to navigate to the Job run details page. See View job run details. |
User | Name of the user who has run the job. |
Start time | The start time and day of the application. |
Duration | Total time taken by the application. |
Read | Total read operations by the application. |
Write | Total write operations by the applications. |
Workspace | Name of the Workspace. |
Cost | An estimated cost incurred in running the app. This cost is calculated based on VM and DBU prices. NoteThe cost for the Insights Preview page is derived from the dbx_cluster kind in Hitdocs, while the cost for the Jobs Run page is derived from the db kind in Hitdocs. Therefore, the costs displayed on these pages may not always match. |
Filter job runs
You can filter the job runs using any of the following options:
Date and Time: Select a date and time range of the apps using the date picker above the table.
Keyword: Use any keyword to filter the list by job name, job ID, run ID, and user name.
Filtering options: You can filter the applications using any of the following filtering options on the left panel:
Status: Select any of the following statuses, and the applications matching the status are displayed:
Success
Failed
Killed
Running
Waiting
Pending
Unknown
Duration: You can use the slider to set the range. The job runs matching the duration are displayed.
Cost: You can use the slider to set the range. The job runs matching the cost are displayed.
User: Click the text box and select a user. The corresponding job runs are displayed.
Workspace: Click the text box and select a workspace from the list. The corresponding job runs are displayed.
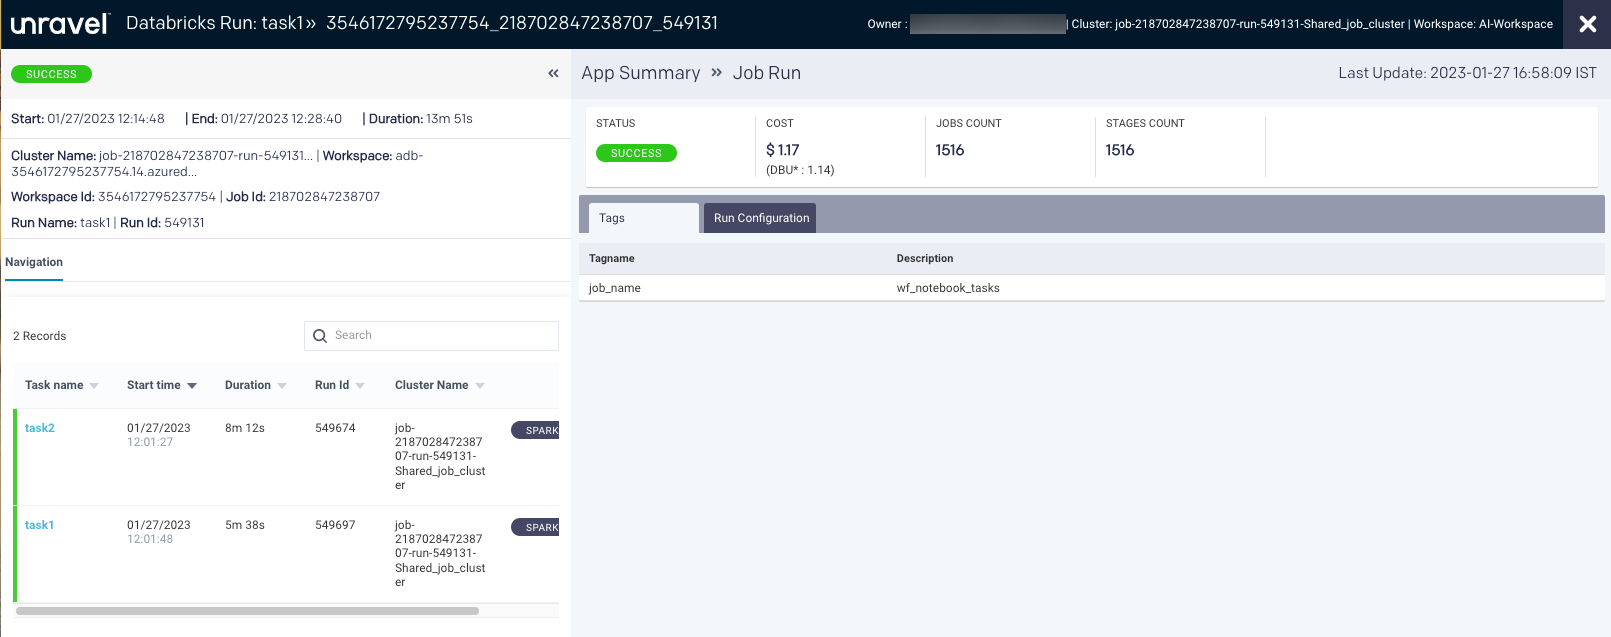
View job run details
You can access job run details from the Job Runs page. On the Job Runs page, click the link in the Run ID column to view job run details.
The job run details page includes information about the success or failure of each task in the job run.
From the Job Run details page, you can monitor job runs and view the following details of the selected job:
Tasks that run on different clusters
Execution of tasks
Tags at the job level
Run configuration information in JSON format
The following details are shown in the uppermost section of the job run details page.
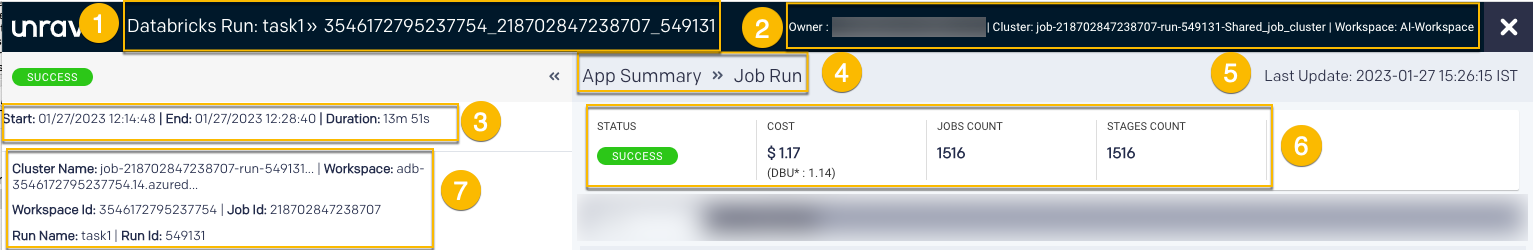
Item No. | Description |
|---|---|
1 | Name or ID of the job associated with the run. |
2 | Job owner name or email ID, cluster ID, and workspace ID. |
3 | Start time of the job run. End time of the job run. Duration of the job run. |
4 | Indicates the navigation drill-down into job run and tasks of the job. |
5 | Last update date and time of job run. |
6 | Status of the job run. The status of the run is either Success, Failed, Killed, Running, Waiting, Pending, or Unknown. The estimated cost of the job run. Total number of jobs in an application. Total number of stages in a job. |
7 | Details of the cluster name, workspace name, ID, job ID, run name, and ID. |
Navigation
The Navigation tab lists the tasks run in a job with the following details:
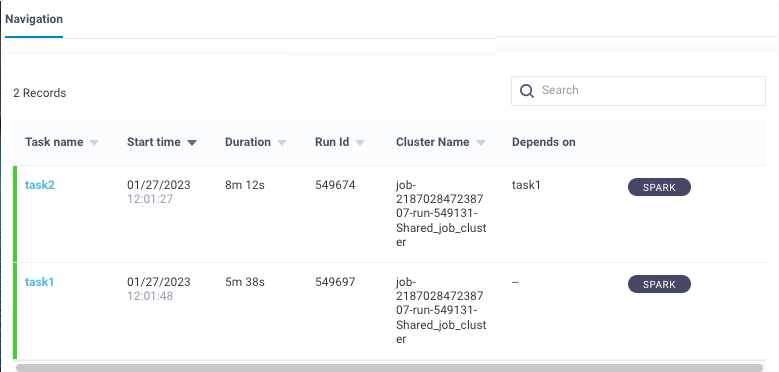
Task name: Name of the task run in a job
Start Time: The time when the task started (The start time for the run)
Duration: Period since the task has started
Run ID: An ID of the individual task
Cluster Name: Name of the cluster on which the task is run
Depends on: Name of the dependent task
Note
A dash in the Depends on column indicates that a task does not depend on any other task.
In the Navigation section, you can search for a specific task. Then, click the Spark button next to each task to navigate to the Spark details page. See Spark details page.
Select a task within the task list to view the task details. The following tabs are displayed on the right:
Resources:
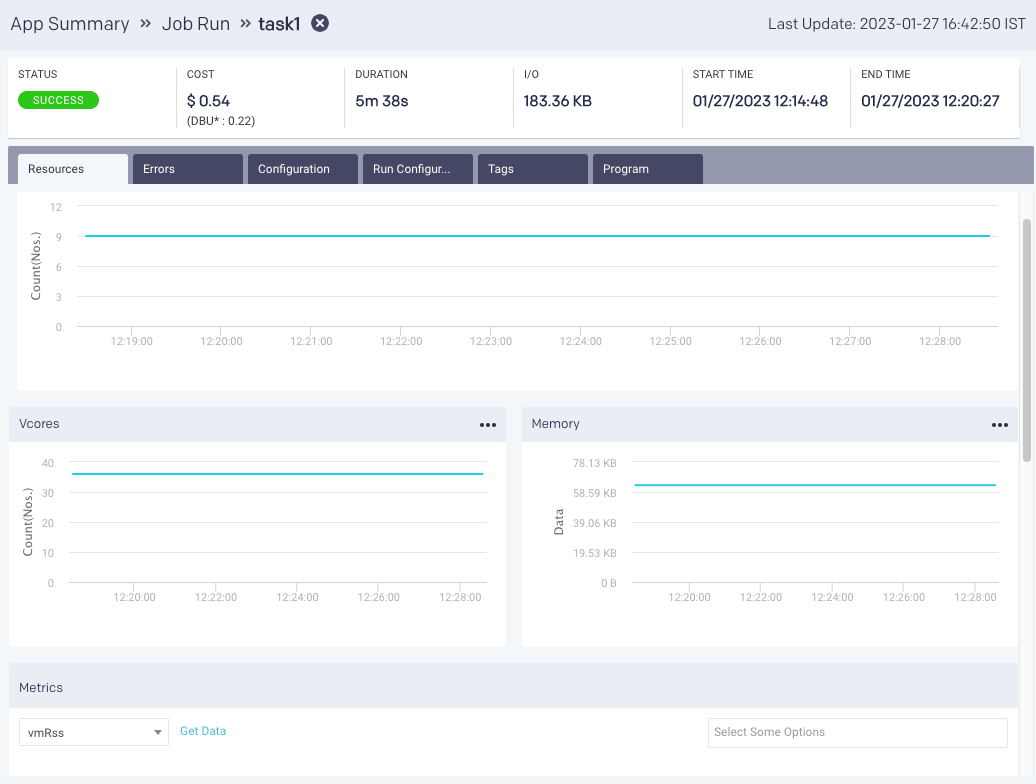
The resources contain the following charts:
Containers: Graphs the number of containers used for the job execution in a Spark app.
vCores Graphs the vCores used for running the job in a Spark app.
Memory: Graphs the memory used for running the jobs.
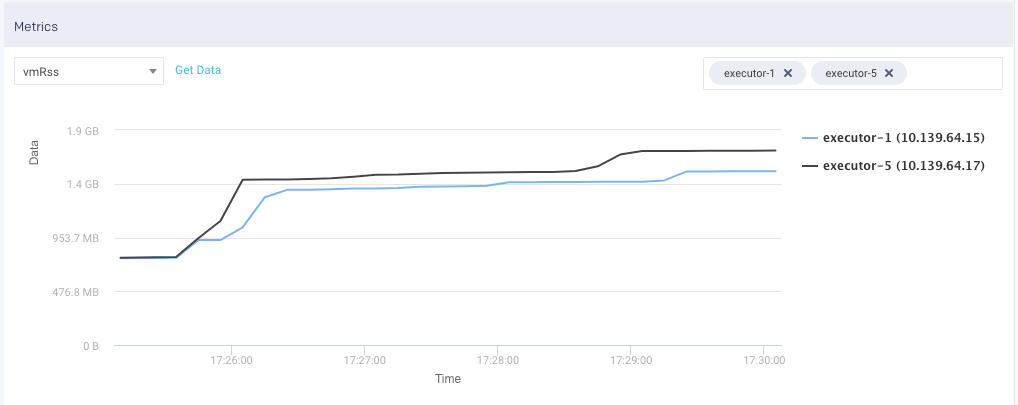
Metrics: The details of the following metrics of the application are plotted in a graph:
OS Memory
CPU Utilization
Java Memory
Click Get Data to get the raw data of the graph.
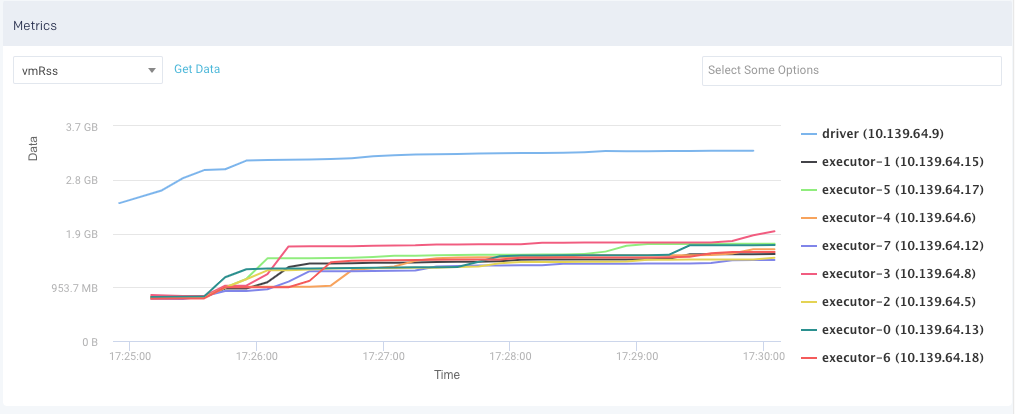
You can further drill down each metric.
Errors: If an error occurs during the job run or when the job run fails or is killed, the corresponding error messages are displayed from this tab.
Configuration: This tab lists all the configurations on a job run. You can select the options to view the configurations from the top of the tab.
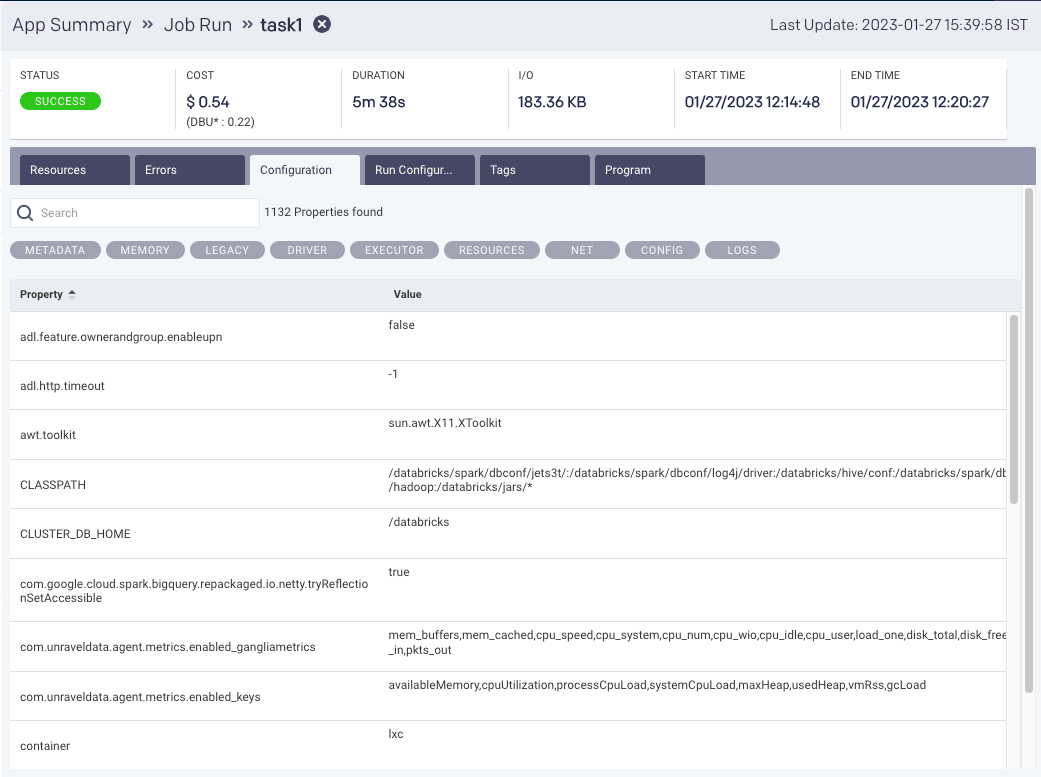
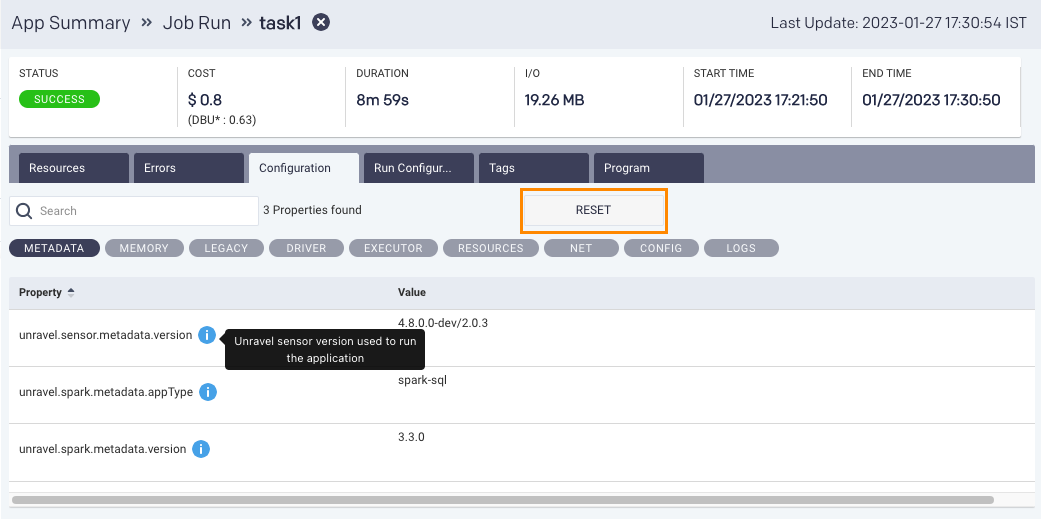
Moreover, you can search for a specific configuration property. Hover over any property to view the corresponding definition of that property. By default, all the properties are shown. After you filter, you can click Reset to return to the default view.
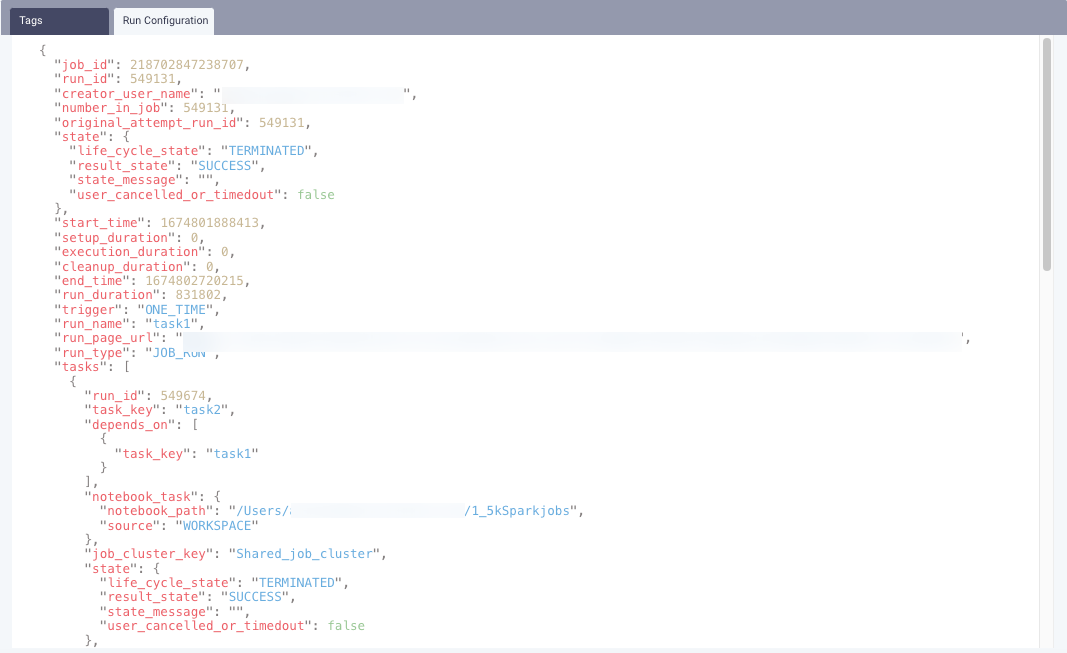
Run Configuration: This tab contains the run information at the job and task levels in JSON format.
Tags: This tab lists all the tags at the job and task levels. Refer to Tagging.
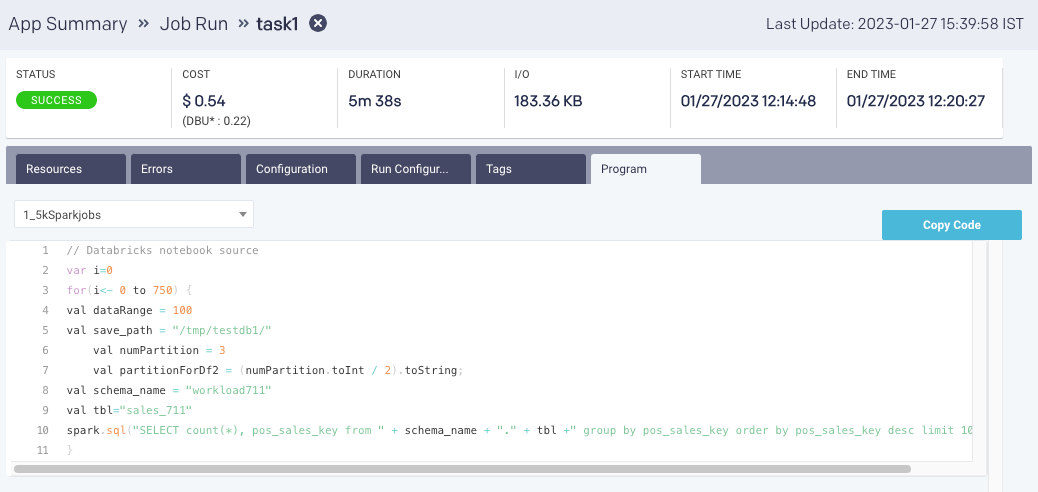
Program: If the source code is submitted through a Databricks job, such as a Notebook source job, Spark-submit job, or Spark SQL job, then the code is displayed on this tab. From the drop-down list, you can select a source code file and view the details. You can also copy the code.