Reports
The Reports section lets you manage the reports. Only the TopX report is supported in Databricks. You can view and generate the reports directly from these tabs.
TopX: Set, run, and view the TopX reports. You can also schedule the report runs.
Archives: All the TopX reports and attempts to generate a report are listed in this section. Also, whether the reports were scheduled or run on an ad hoc basis.
Schedules: Lists all the scheduled reports.
Top X report
This topic provides information about the Top X applications. The Top X reports are enabled by default.
Generating TopX report
Go to Reports, click Archived and then click the
 icon corresponding to Top X.
 Or
Go to Reports, click TopX tab and then click
 .
. The New Report dialog box is displayed.
Enter the following parameters:
History (Date Range): Use the date picker drop-down to specify the date range.
Top X: Enter a number for the top Hive, Spark, and Impala apps you want to view.
Cluster: Select a cluster from where you want to generate the report.
Users: Users who submitted the app.
Workspaces: Select workspaces which must be included in the report.
Real User: The real users who submitted the app. For instance, the user might be a hive, but the real user is joan@mycompany.com.
Tags: Select tags.
Click
to generate the report.The progress of the report generation is shown at the top of the page, and you are notified about the successful creation of the report. The latest successful report is shown on the Clusters > Top X page.
All reports (successful or failed attempts) are in the Reports Archive.
Scheduling TopX report
Click Reports > Archived. Click the
 icon corresponding to Top X.
 In the Schedule Report dialog box, provide the following details:
History (Date Range): Use the date picker drop-down to specify the date range.
Top X: Enter a number for the top Hive, Spark, and Impala apps you want to view.
Cluster: Select a cluster from where you want to generate the report.
Users: Users who submitted the app.
Real User: Users who submitted the app. For instance, the user might be a hive, but the real user is joan@mycompany.com.
Workspaces: Select workspaces which must be included in the report.
Tags: Select tags.
Schedule to Run: Select any of the following schedule options from the drop-down and set the time from the hours and minutes drop-down:
Daily
Select a day in the week. (Sun, Mon, Tue, Wed, Thu, Fri, Sat)
Every two weeks
Every month
Notification: Provide email ID of the recipients who must receive the notification of the generated reports.
Click
 .
.
Viewing TopX report
In the Reports > Archived, click the  icon corresponding to Top X. The TopX report is displayed with the following sections:
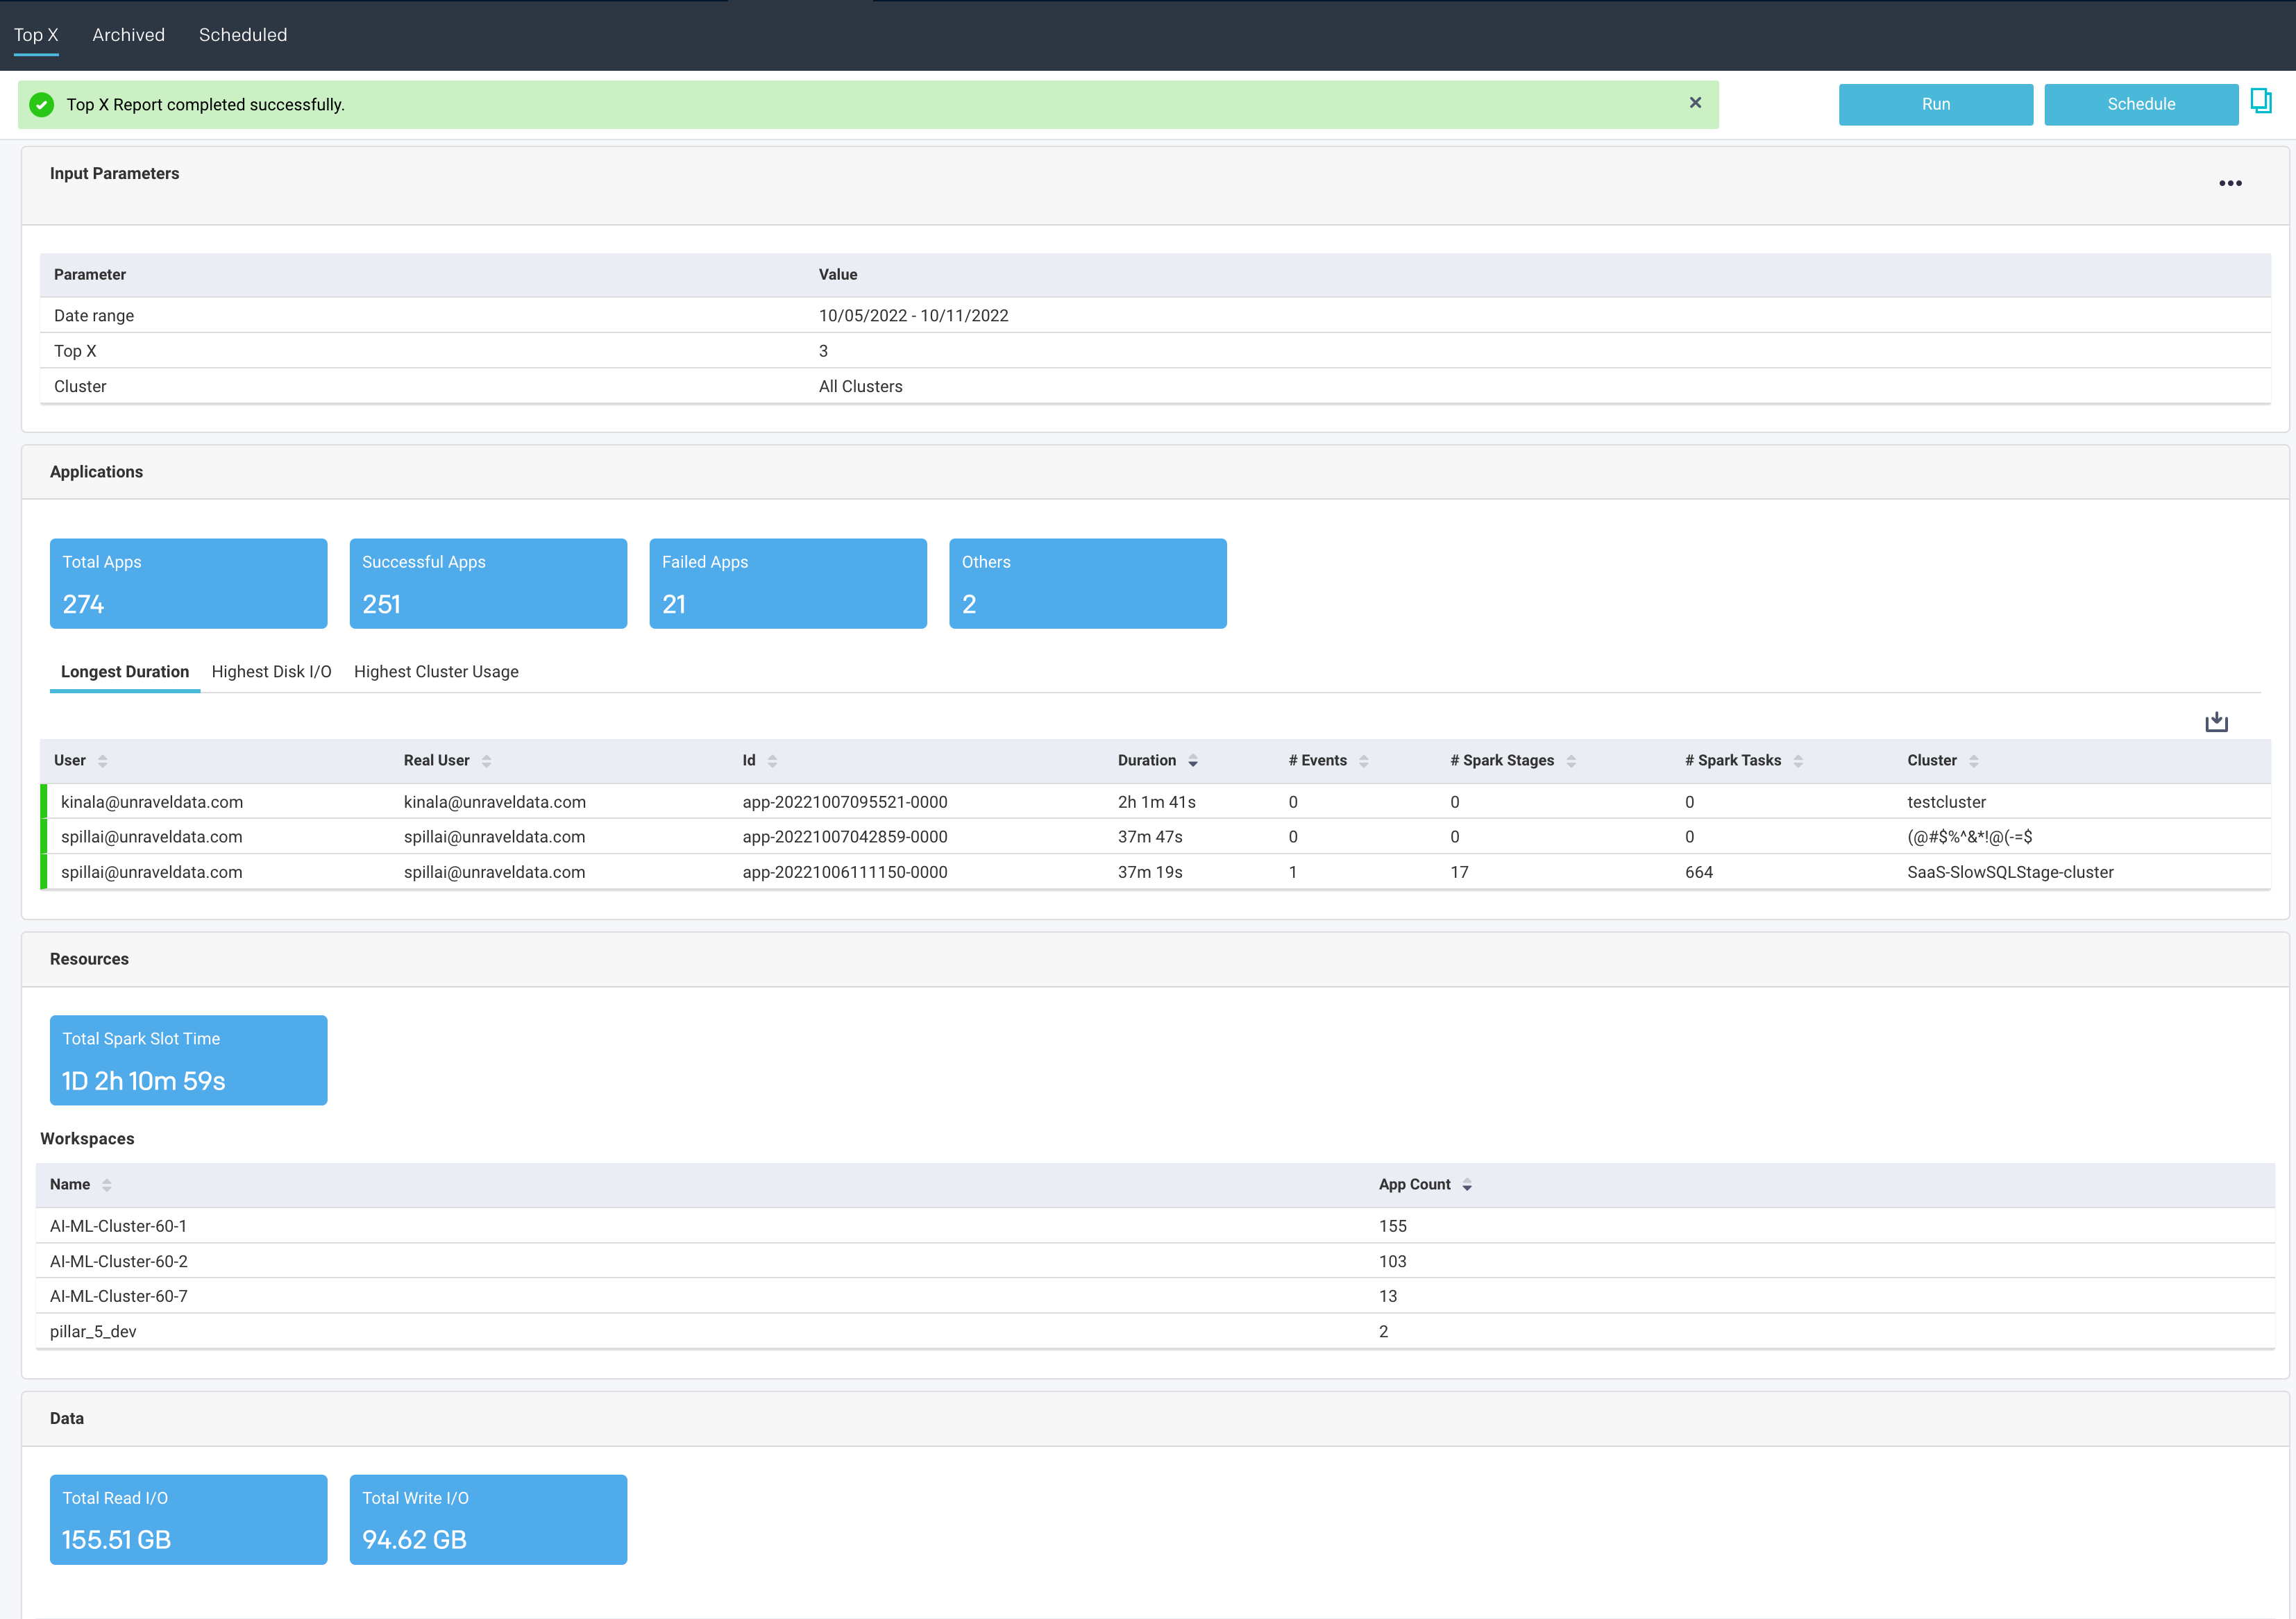
Input Parameters
This section provides the basic information about the report, that is, the date range selected, the number of top results included in the TopX report, and the cluster from where the report is generated.
Applications
The Applications section shows the following app metrics for the generated TopX report:
Total Apps: Number of apps on the cluster.
Successful Apps: Number of apps that are completed successfully.
Failed Apps: Number of apps that have failed to complete.
Others: Number of apps killed or those in a pending, running, waiting, or unknown state.
Further, the detailed TopX report for applications is generated, which are grouped based on the following categories:
Longest Duration: The Top N number of applications ran for the longest duration.
Highest Disk I/O: The Top N number of applications with the highest disk input/output operations.
Highest Cluster Usage: The Top N number of applications with the highest cluster usage.
Click any of the tabs to view further TopX details of the selected app.
Resources
Resources breakdown the Map/reduce time for Hive apps. The information about total mappers, successful mappers, total reducers, and successful reducers is shown.
Workspaces
The Workspaces section shows the app count for the selected workspaces plus the other criteria which were selected for generating the report.
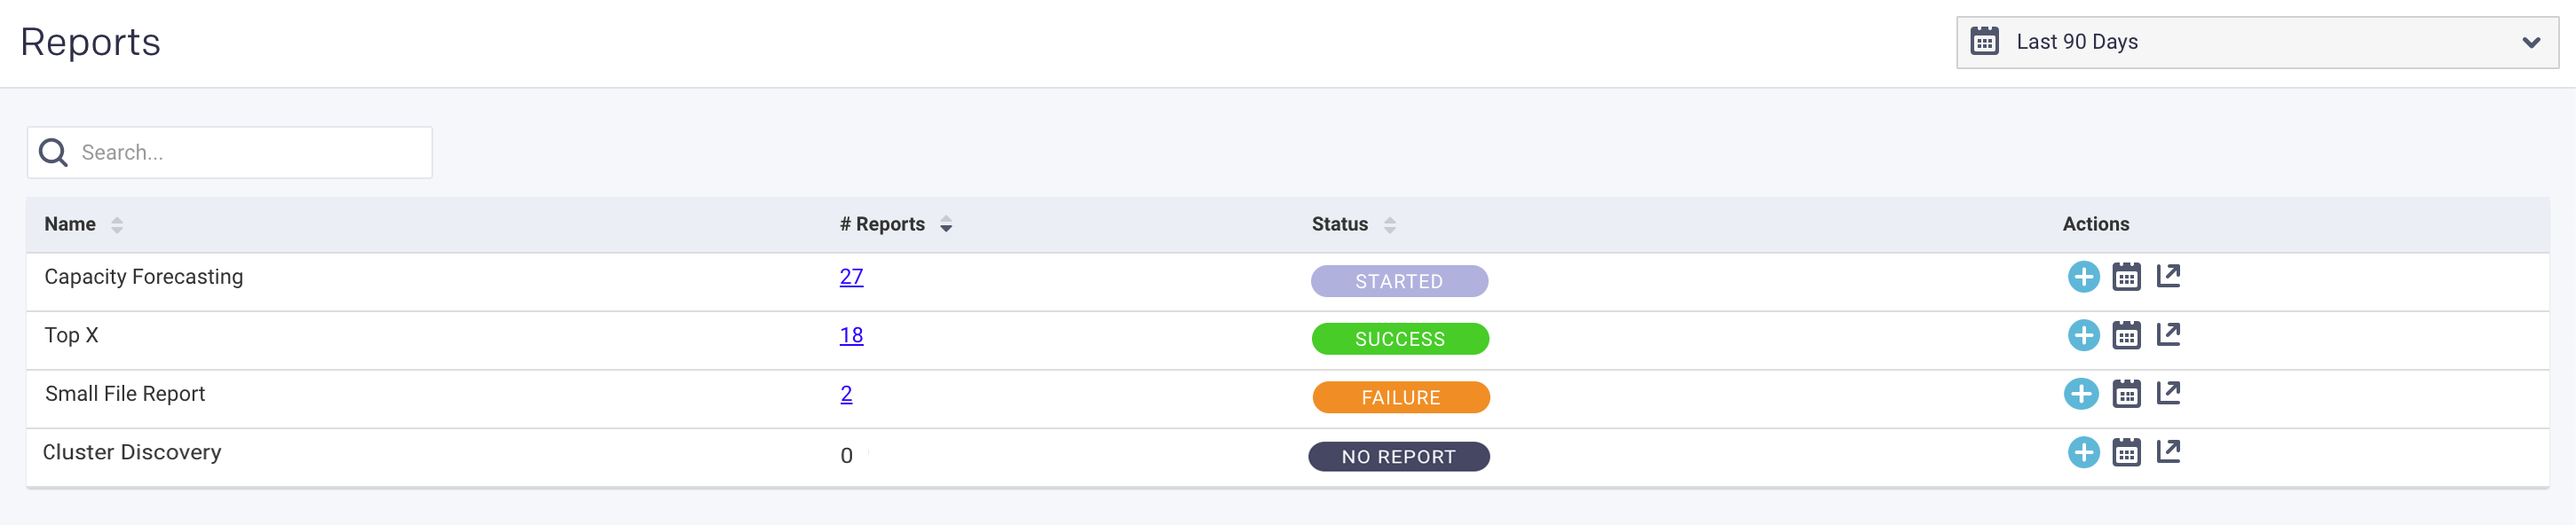
Archives
The archives list all the available reports by report type Name. You can search by report type, for example, File Reports. It is initially sorted in descending order on the # Reports. The Status column notes the status of the last or current support. The image below shows the status of Started for the latest Capacity Forecasting; this could be a scheduled or ad hoc report. Under Actions click to create a report, schedule a report, and view the latest report.
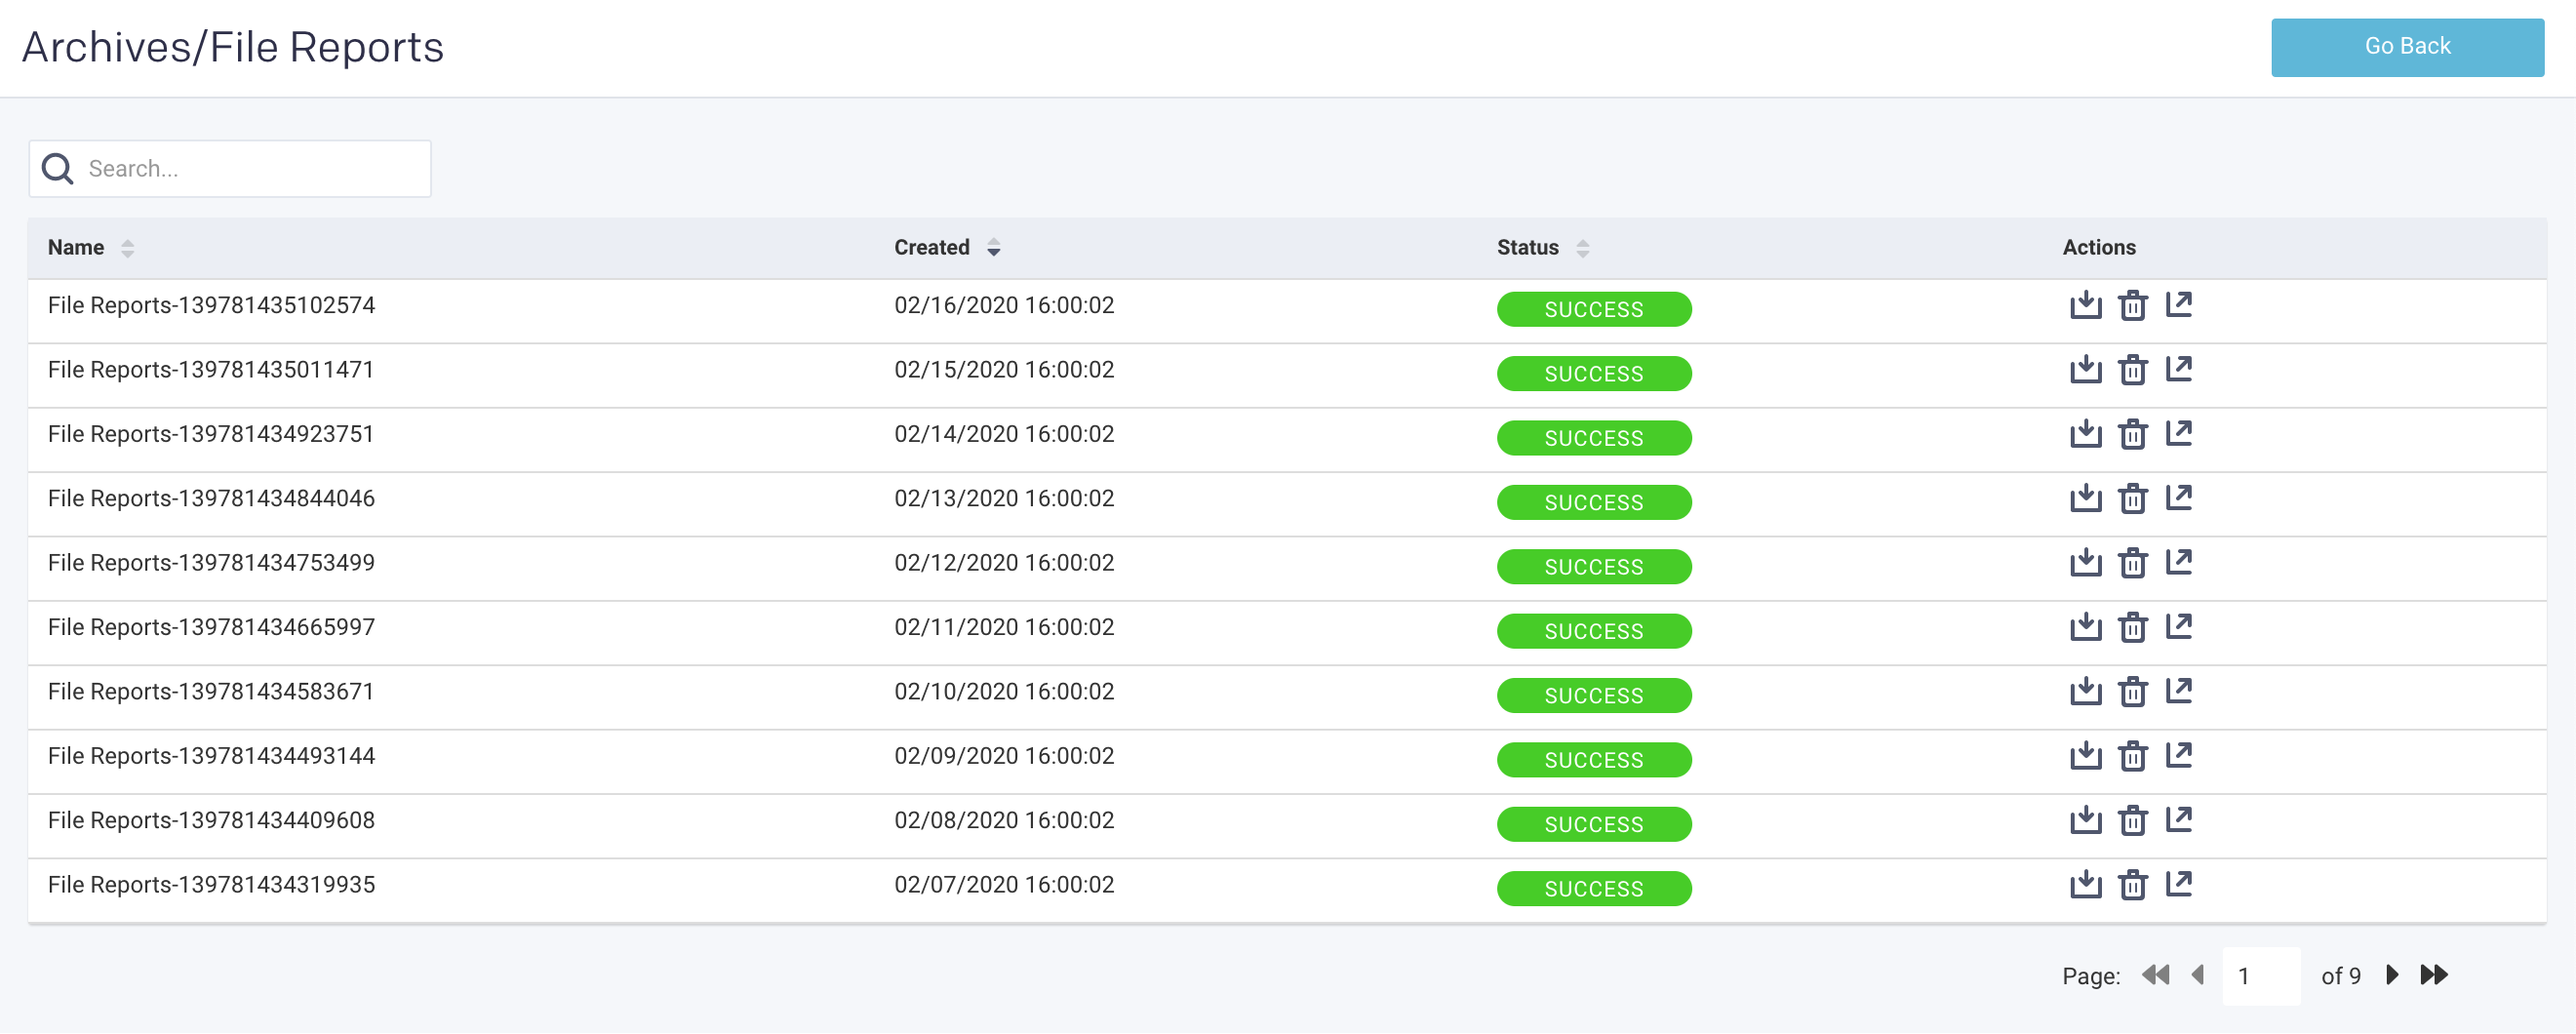
To see the list of archive reports, click the number in the # Reports column. The report type is listed in the title bar; the example below is for File Reports. You can search by report name. For each report, the Create time and Status are listed. Click  to download the report, click
  to delete the report, and view the latest report. Click Go Back to return to the main archive page.
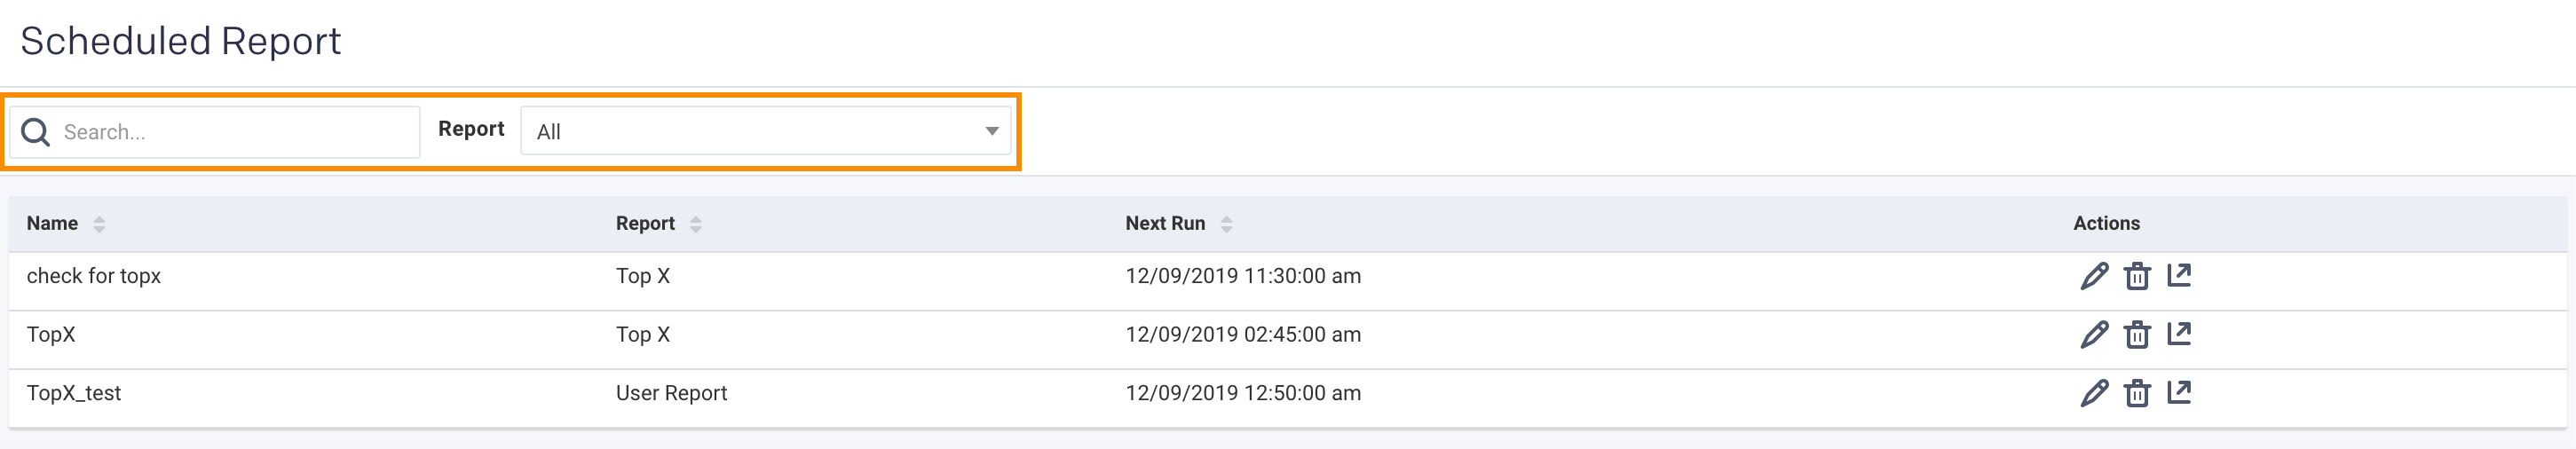
Schedules
Lists all the reports currently scheduled. The window is initially sorted on Name. The Report column lists the type of report, and Next Run is the date and time of the next report's scheduled run. You can't create a new report in this window, but you can edit the existing report by clicking  under Actions. See the specific report type page for an explanation of the edit modal. Click to delete the report and view it.
You can filter the report by report name (or substring) or type.