Job Trends
The Job Trends application offers insights into the performance and cost metrics of jobs, segmented into two key periods: Before Changepoint and After Changepoint.
Understand Trends
The app provides a clear breakdown of key metrics before and after a changepoint. The app provides an breakdown of metrics such as Total Job Runs, Average Cost, and Resource Usage before and after a significant changepoint. This segmentation allows you to compare job execution patterns and evaluate the effects of operational changes.
Gain Actionable Insights
Metrics like Average IO (GB), Average Cost/GB, and Average Savings ($) allow you to dive into the details of job efficiency and cost-effectiveness. The visual comparison of Cost Over Time across the two periods helps identify trends, anomalies, and potential areas for improvement.
Optimize for Efficiency
Using insights from metrics such as Average Duration (min) and Average Duration/GB, you can identify inefficiencies, measure performance improvements, and implement optimizations.
Installing and Launching the Job Trends app
Refer to Installing and accessing the apps.
Using the Job Trends app
On the Unravel UI, from the upper-right corner, click
 . The App Store page is displayed.
Click the Job Trends image to open the app.
Enter a Job ID.
Select a date for the change point.
Click Submit. The Job Trends dashboard is displayed with analysis of the Job ID before and after the change point.
The dashboard is divided into two sections: Before Changepoint and After Changepoint. The following metrics are displayed.
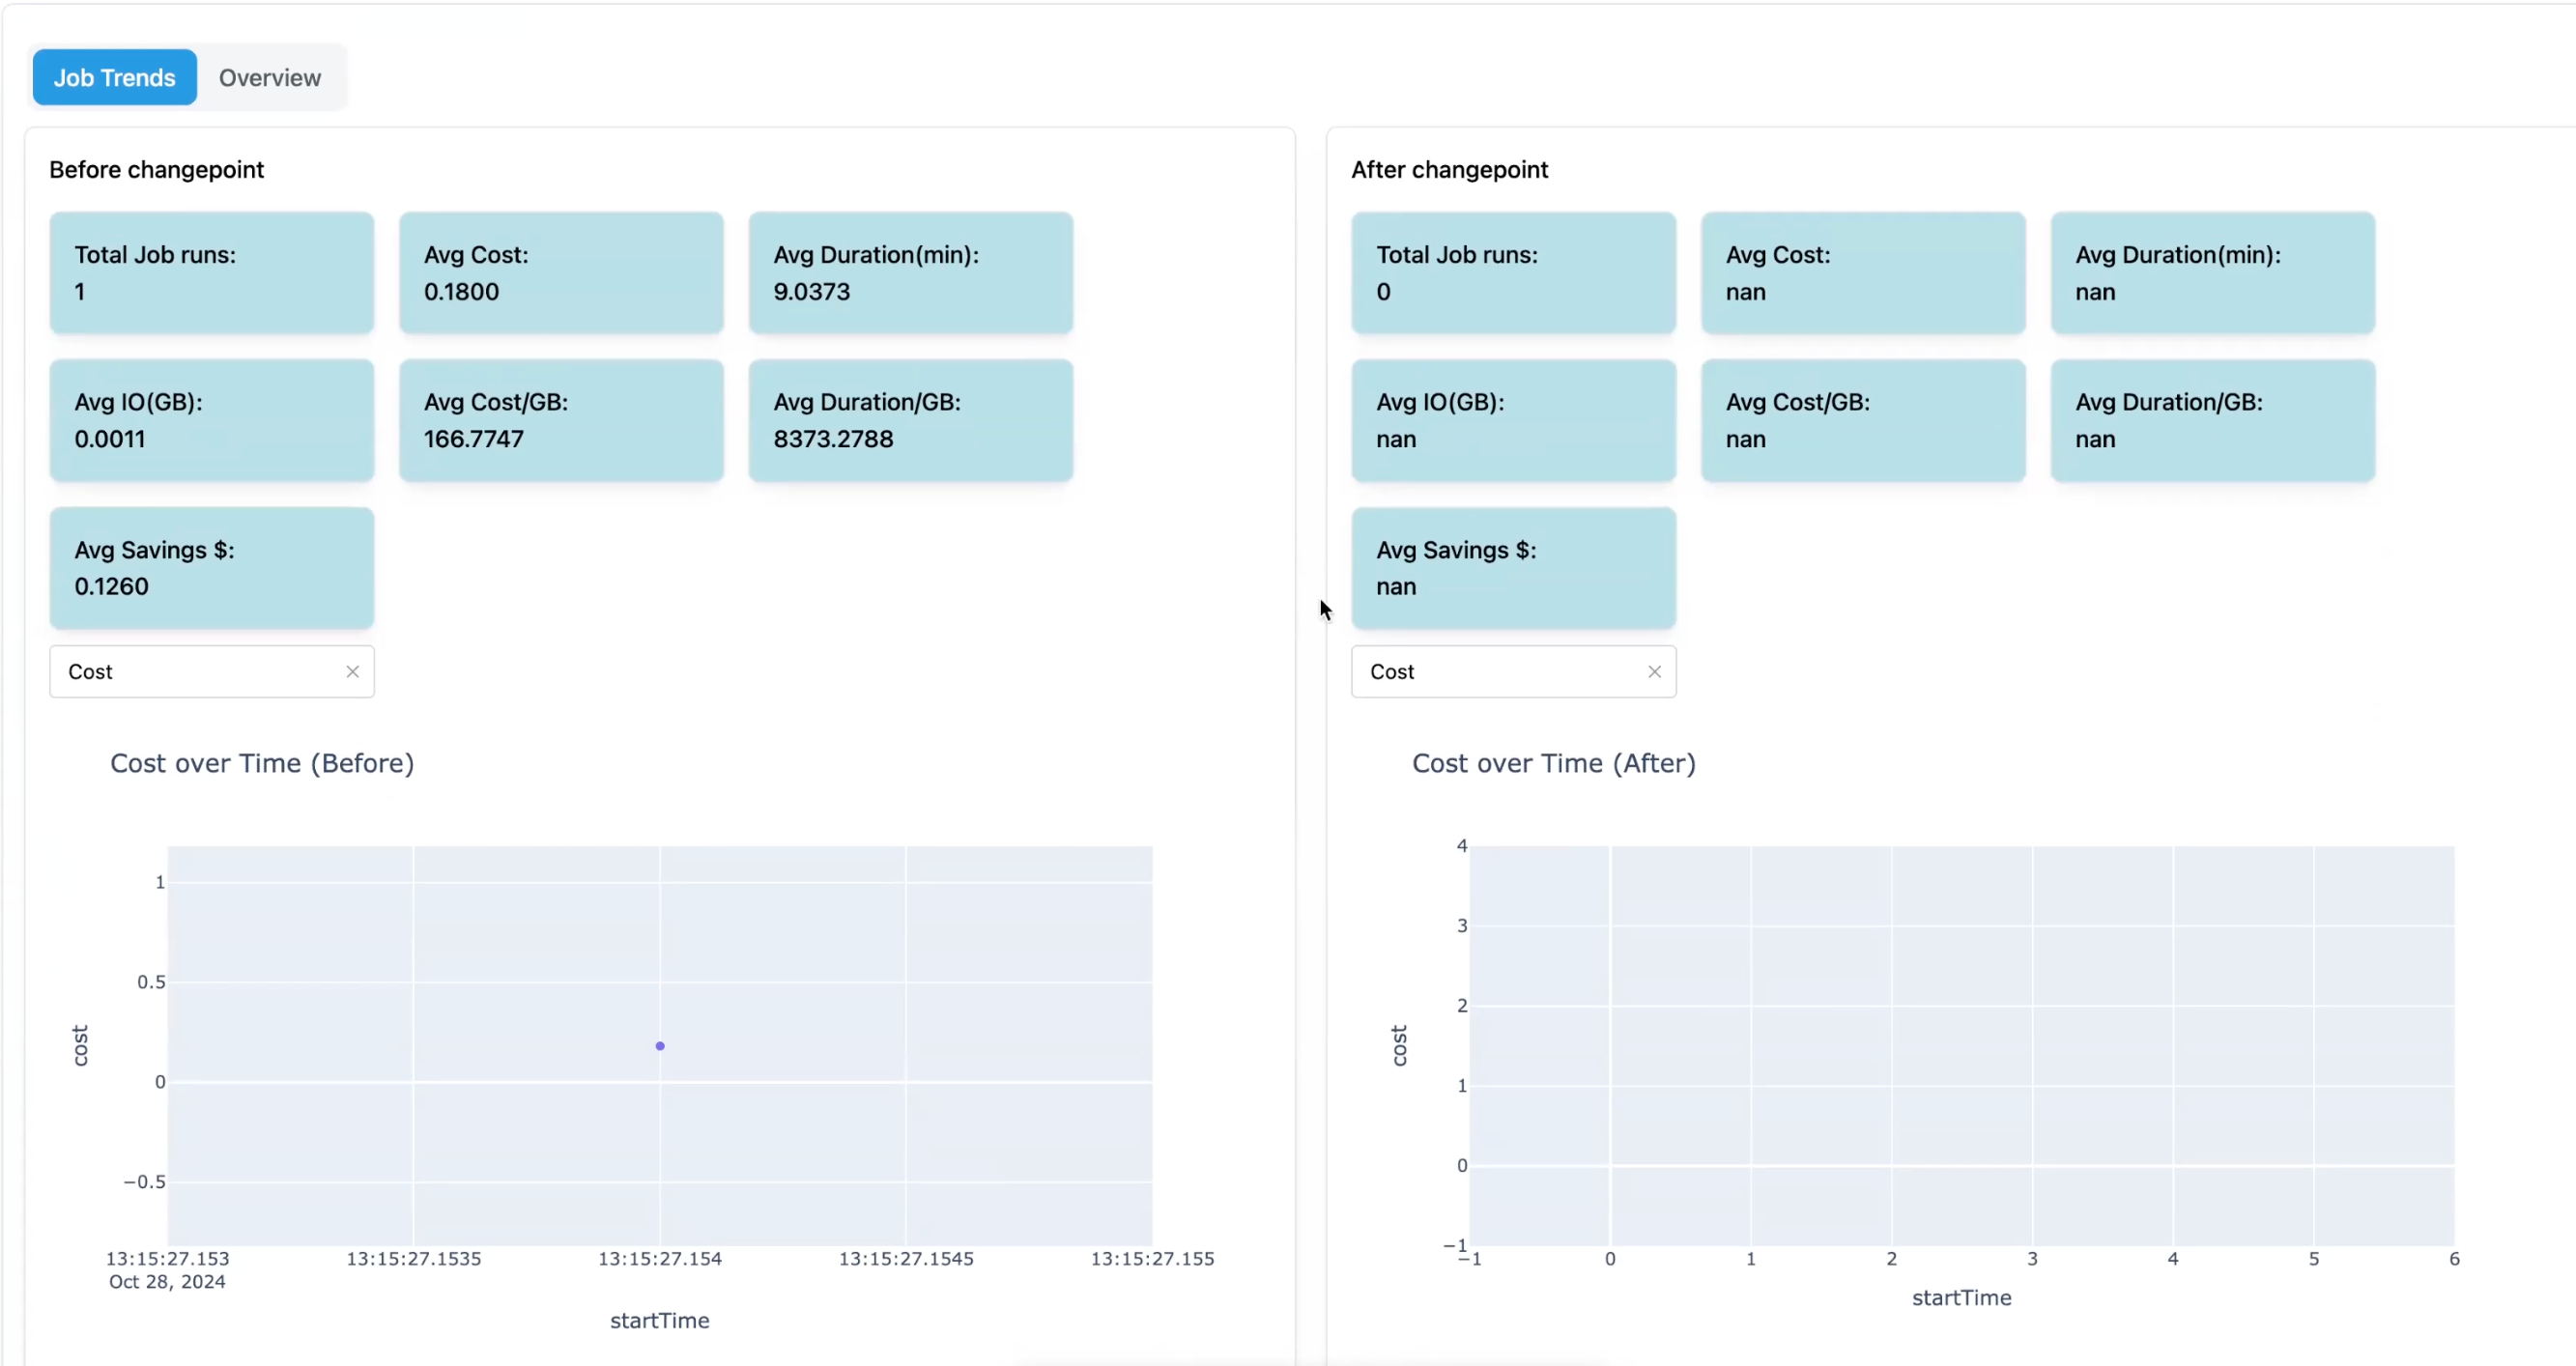
Total Job Runs: Total number of jobs executed.
Average Cost: he average monetary cost per job in the selected time range. This helps identify whether job costs are consistent or fluctuating over time.
Average Duration (min): The average time (in minutes) taken by jobs to complete. This metric provides insights into the overall efficiency of job execution and helps detect performance issues.
Average IO (GB): The average Input/Output (I/O) data in gigabytes processed by jobs. It represents the typical data load handled by jobs and helps assess the scale of operations.
Average Cost/GB: The average cost incurred per gigabyte of data processed. This metric highlights the cost efficiency of handling data and helps in identifying high-cost operations.
Average Duration/GB: The average time (in minutes) taken to process each gigabyte of data. It indicates the efficiency of data processing and can reveal bottlenecks in job performance.
Average Savings $: The average monetary savings achieved per job. This metric helps track the impact of optimizations or cost-saving strategies over time.
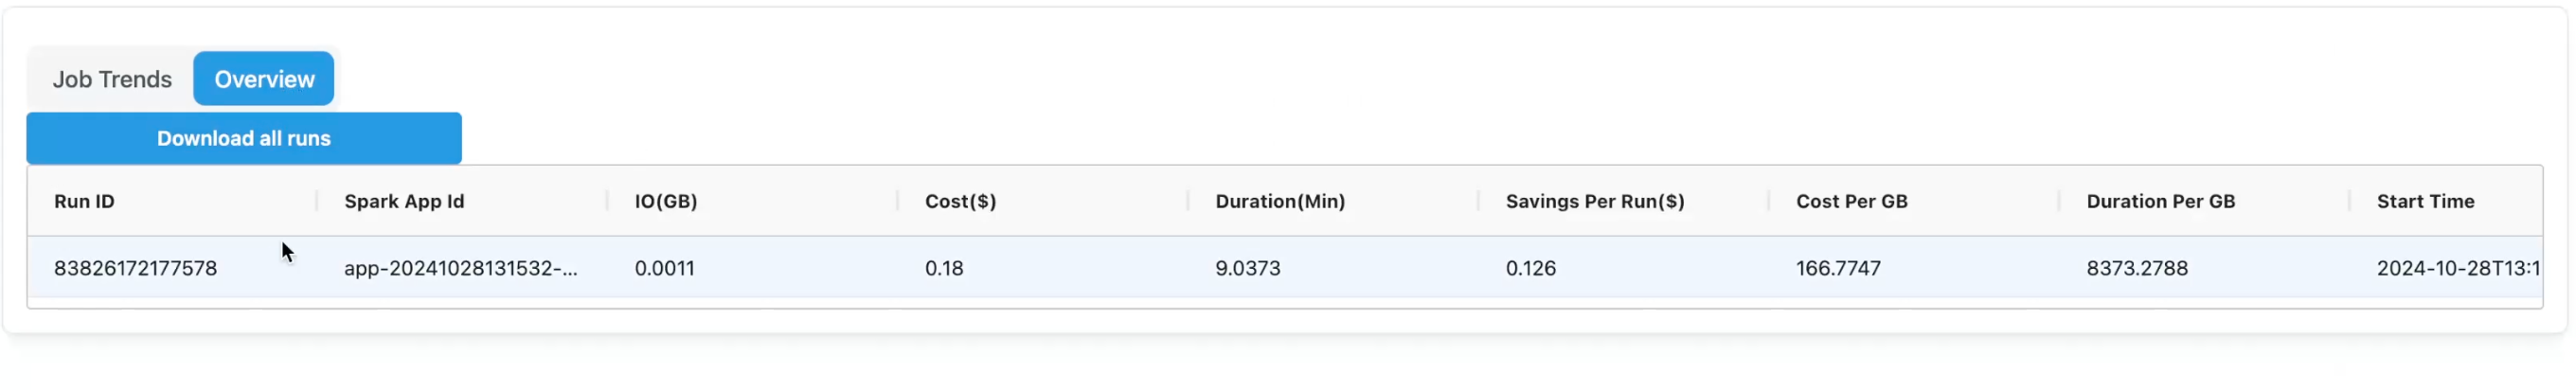
Click Overview to view the same data in the form of a table.