Cluster Insights Correlator app
The Cluster Insights Correlator app provides data insights on concurrently heavy hitter apps, name node inefficiencies, HiveServer2 (HS2) statuses, and Impala service level inefficiency. The metrics for the report are fetched from the Cloudera manager. However, to receive the metrics for HiveServer2 statuses, you must set the prerequisite of Cluster Insights configuration update.
Installing and opening Cluster Insights Correlator app
Refer to Installing Cluster Insights Correlator app.
Refer to Opening Cluster Insights Correlator app.
Prerequisite (Cluster Insights configuration update)
To receive the metrics for HiveServer2, you must set the Cluster Insights Config update as follows:
Navigate to the configuration file for Cluster Insights located at
/opt/unravel/versions/{version}/cluster-insights/cluster-insights/config.py, where{version}is the current Unravel version number.Open the
config.pyfile in your preferred text editor.Locate the service_role_metrics section of the file. This section contains a JSON object that specifies the metrics that Cluster Insights should collect.
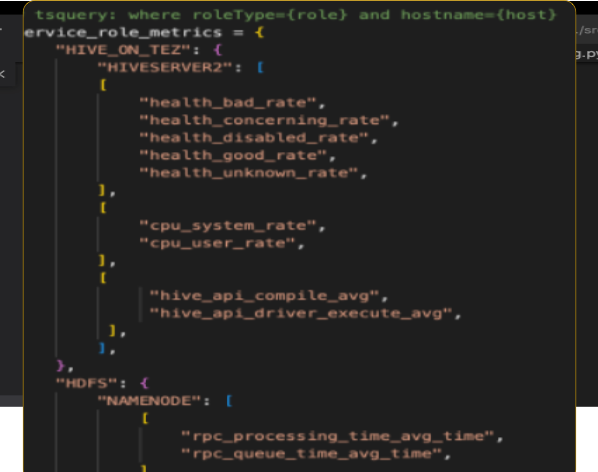
Add the following lines given to the service_role_metrics section:
service_role_metrics = {
   "HIVE_ON_TEZ": {
       "HIVESERVER2": [
       [
           "health_bad_rate",
           "health_concerning_rate",
           "health_disabled_rate",
           "health_good_rate",
           "health_unknown_rate",
       ],
       [
           "cpu_system_rate",
           "cpu_user_rate",
       ],
       [
            "hive_api_compile_avg",
            "hive_api_driver_execute_avg",
        ],
       ],
   },}
For example:
Save the changes to the config.py file.
Restart the Cluster Insights service by running the following command from the Unravel manager path:
./manager restart clusterinsights
After the Cluster Insights service is restarted, the HiveServer2 metrics collection begins.
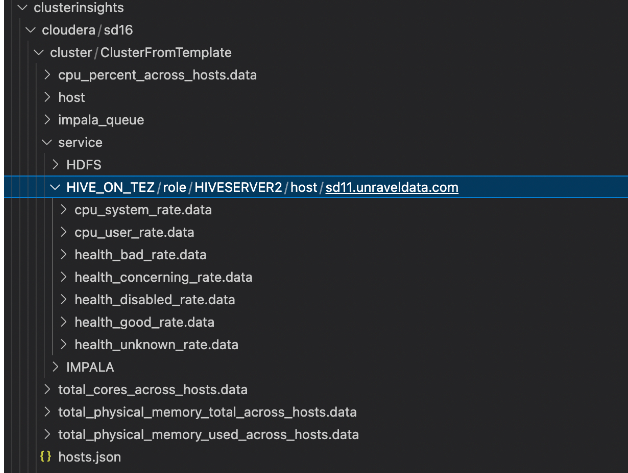
Verify if the metrics data is fetched in the following path:
/opt/unravel/data/clusterinsights/{provider}/{cluster}/ClusterFromTemplate/service/HIVE_ON_TEZ/role/HIVESERVER2host/{cluster}/For reference:
After verification, you can run the Cluster Insights Correlation app in the appstore to view the metrics data.
Generating the Cluster Insight Correlator report
On the Unravel UI, from the upper-right corner, click
 . The App Store page is displayed.
 Click the Cluster Insights Correlator image to open the app and then do the following:
Select a time range; the start date and the end date.
Select the start time and the end time and click Submit.
The following sections are updated with the metrics incurred during the selected duration:
Click the section links to view the details.
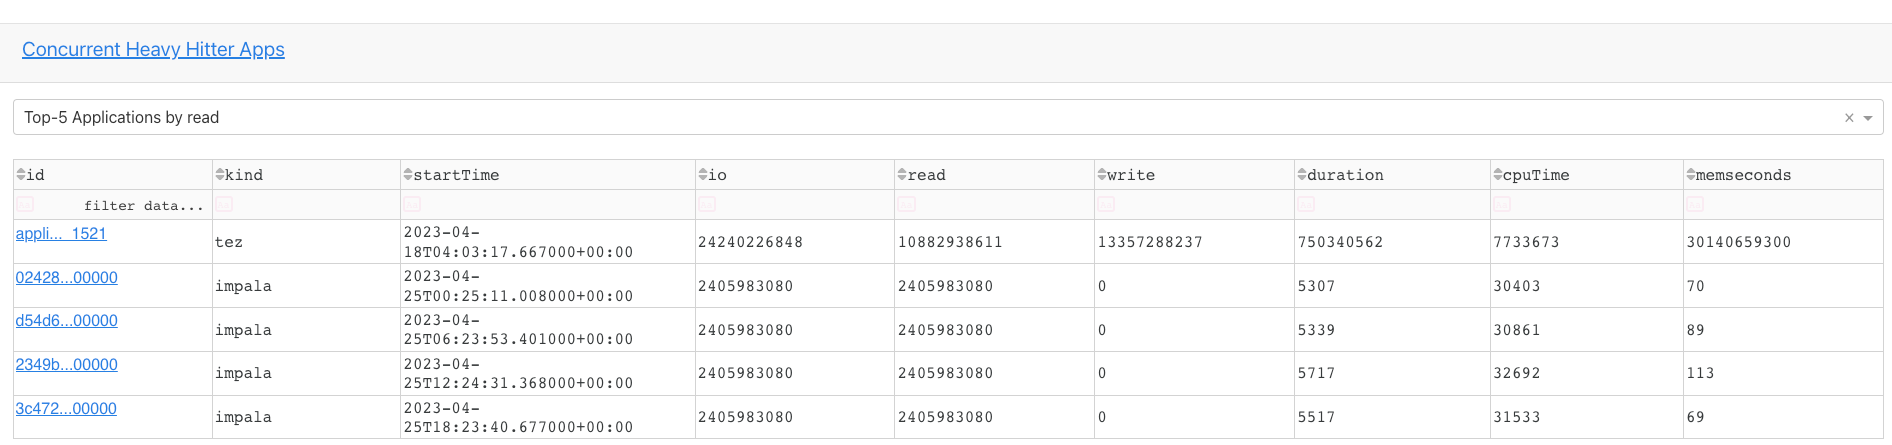
Concurrent heavy hitter apps
You can view the top five applications in the following categories. The details of each of these categories are listed in a table. You can click the ID link of the application to go to the corresponding application summary page in Unravel.
IO
Read/Write
Duration
CPU time
Memory
NameNode Inefficiency
The name node inefficiencies are listed with insights for improvements. Click More Details button to view the complete details of the insights.
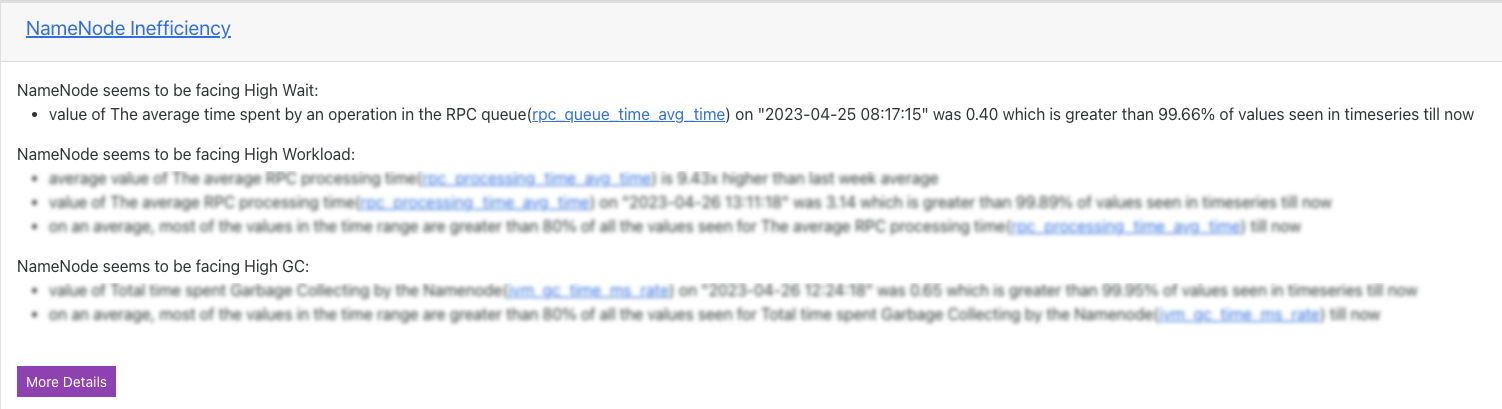
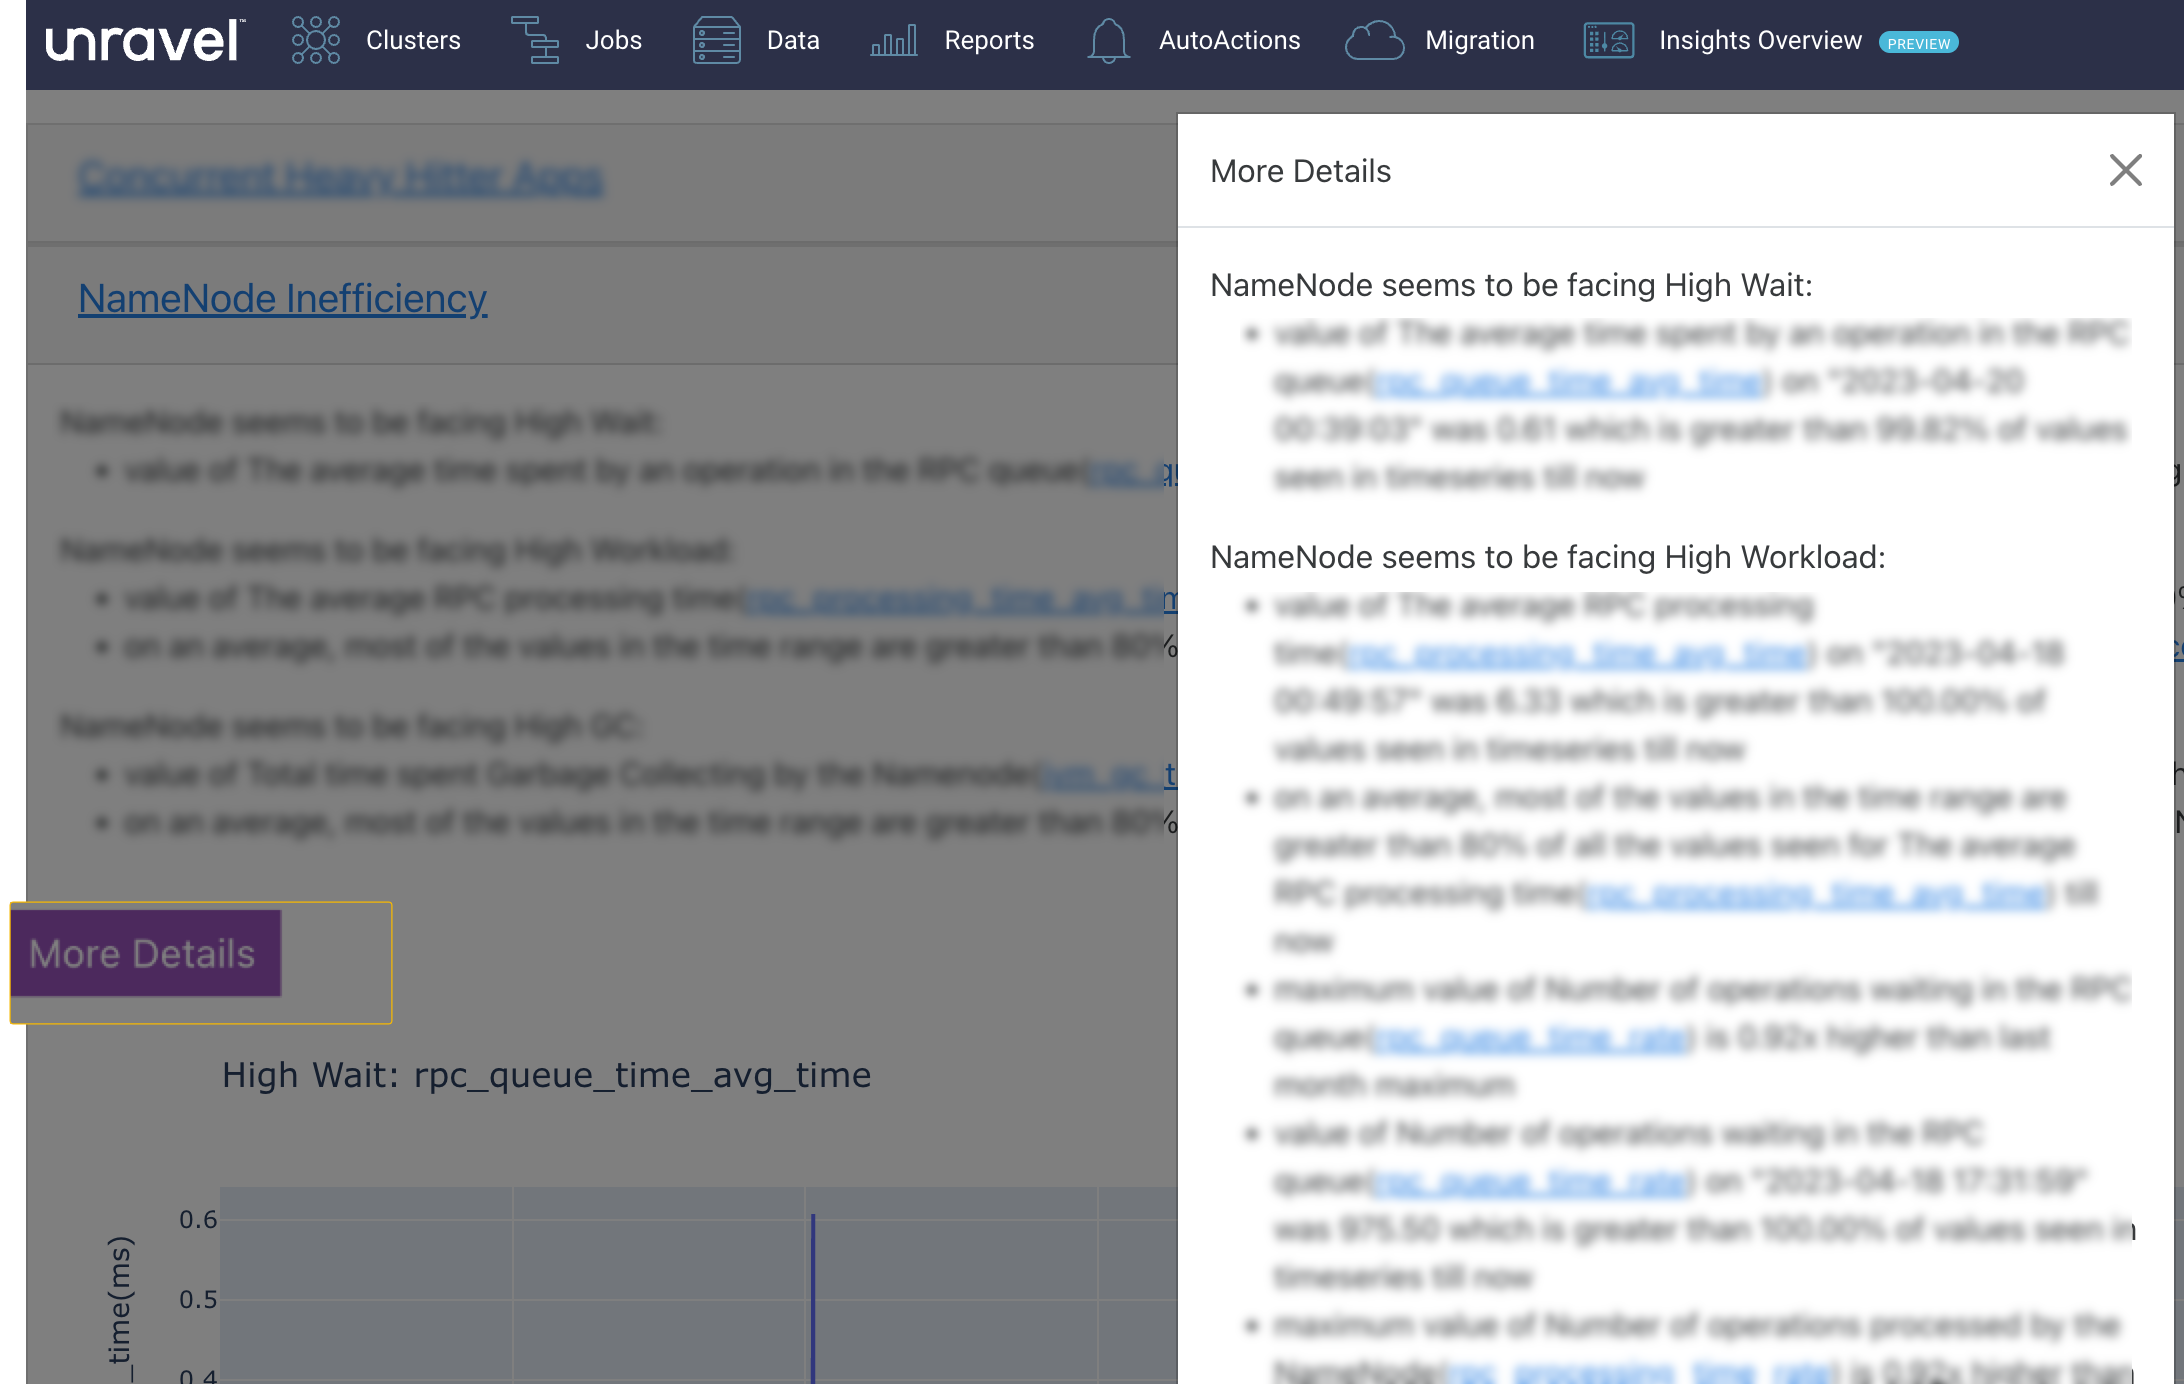
Moreover, the metrics for each of these inefficiencies are plotted in the graph for the selected duration.The current reading of the metrics is plotted and can be compared against the monthly, daily, and weekly average readings of the metrics.
In the following example, a High Wait inefficiency is detected for the name node in the specified time range. The insight points to the time range where it consumed high or low resources for the average time spent by an operation in the RPC queue (rpc_queue_time_avg_time) metric. The value of this metric is plotted on the graph against the specified time range.
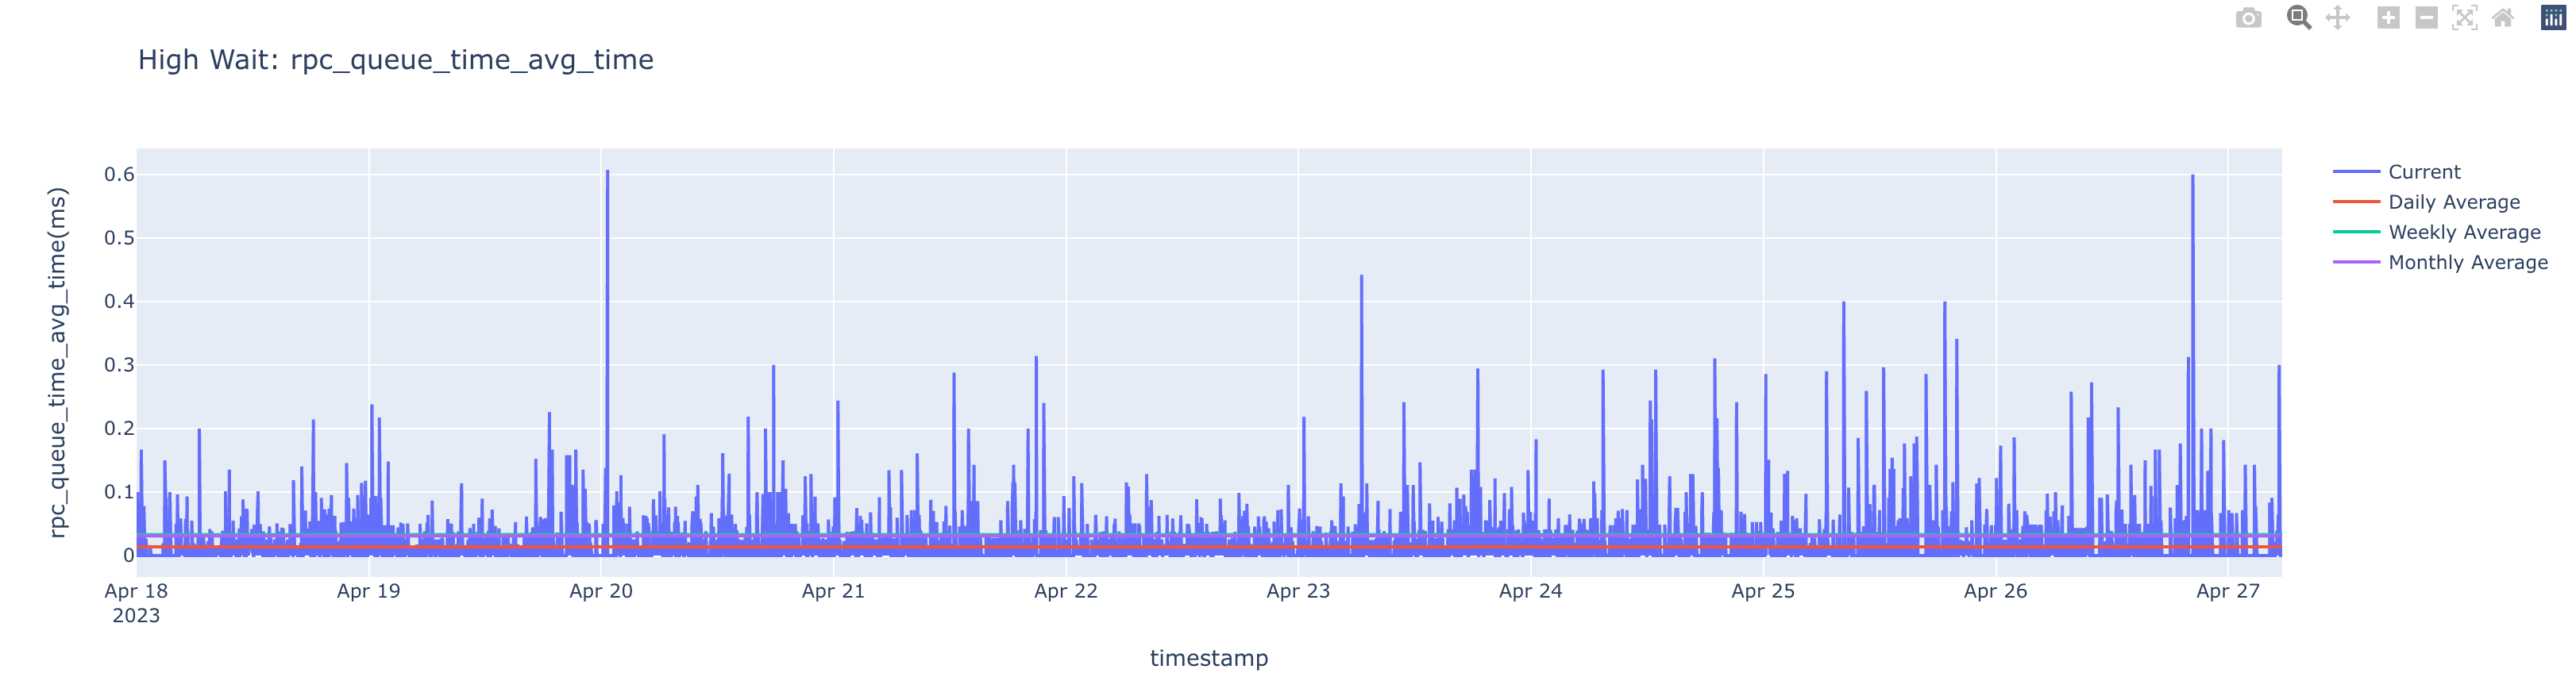
You can select one of the options on the right of the graph ( ) to toggle between, current, monthly average, daily average, and weekly average.
HiveServer2 Status
The HiveServer2 statuses are listed with insights. Click More Details button to view the complete details of the insights.
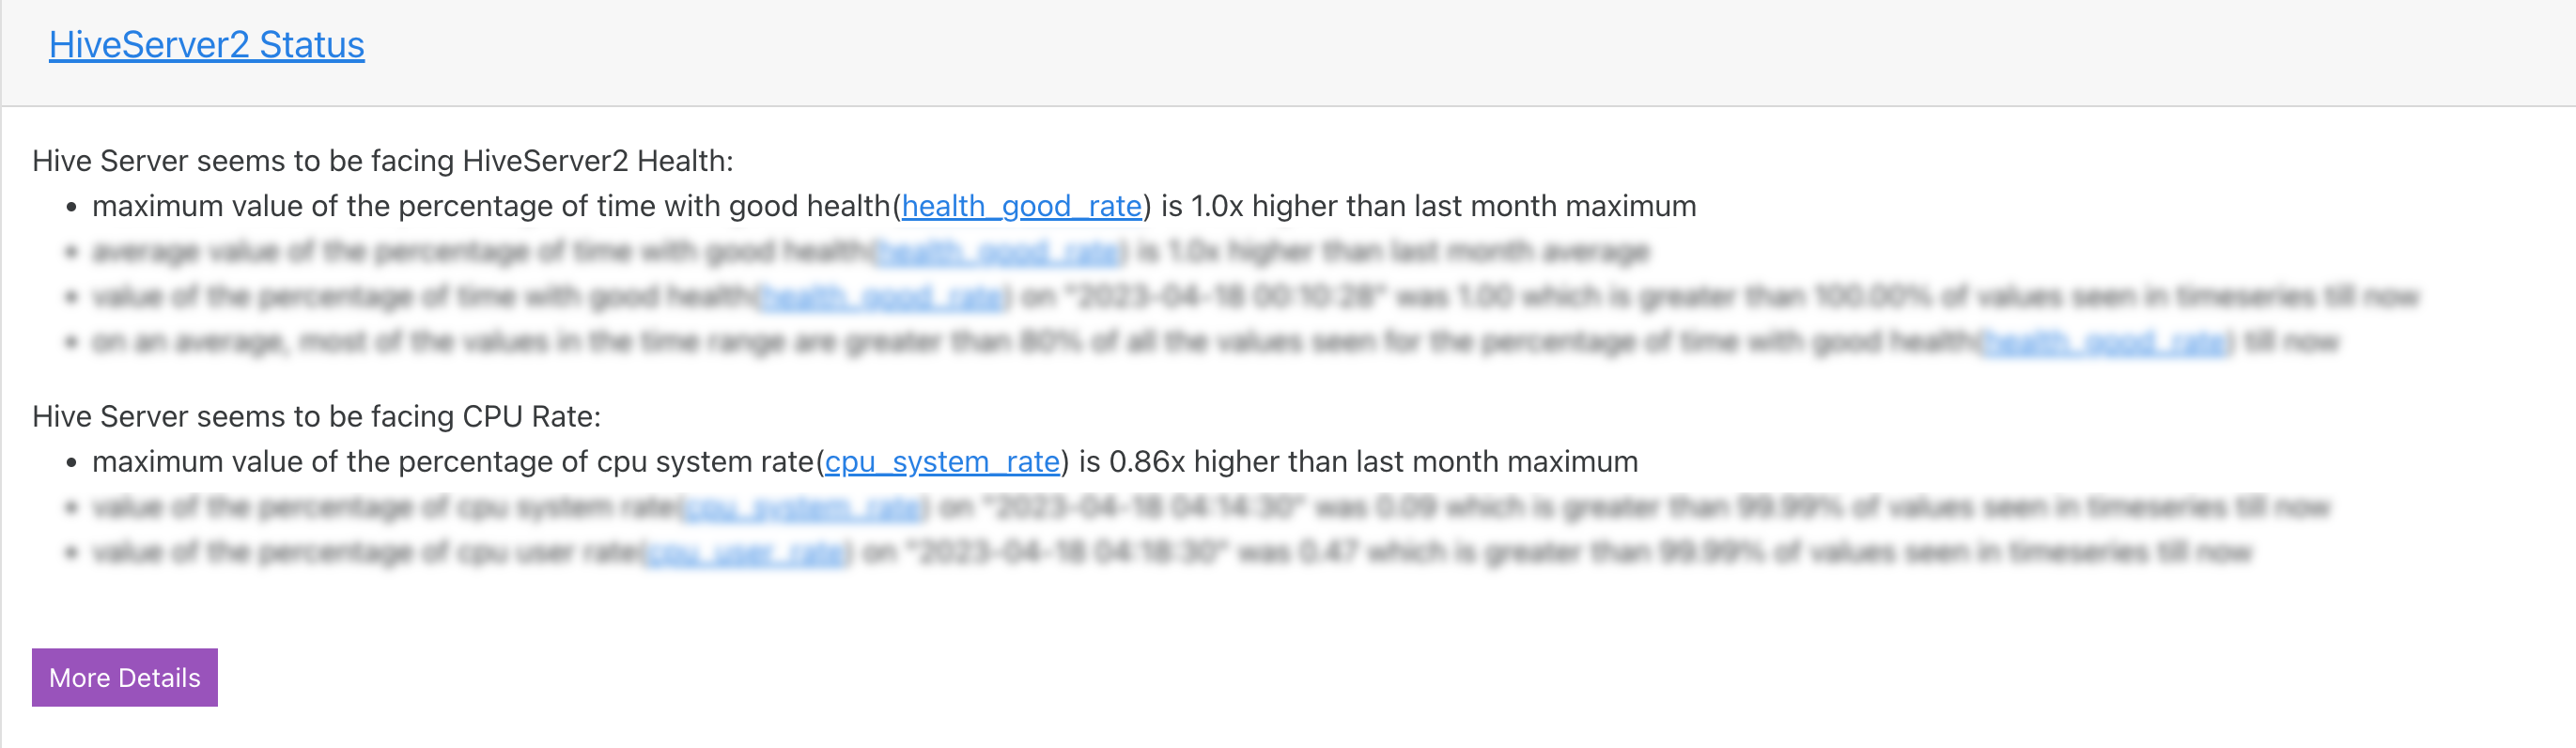
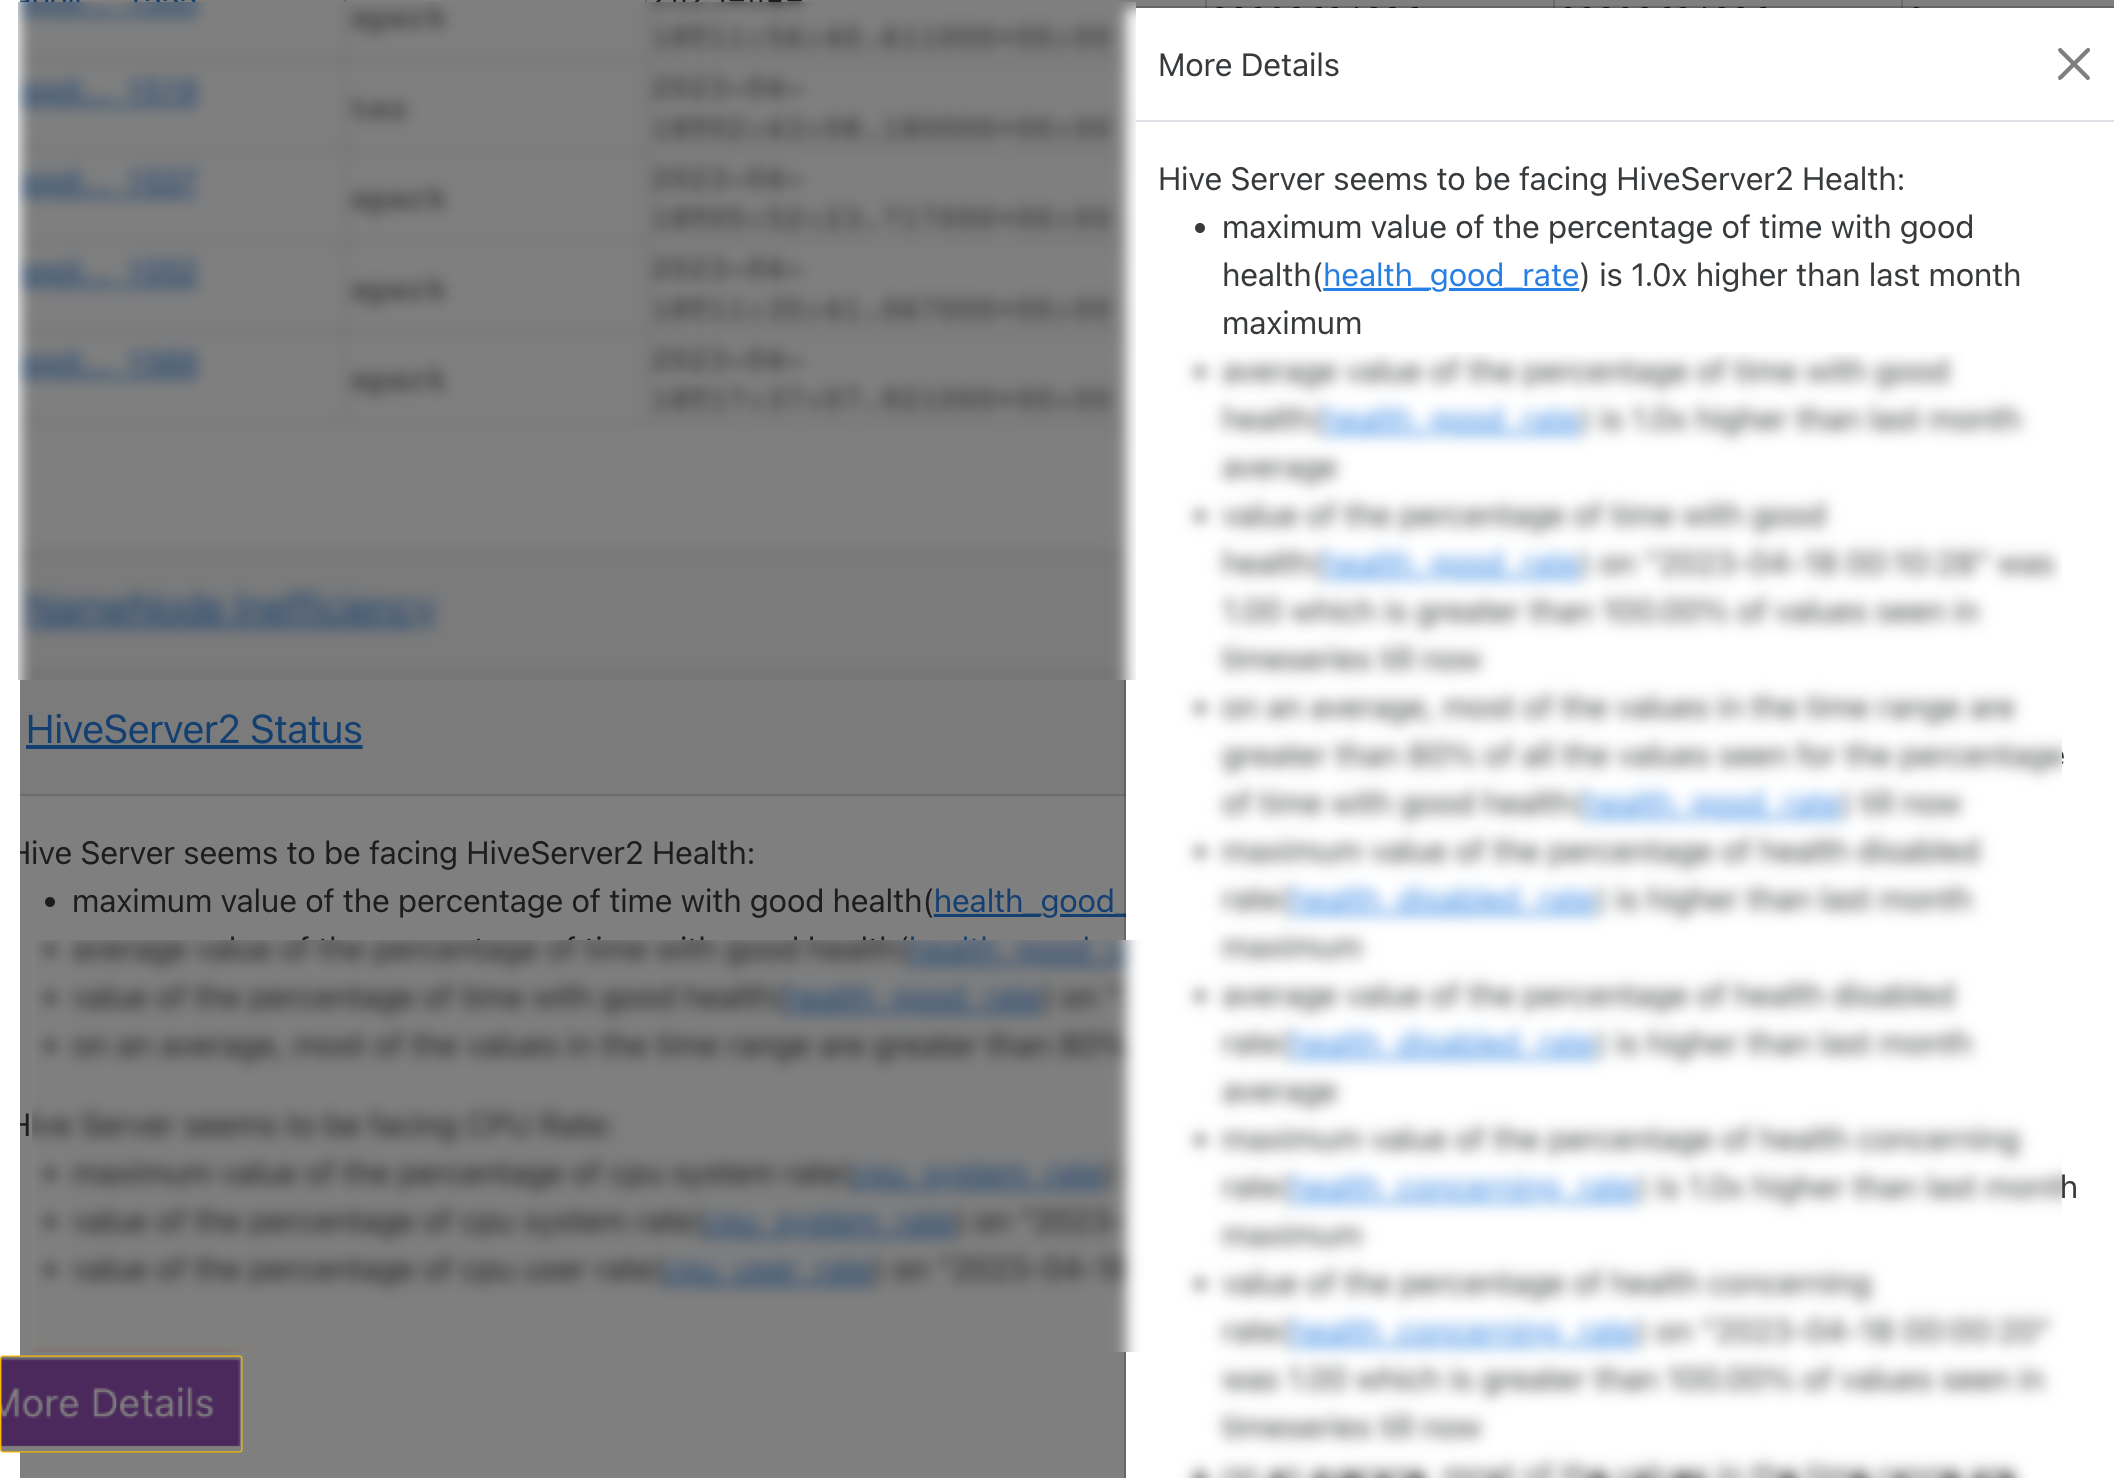
Moreover, the metrics for each of these inefficiencies are plotted in the graph for the selected duration. The current reading of the metrics is plotted and can be compared against the monthly, daily, and weekly average readings of the metrics.
In the following example, the CPU user rate metric is plotted in the graph for the specified time range. The insight points to the time range where it consumed high or low resources for the cpu user rate (cpu_user_rate) metric. The value of this metric is plotted on the graph against the specified time range.
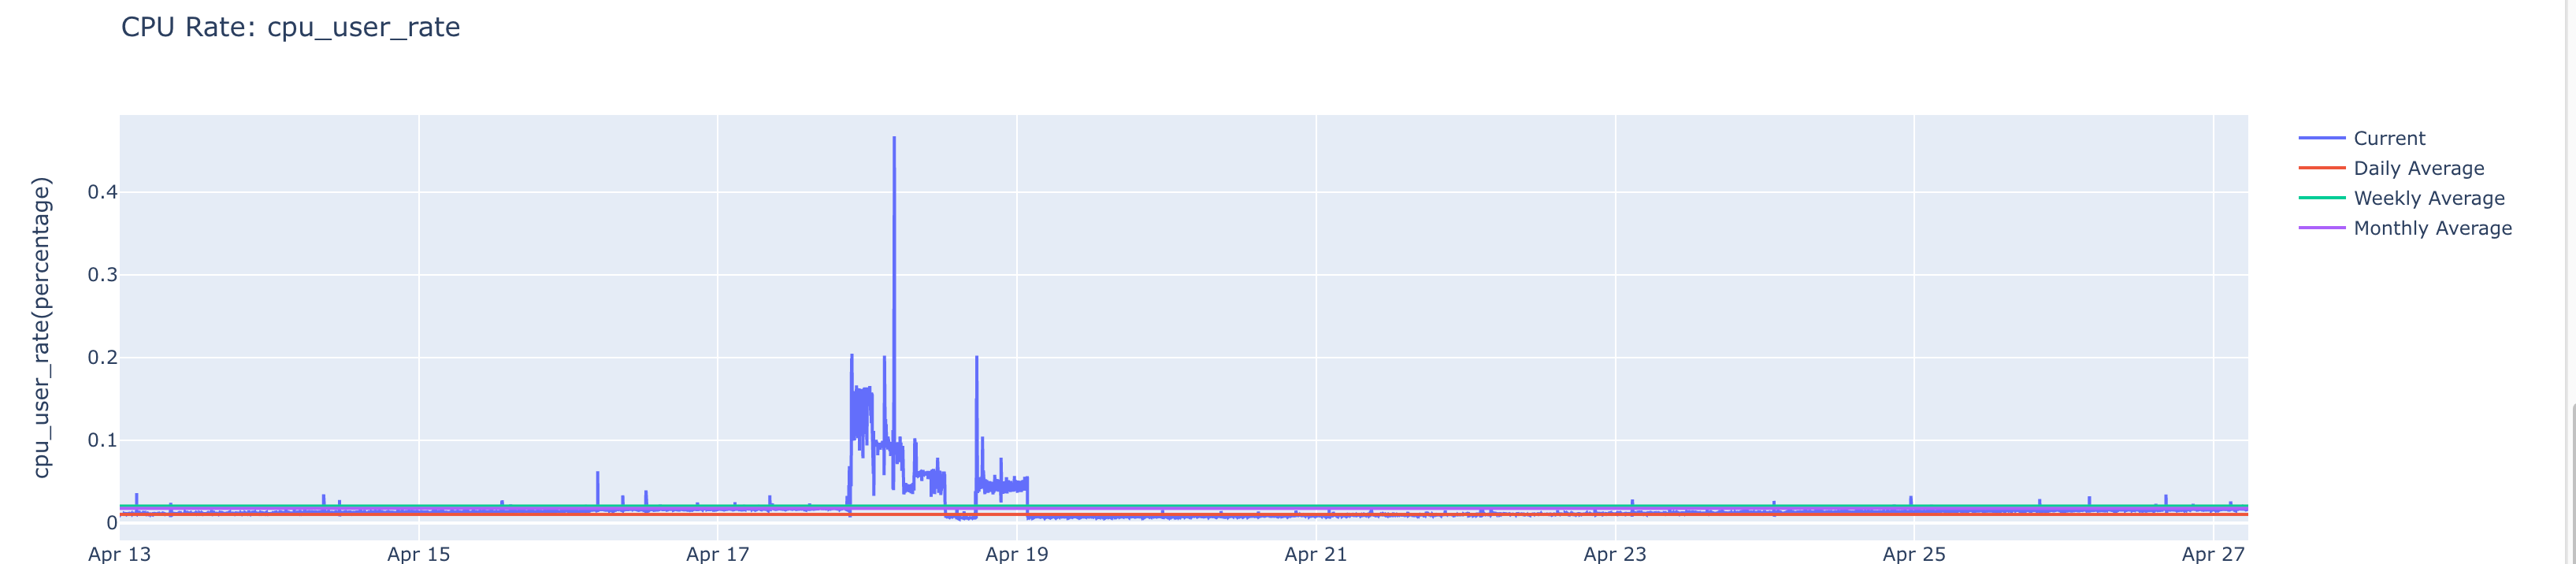
You can select one of the options on the right of the graph () to toggle between, current, monthly average, daily average, and weekly average.
Impala Service Level Inefficiency
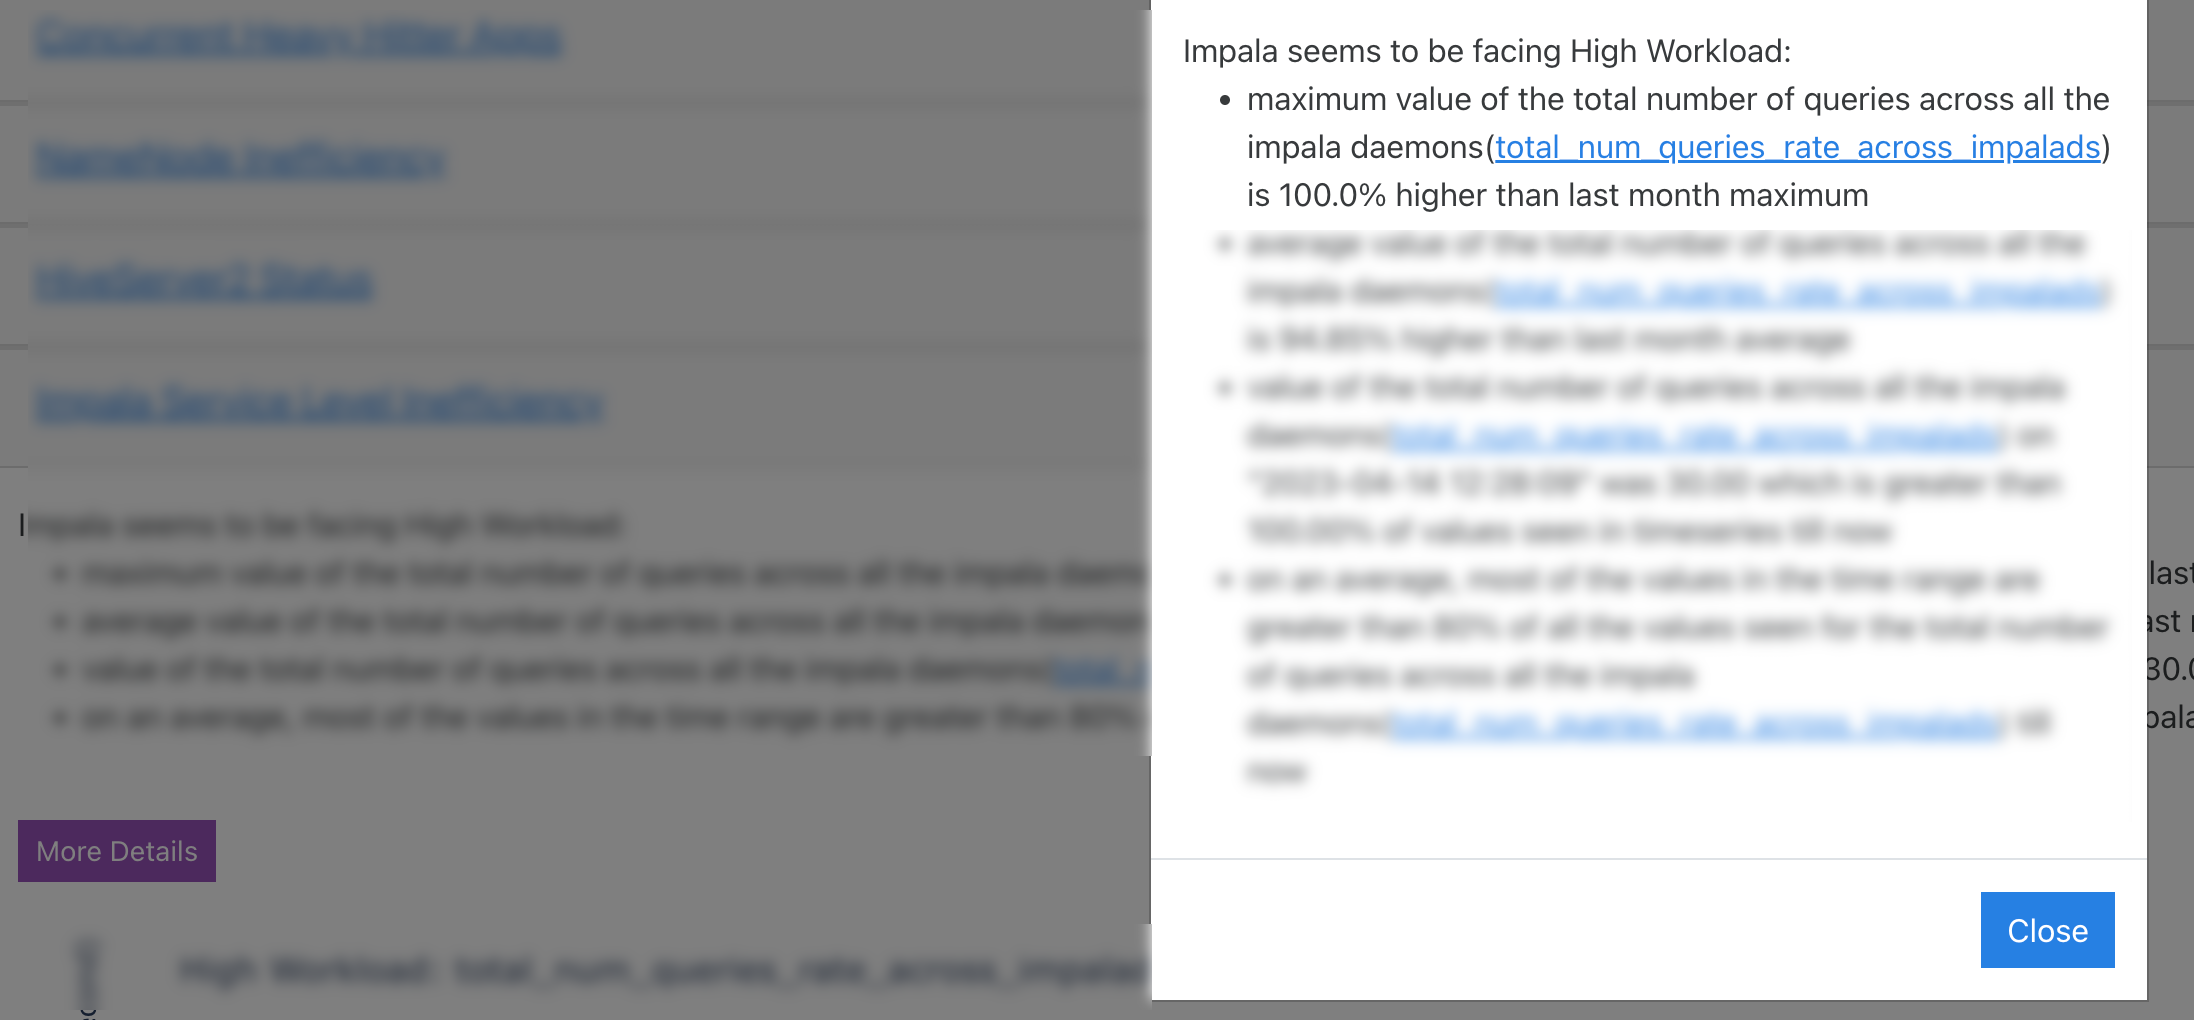
The Impala service level inefficiencies are listed with insights for improvements. Click More Details button to view the complete details of the insights.
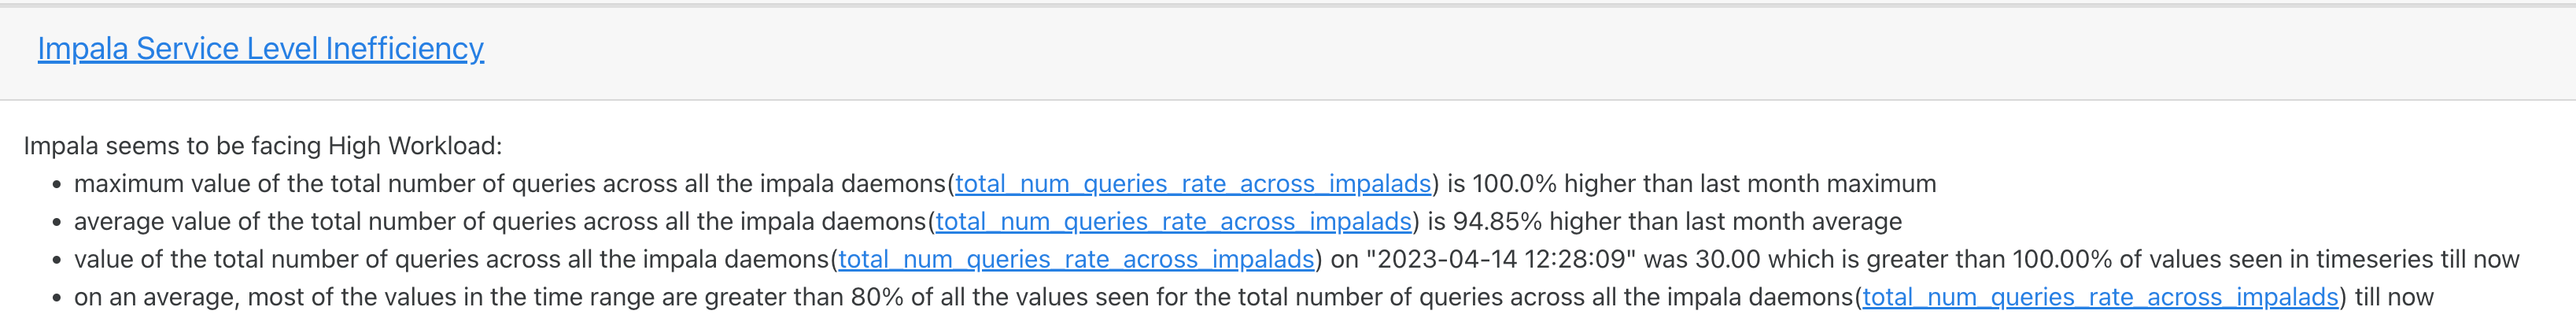
Moreover, the metrics for each of these inefficiencies are plotted in the graph for the selected duration. The current reading of the metrics is plotted and can be compared against the monthly, daily, and weekly average readings.
In the following example, a high workload is detected for the name node in the specified time range. The insight points to the time range where it consumed high or low resources for the total number of queries across all the impala daemons (total_num_queries_rate_across_impalads) metric. The value of this metric is plotted on the graph against the specified time range.
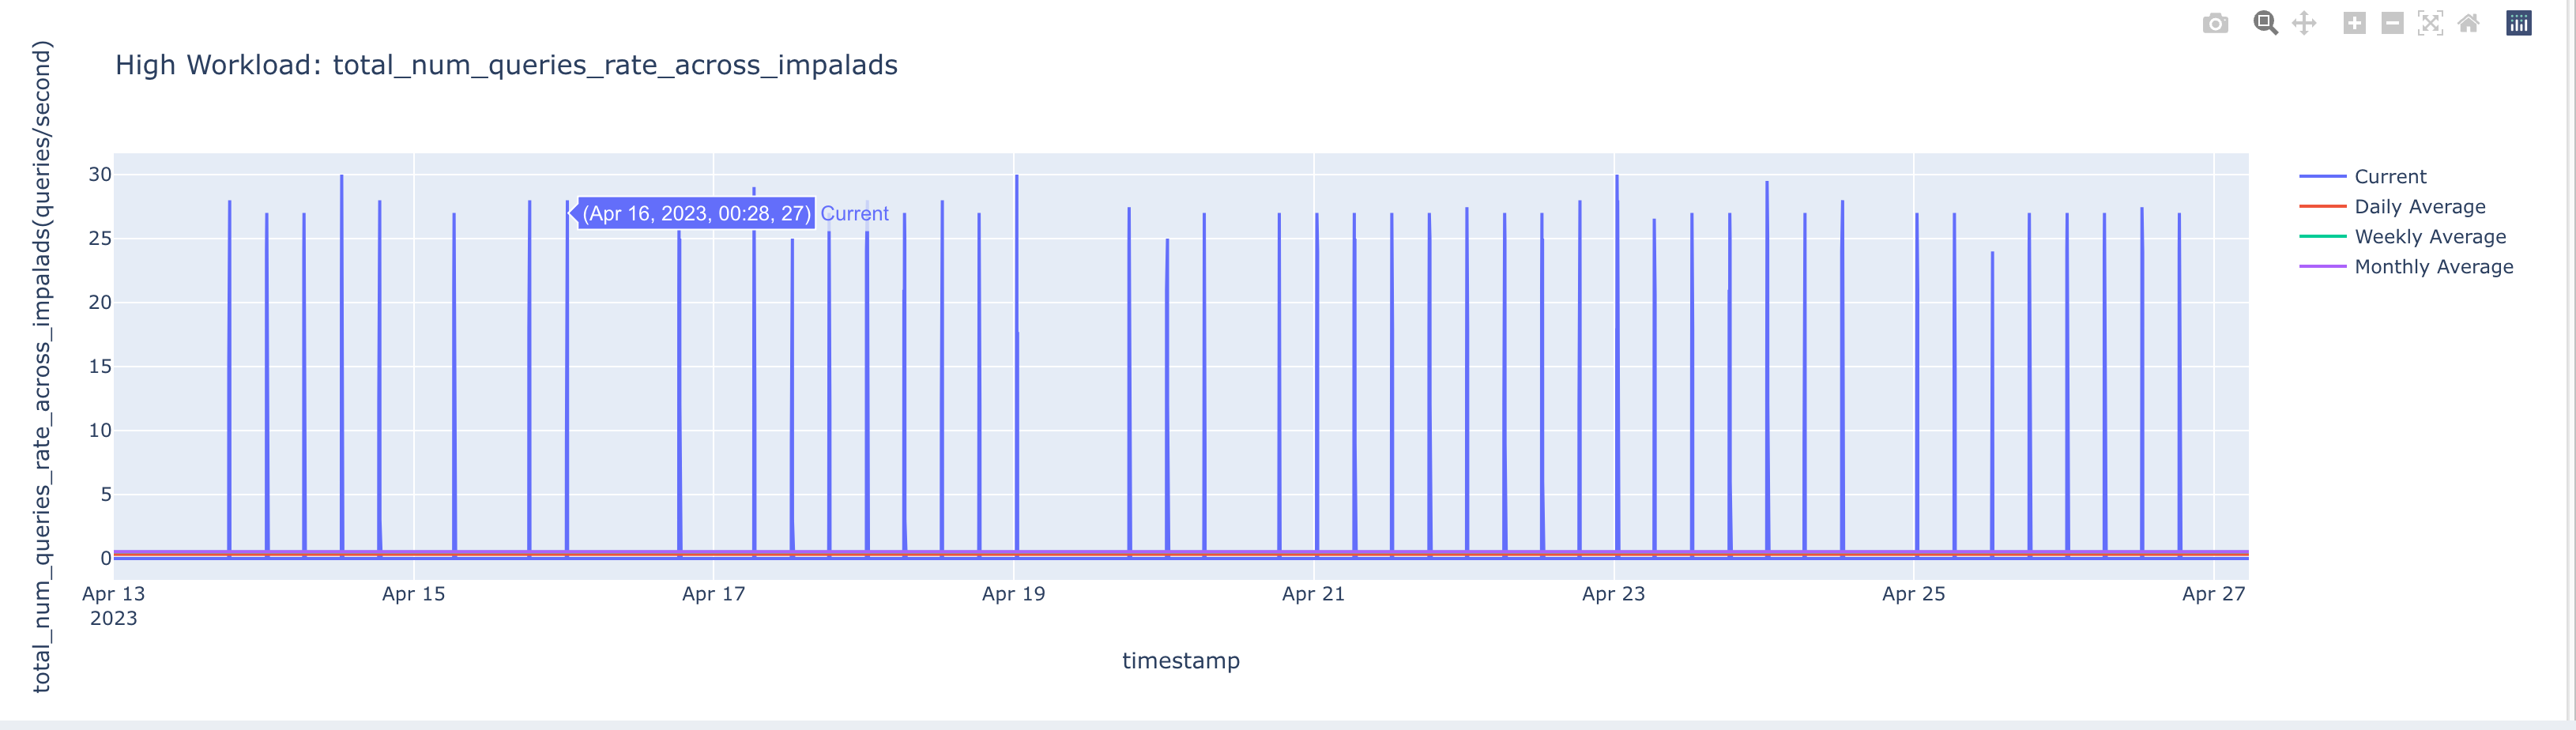
You can select one of the options on the right of the graph () to toggle between, current, monthly average, daily average, and weekly average.