Insights
The insights tab provides a single location to summarize the insights that Unravel aggregates for all unique Jobs. You can gain valuable insights to identify untapped savings, realized cost savings, different inefficient events at the signature level, savings due to productivity boost, and more.
Here are some of the functions you can perform in the insights page:
Identify jobs based on total cost.
Filter jobs by workspaces and users.
Filter jobs by categories like bottlenecks, failures, inefficiencies, over-provisioning, etc.
View the jobs with the potential for productivity boost.
Identify jobs that can provide untapped cost savings.
Identify jobs with realized cost savings.
Determine the total ROI for the jobs.
Additionally, you can identify inefficiencies at the infrastructure and code level for jobs such as slow garbage collection, excessive I/O activity, node rightsizing needs, and slow tasks in the shuffle. You can detect bottlenecks such as resource contention in the driver and slow SQL Spark Operator execution. You can also identify failures, including driver errors due to Out of Memory (OOM) and executor errors due to Out of Memory (OOM).
Let us now explore how the insights page helps you work with the jobs with the help of a few use cases as examples.
The insights you can gain in this page can be of the following categories:
Insights in this category highlight bottlenecks in the job performance, such as resource contention in the driver, slow garbage collection, and excessive I/O activity.
Usecase
As a data engineer responsible for optimizing data processing workflows on Databricks, you detect a Slow SQL Spark operator insight within your Databricks data processing workflow, leading to bottlenecks. Using the Insights tab, you can identify the SQL Spark operator causing the slowdown. By implementing Unravel's recommendations, you can improve the efficiency of the SQL Spark operator, leading to faster query execution and reduced resource consumption. With this you can improve the Workflow performance and save your costs.
This category includes insights related to failures in the job execution, such as executor errors due to out-of-memory issues or driver error due to driver out of memory.
Usecase
As a data engineer responsible for managing data processing workflows on Databricks, you can detect failures like out of memory events at the driver or executor level within your Databricks data processing workflow. This failure can lead to job failures and disruptions in workflow execution. By addressing these failures you can ensure the stability and reliability of your data processing workflows on Databricks, minimize downtime and maximize productivity.
Insights in this category point out inefficiencies in the job's execution, bad code practices, poor partitioning techniques, etc
Usecase
As a data engineer responsible for optimizing data processing workflows on Databricks, you can identify inefficiencies such as uneven load in executors and slow garbage collection using the Insights tab. By addressing these inefficiencies, you can improve workflow performance, enhance resource utilization, and maximize productivity on Databricks.
As a DevOps engineer responsible for maintaining and optimizing data processing infrastructure on Databricks, you can identify excessive I/O activity and executor idle time using the Insights tab. By optimizing data storage configurations to reduce I/O overhead or adjusting resource allocation settings to minimize executor idle time, you can optimize resource utilization, reduce processing costs, and enhance workflow efficiency.
This insight category indicates that the job is over-provisioned, meaning that more resources have been allocated to it than it needs. This insight suggests potential cost savings by resizing the instances used for the job.
Usecase
As a cloud architect overseeing infrastructure management for data processing on Databricks, you identify an Over-provisioned insight for a node resizing event within your Databricks infrastructure. By resizing the oversized nodes to smaller instances, you can reduce costs, improve resource utilization, and optimize performance on Databricks. The next steps for this insight include information about instance resizing for the driver and worker instances, which can be used to implement the necessary changes.
Viewing the insights
On the Unravel UI, navigate to Workflows > Insights.
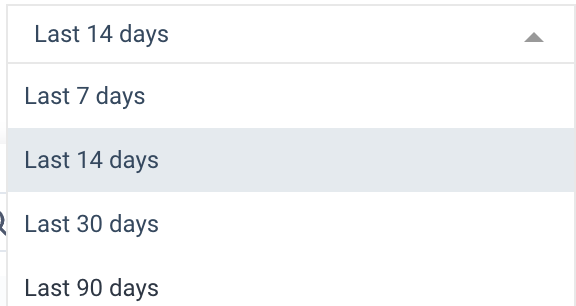
From the dropdown list in the top-right corner of the page, select the time period to generate the insights.
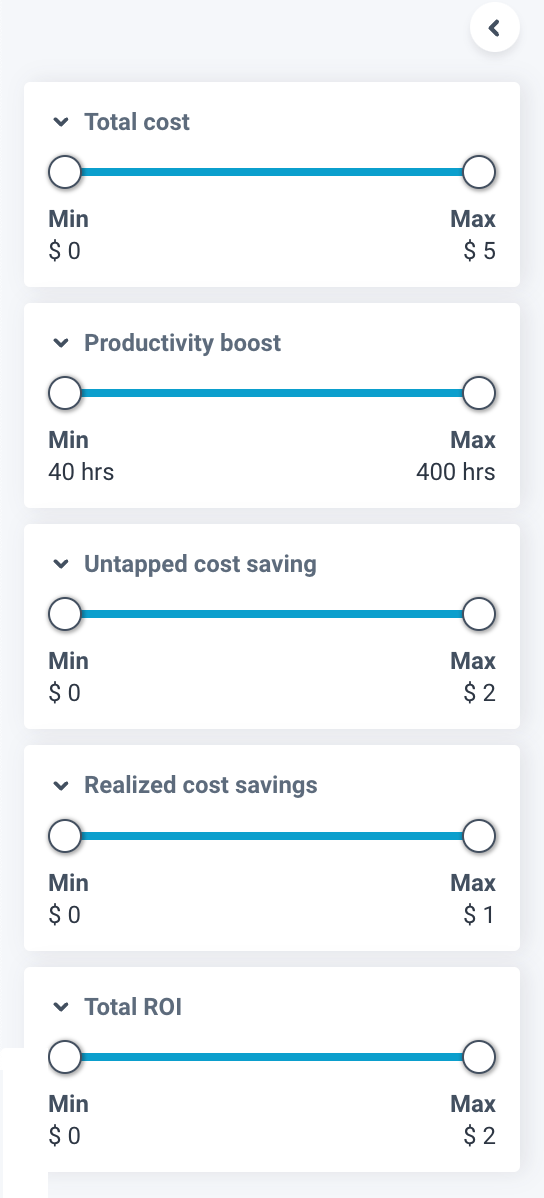
From the expandable left pane, use the slider to adjust the filters and click Apply Filters to apply the filters. The insights are generated with the filters applied.
The insights are categorized into Bottlenecks, Failures, Inefficiencies, and Over-provisioned. You can click on each of the categories and filter further for the required insights.

The following insights are available for each of the categories:
Bottlenecks
Driver contention
High IO
Slow SQL
Task skew
Failures
Driver OOM
Executor OOM
Inefficiencies
Data skew
Slow garbage collection
Inefficient join condition
Inefficient join type
Enable Photon
Over-provisioned
Node rightsizing
The generated insights are displayed in the form of a table. The insights focus on job signatures and provide insights specific to each signature.
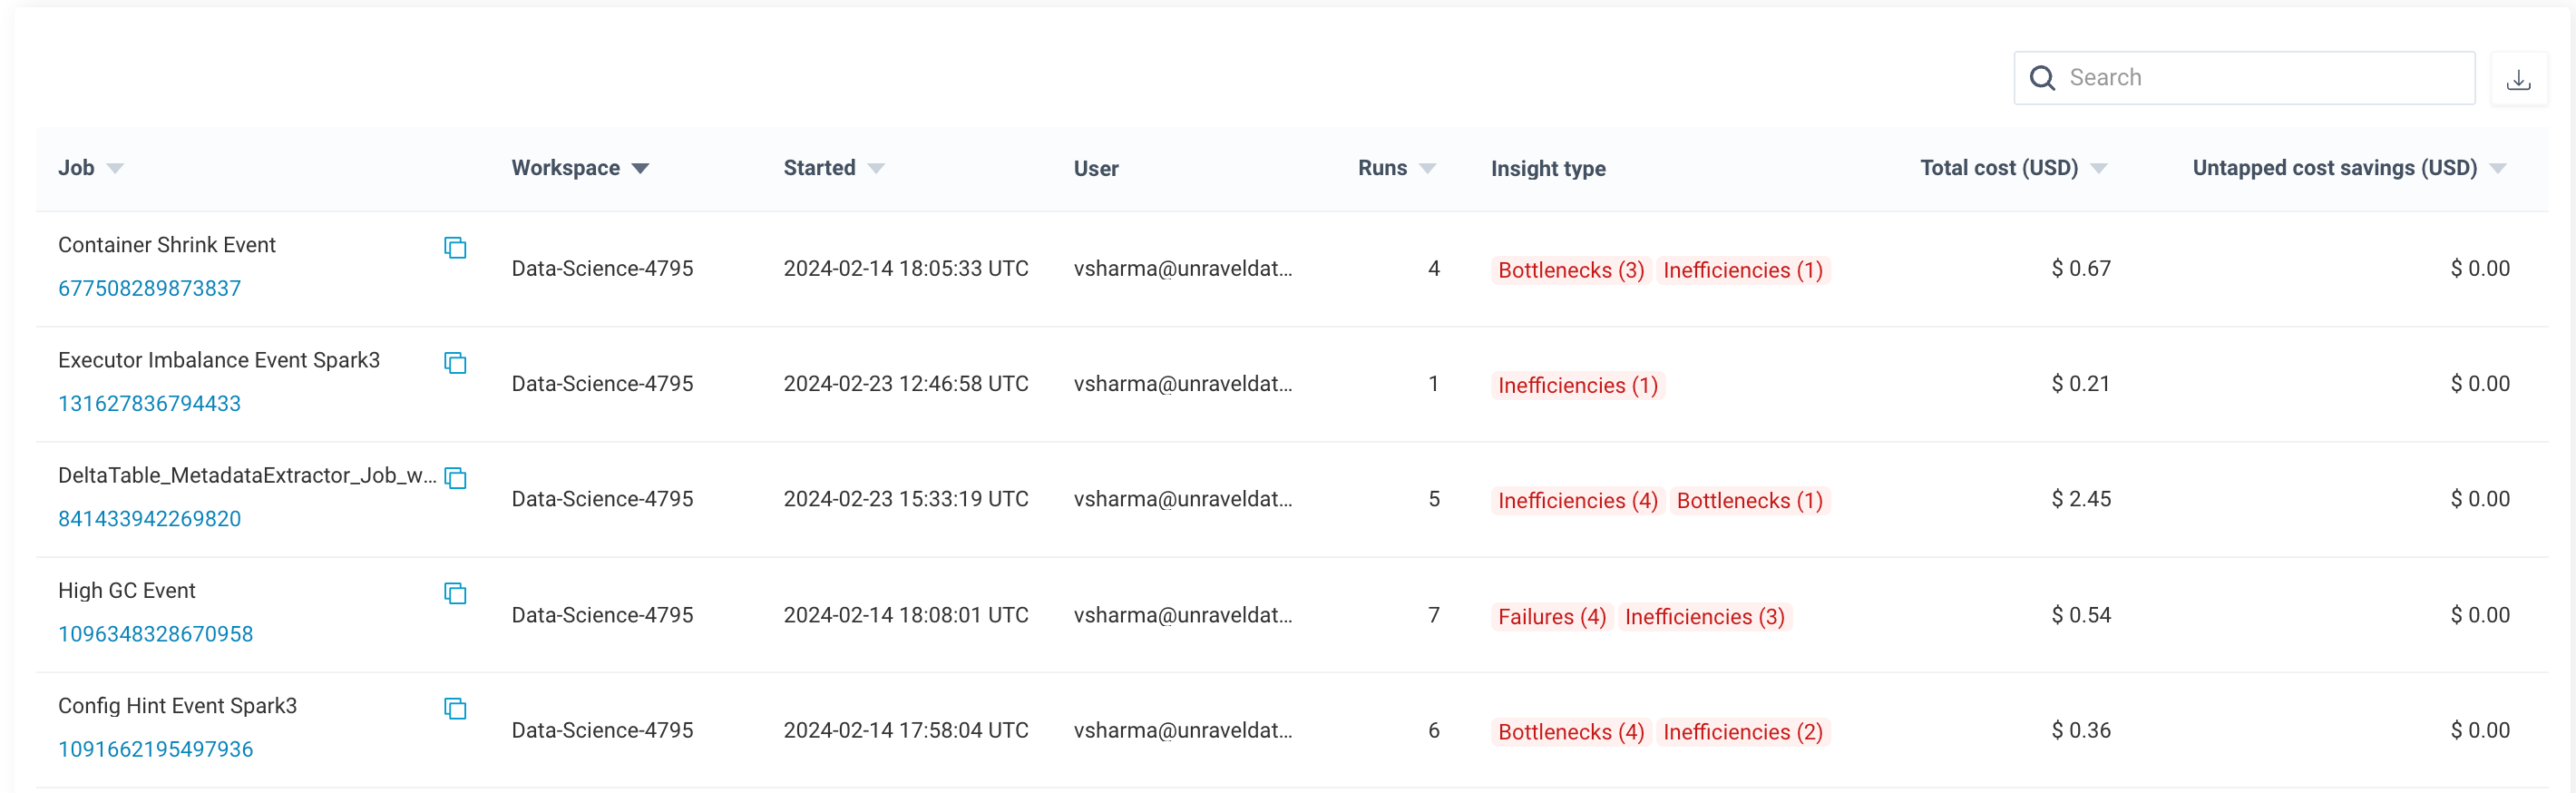
The following fields are available in the table:
Field
Description
Job
Lists the jobs associated with the insights. Click the job ID to navigate to the Databricks Jobs page. You can also click the copy icon beside the job to copy the job id.
Workspace
Lists the workspace associated with the job.
Started
Displays the time for the first run.
User
Gives the user id associated with the job.
Runs
Lists the number of times the job has been run.
Insight type
Gives information on the insights available for the job. Click on the insight type to get more information on the remedial steps for the insights.
Total Cost (USD)
Gives information on the total cost for the job in USD.
Untapped Cost Savings (USD)
Gives information on the amount of cost that can be saved in USD in the selected period, if action is taken on the insight.
Realized Cost Savings (USD)
Gives information on the amount of cost saved till date with action taken on the insight.
Total ROI (USD)
Gives an approximation of the total ROI in USD.
Productivity boost (hrs)
Gives information on the number of hours of productivity boost achieved with action on the insight.
Actions
Click View More to view more details for the job in the Job Run tab.
Insight Remediation
The insight remediation page provides a detailed summary, targeted remediation steps, and impacted runs for each of the insights. You can now access remediation steps within two clicks from any Unravel page. This page provides actionable insights toward optimal job performance and resource utilization.
Click on the required insight type to navigate to the Insight Remediation page. You can view the summary, remediation steps, and the impacted runs for each insight on this page.
You can filter for the required insight for each of the insight types in this page.
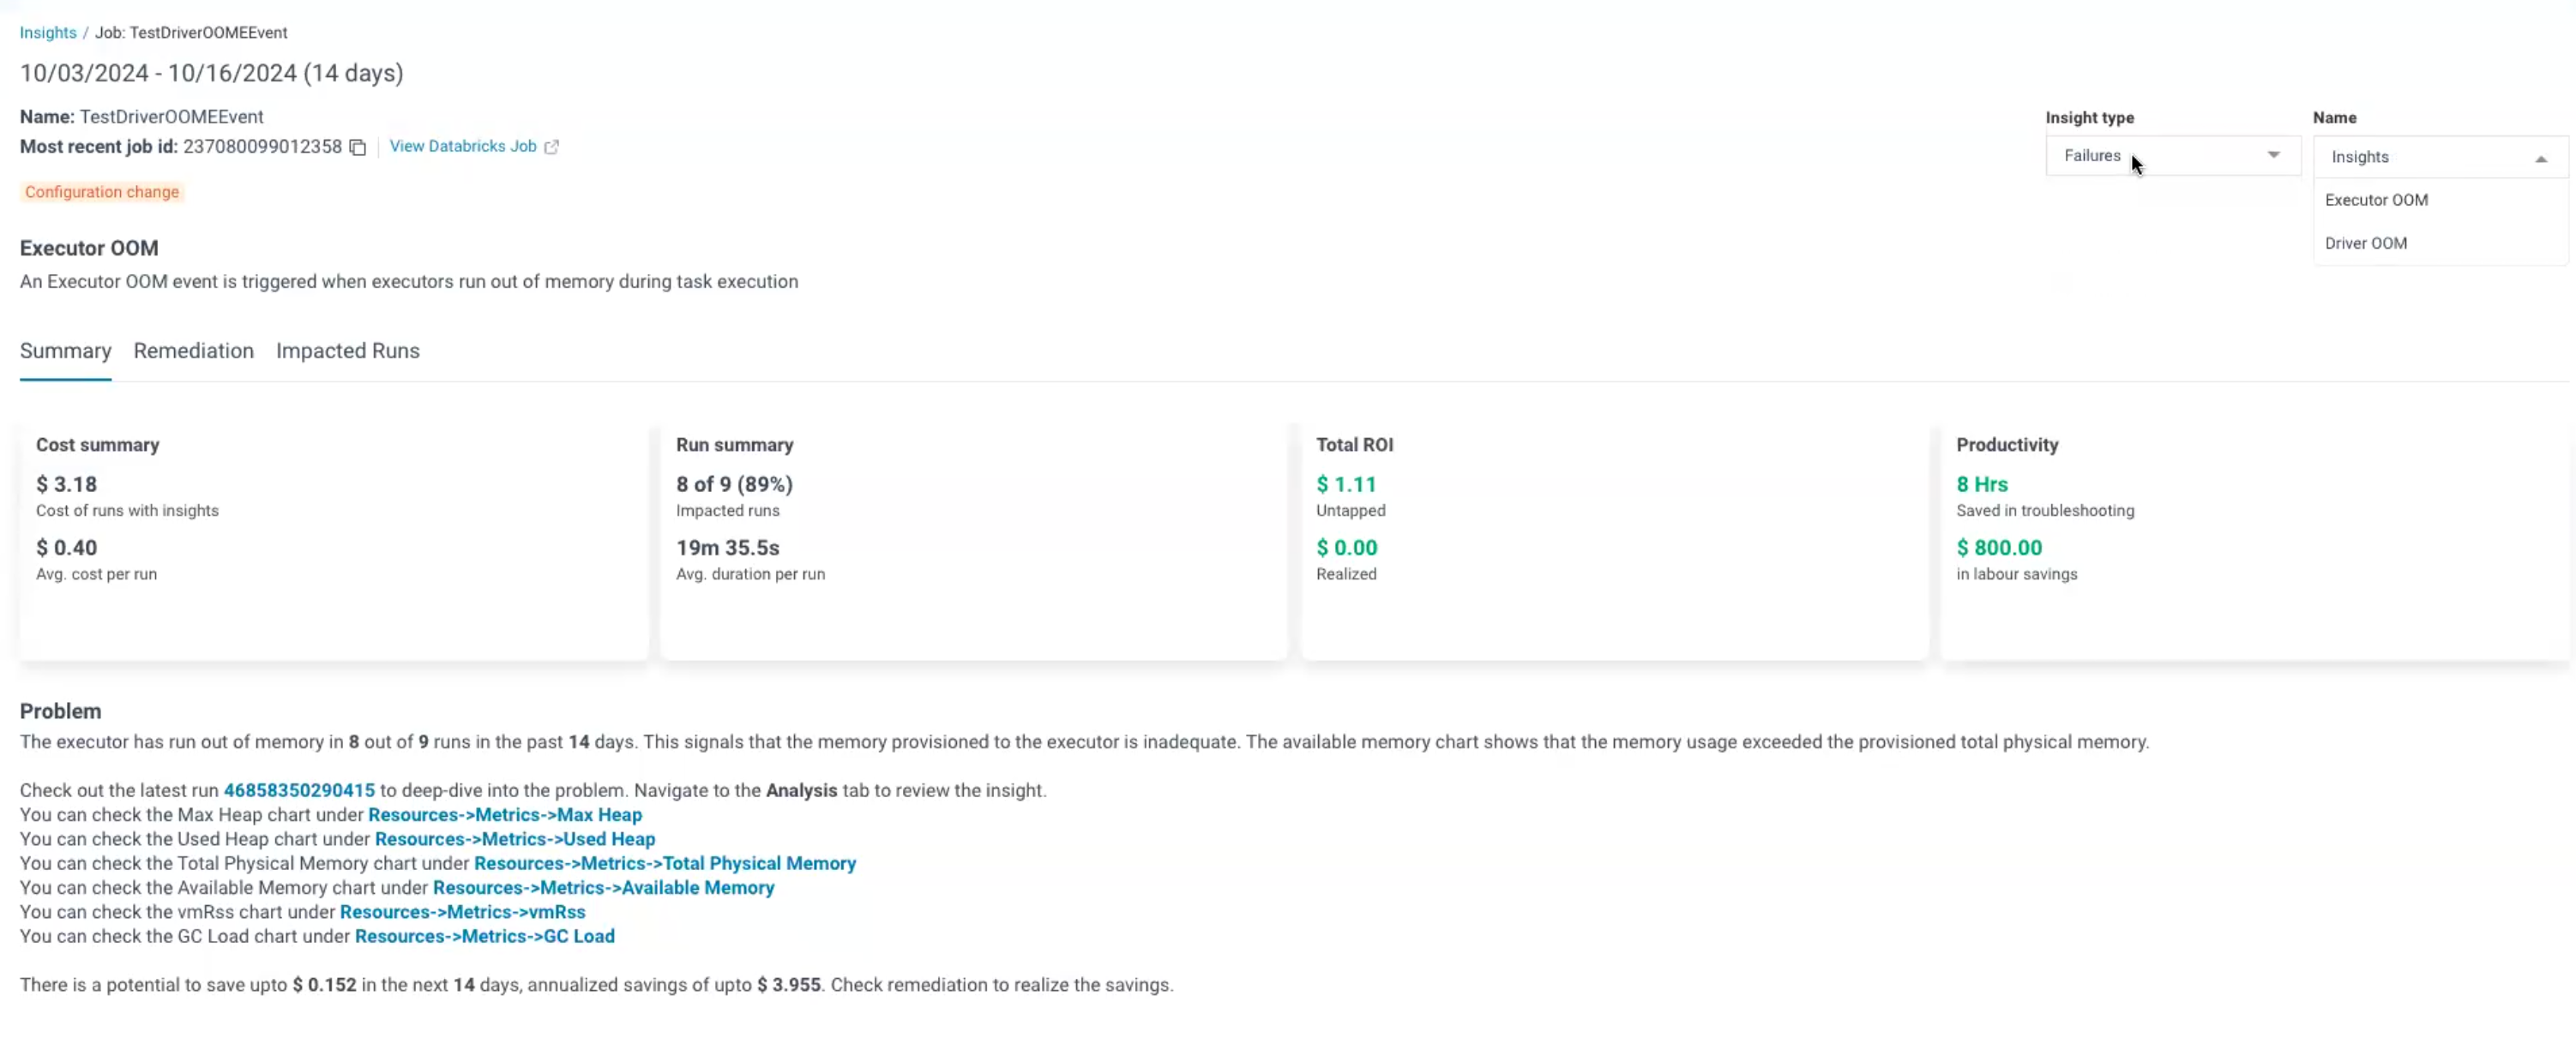
Summary
The Summary tab displays the cost summary, run summary, estimated total savings, and estimated productivity savings of the impacted runs in a panel.
Impact Panel
Cost summary: Displays the cost of the runs with insights. It also displays the average cost per run.
Run summary: Displays the number of impacted runs along with the percentage of the impacted runs. It also displays the average duration for each run.
Total ROI: Displays the untapped savings potential for the insights. Follow the remedial actions to realize the savings listed here. It also displays the realized savings.
Productivity: Displays the productivity hours that can be saved. It also displays the potential cost savings on labour by following the inisight.
You can also view a problem statement for the insight below the impact panel. The problem statement analyzes a candidate run for each signature. The Problem, symptoms, and savings potential for each signature is displayed here.
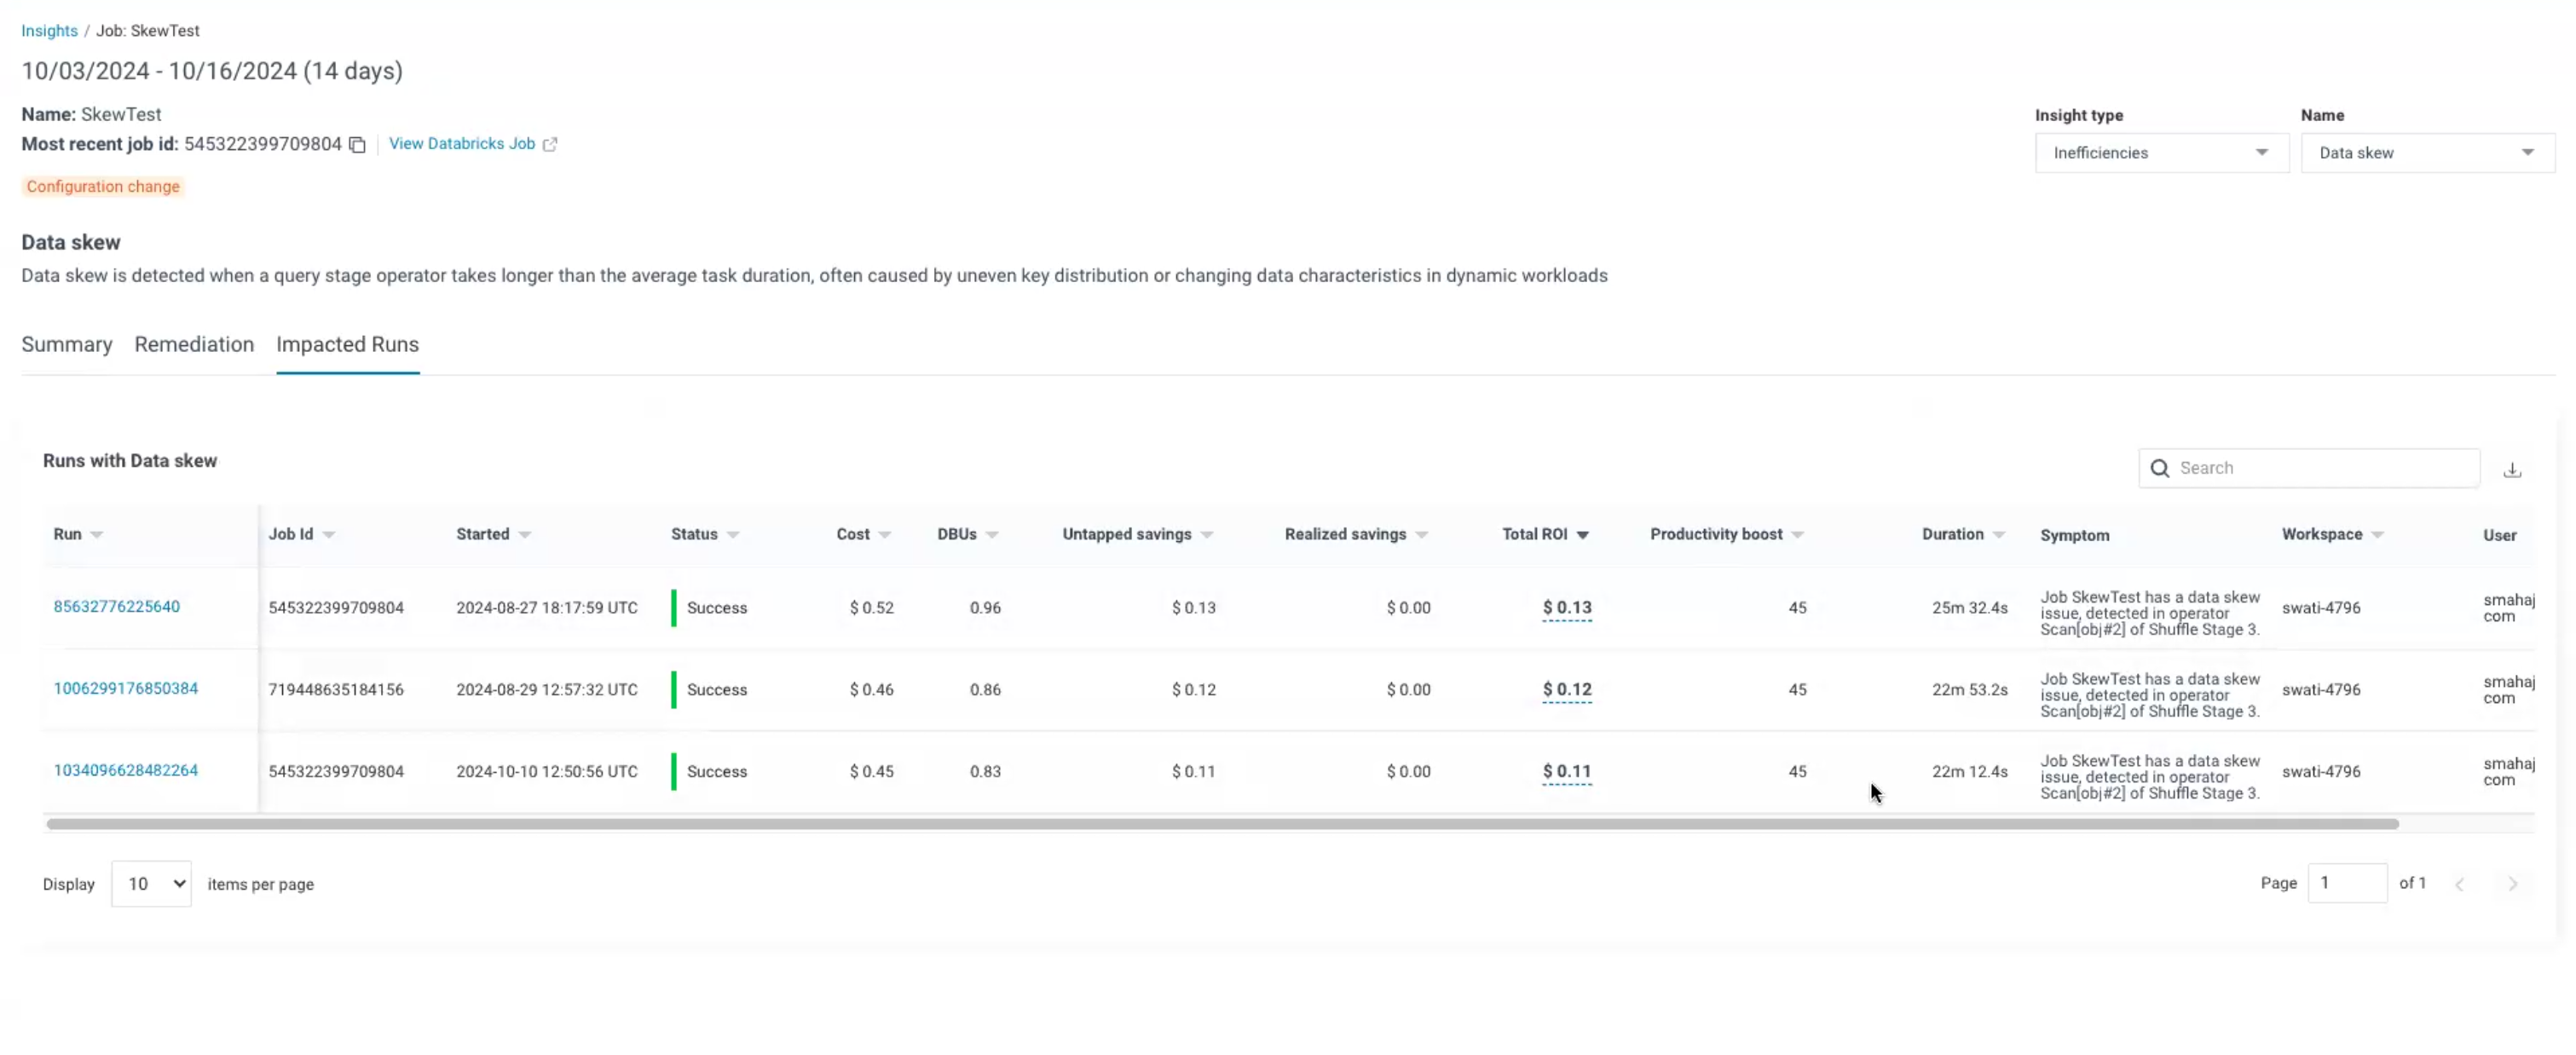
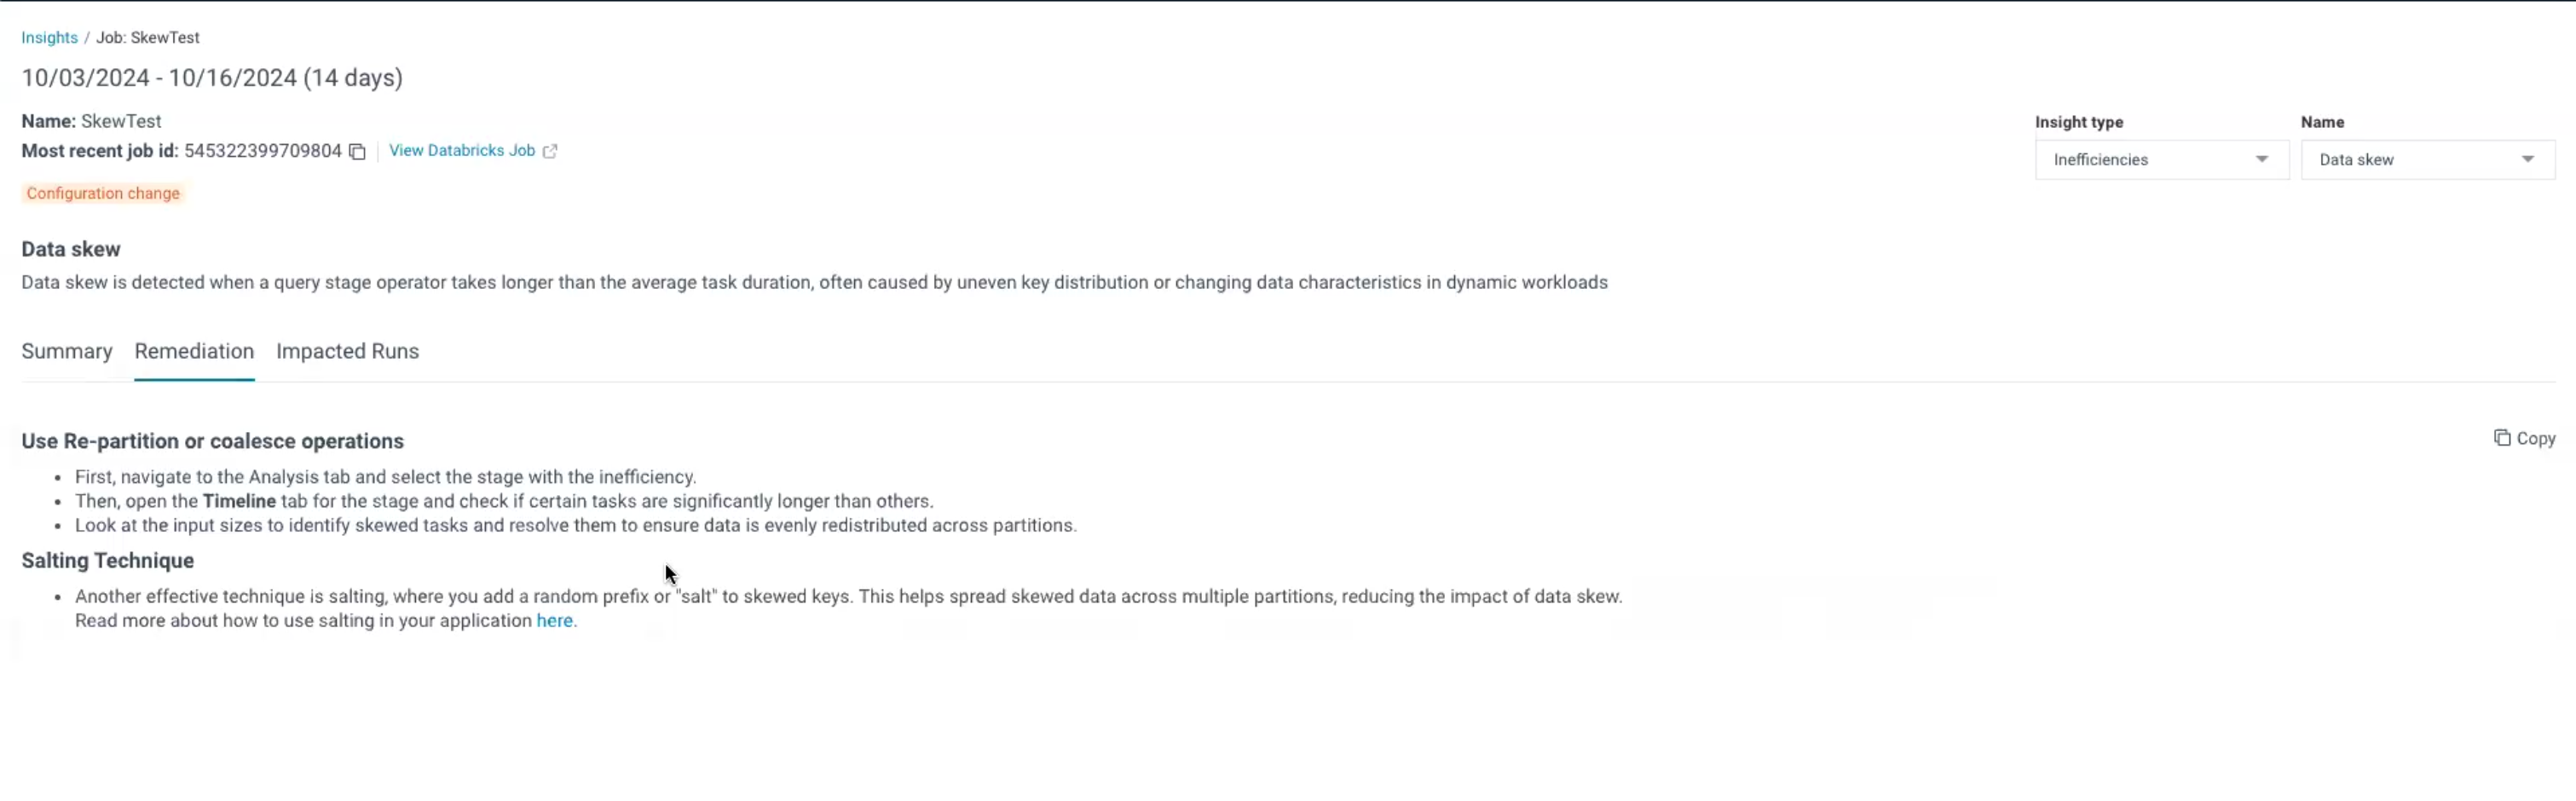
Remediation
The remediation steps for the selected insight are displayed in this tab. Follow the steps provided here to take the remediation action and realize the cost savings and improved productivity highlighted in the Summary tab.
Impacted Runs
The impacted runs tab displays runs that suffer from the problems highlighted in the selected insight. The symptom column of this tab displays the symptoms for each of the impacted runs. The symptoms vary based on each run.