Summary
The Summary tab provides a comprehensive snapshot of your cloud environment, focusing on key metrics related to cost management, savings potential, and resource utilization. Here, you can assess your current cost rating, view detailed cost breakdowns for all-purpose clusters, job clusters, and SQL warehouses, identify untapped savings opportunities, analyze cost trends over time, and monitor usage patterns by compute type.
Viewing the Summary page
The following details are show:
You can get the following ratings:
Rating | Description |
|---|---|
Snail-paced | Indicates teams are investing considerable time troubleshooting issues and saving opportunities on an environment with a large potential for optimization. |
Sluggish | Indicates teams devote extensive manual efforts to diagnose issues despite readily available insights from Unravel, indicating missed opportunities for cost efficiency. |
Accelerated | Indicates teams are increasingly relying on Unravel insights, resulting in significant time and cost savings associated with issue diagnosis. |
Lightning | Indicates teams heavily adopt and are depending on Unravel recommendations, leading to substantial savings in troubleshooting effort and costs. |
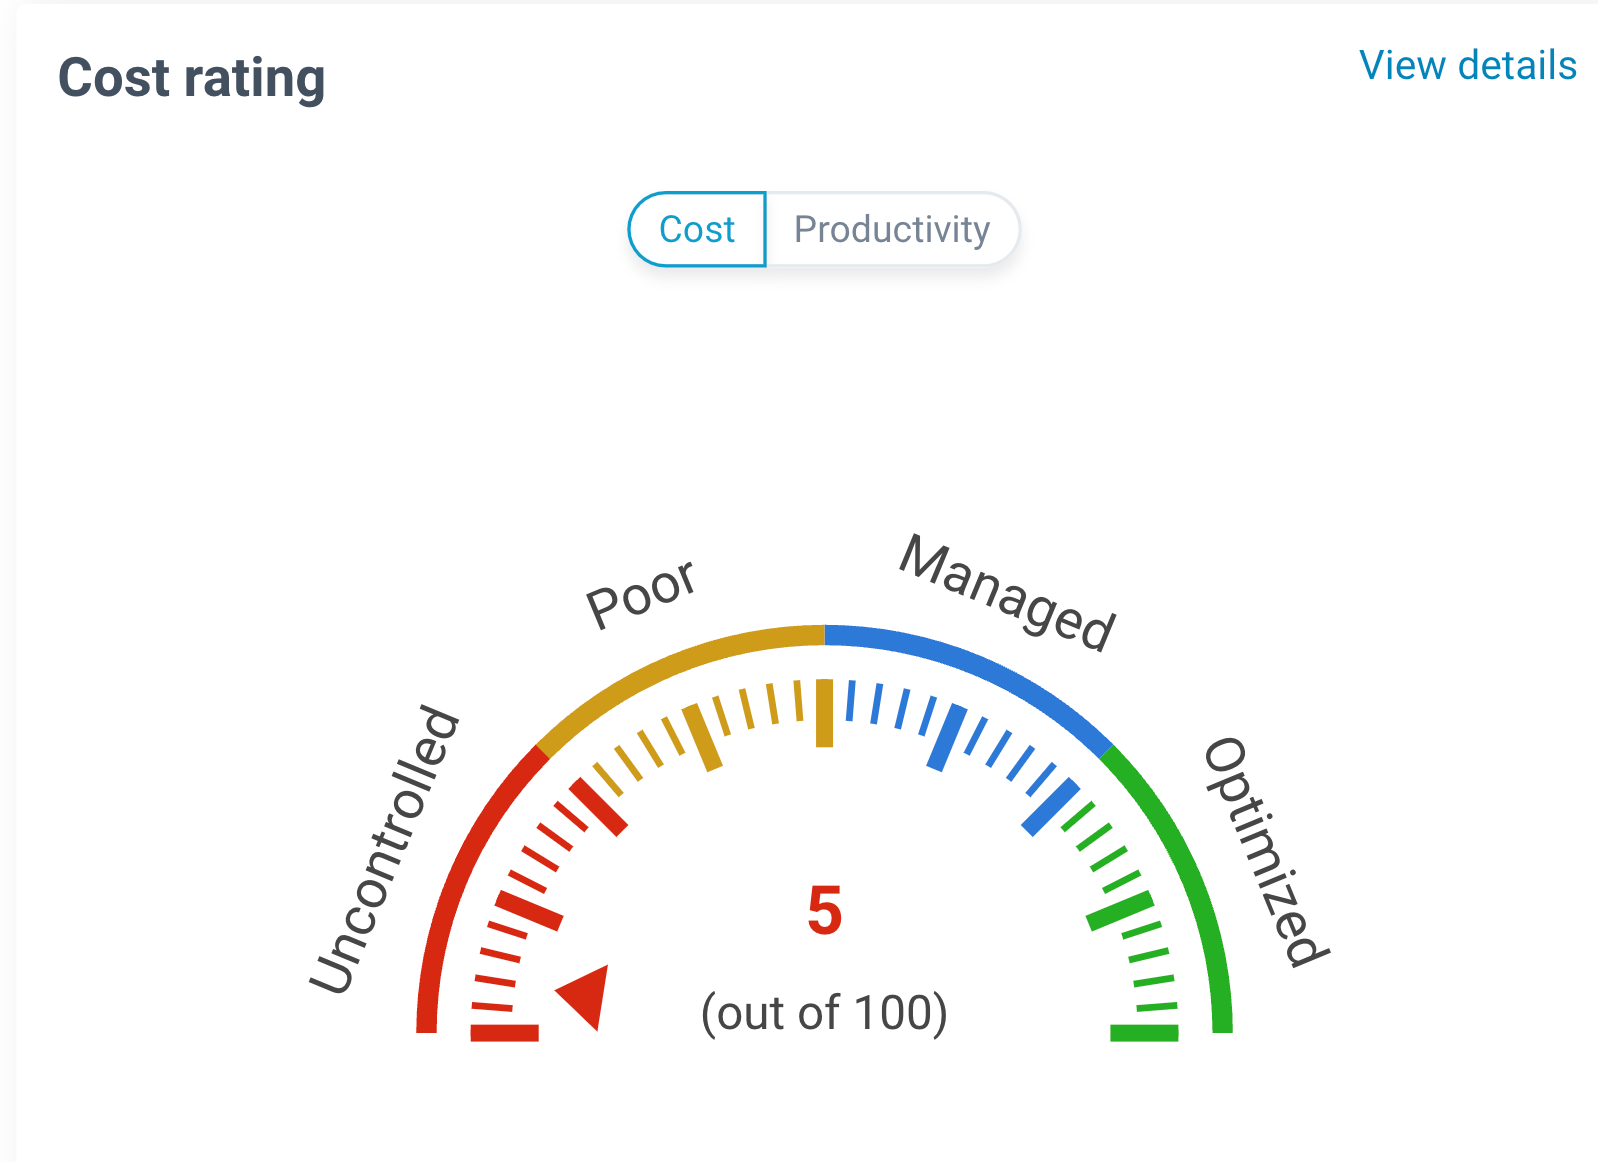
Cost rating meter: The cost rating meter assesses the effectiveness of cost management within your cloud environment. It provides a visual representation of your cost management status, indicating whether your spending is uncontrolled, poor, managed, or optimized. This meter helps you quickly gauge the level of governance, resource optimization, and cost efficiency in your cloud deployment.
You can get the following ratings:
Rating
Description
Uncontrolled
Indicates lack of governance, excessive resource wastage, unoptimized codes and data layout issues leading to inflated expenses.
Poor
Indicates irregular resource allocation, ignored code suggestions, and neglected budget overruns, potentially resulting in cost spikes and SLA risks.
Managed
Indicates costs are under control with timely actions. Room for further fine-tuning for cost savings and high performance maintenance still exists.
Optimized
Indicates costs are minimized, performance is at peak with integrated observability, resulting in significant cost savings and streamlined processes.
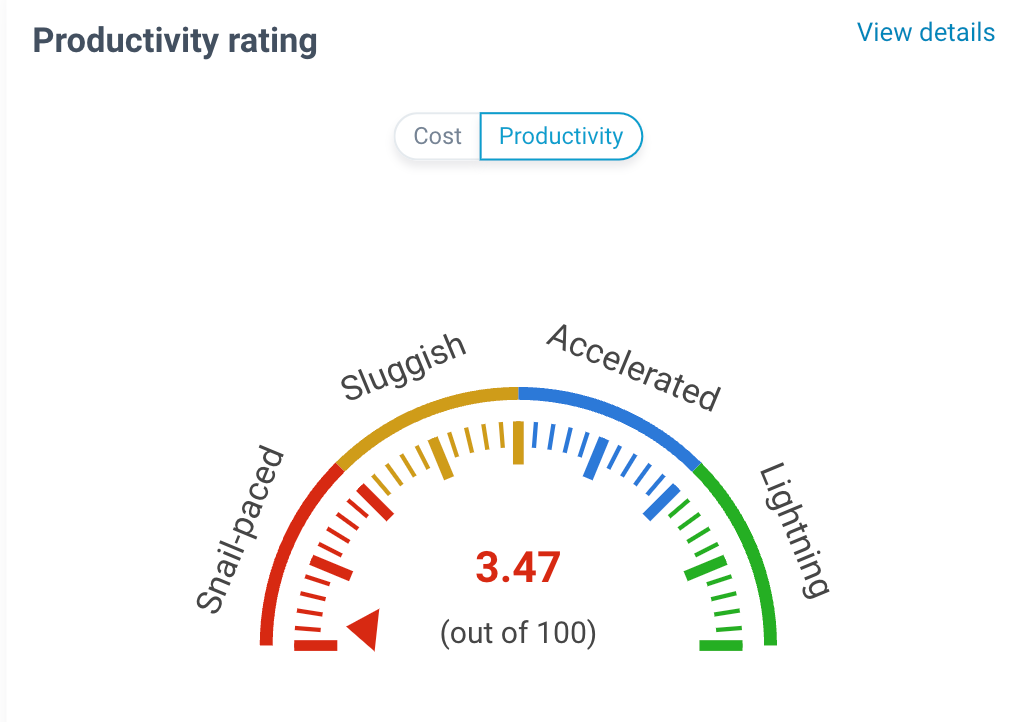
Productivity rating meter The productivity rating meter evaluates the efficiency of operational performance within your workflow. It offers a visual representation of your productivity status, indicating whether your team's pace is snail paced, sluggish, accelerated, or lightning, reflecting the effectiveness of task execution and resource utilization. This meter allows you to swiftly gauge the level of operational efficiency, diagnose areas for improvement, and optimize productivity across your workflow.
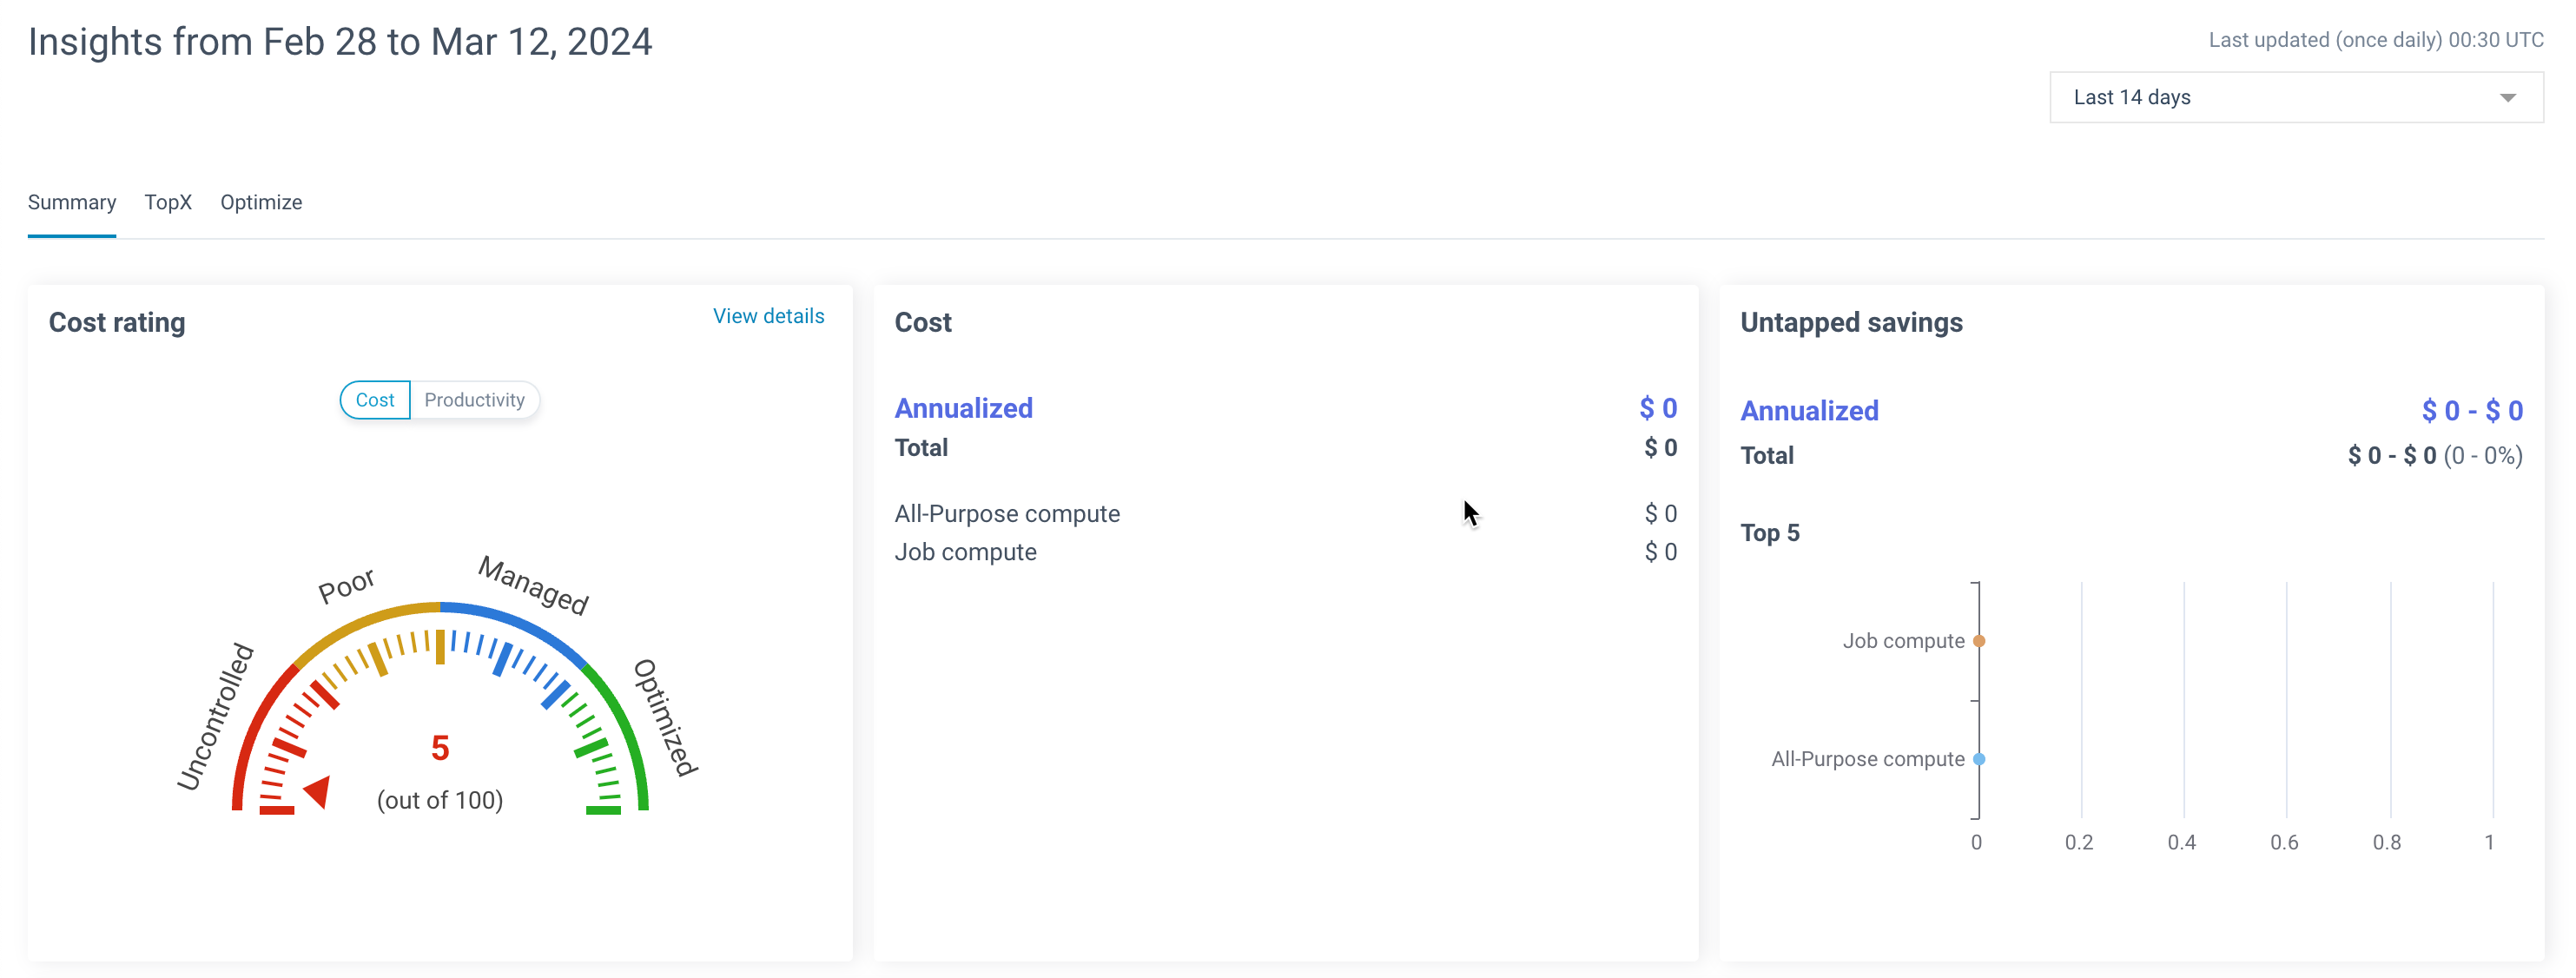
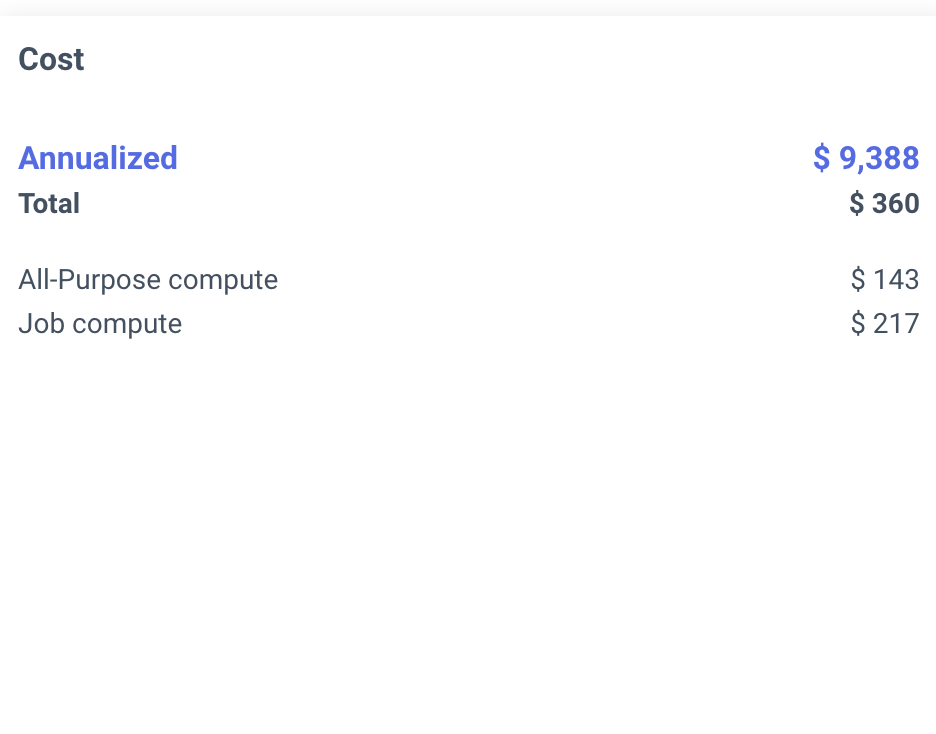
Cost: In the Cost section, view the annualized cost and total cost for each compute type.
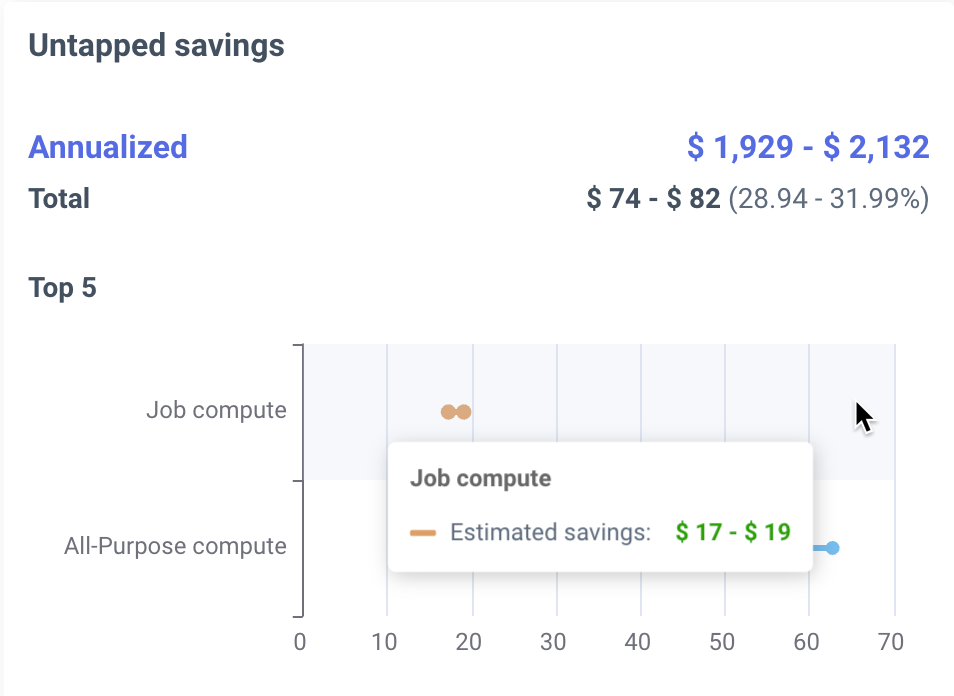
Untapped savings: In the Untapped savings section, view the annualized and total untapped savings along with a chart for each compute type .
On the Unravel UI, navigate to Home > Summary.
From the top of the page, select the required period for viewing the insights. The insights are displayed.
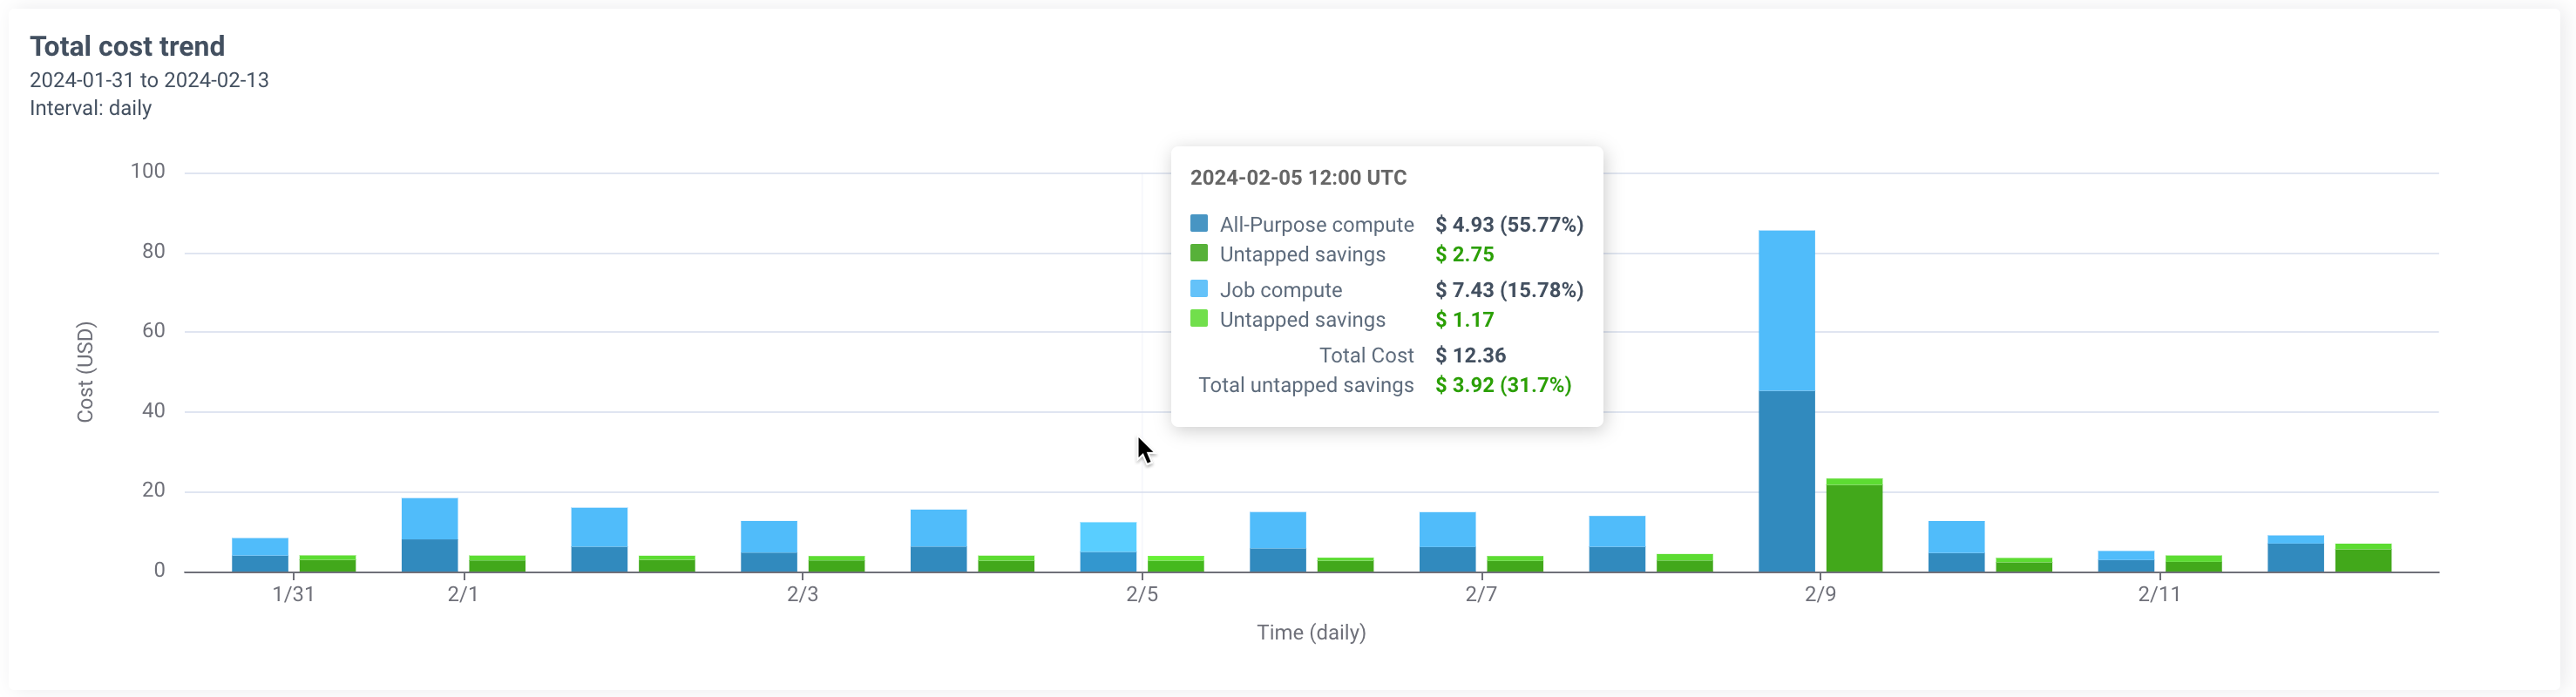
Scroll down to view the Total cost trend. This section provides a visual representation of your cloud spending over time. You can view a bar graph with cost on the y-axis and time represented on the x-axis. Hover over the graph to see the cost breakdown for each compute type at specific times, along with the total cost and total untapped savings.
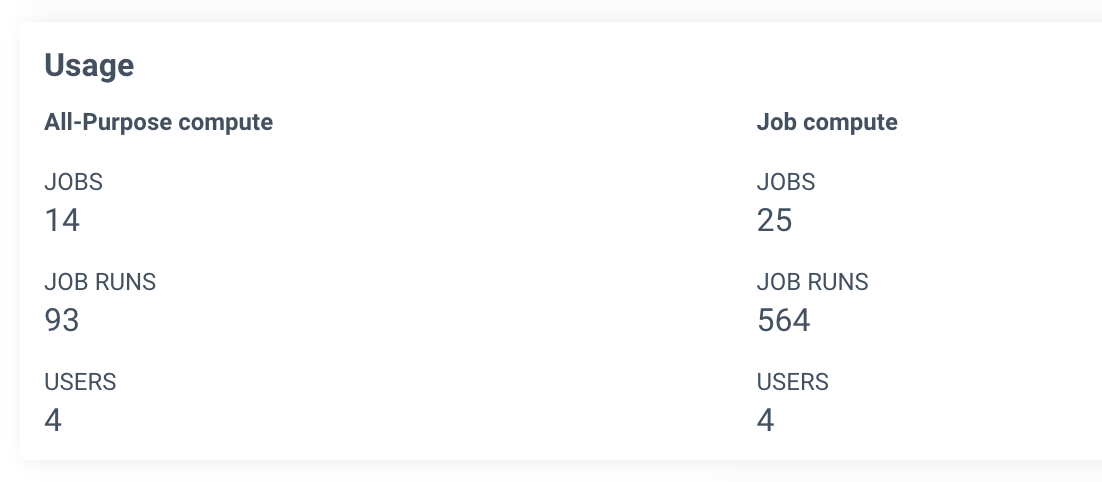
Scroll down further to view the usage metrics for your cloud environment. Detailed information on the number of jobs, job runs, and users associated with each compute type is displayed here.