Trends
The Trends page provides a detailed analysis of cloud costs, focusing on service distribution, compute resource usage, and historical spending patterns. It allows users to track key metrics such as cost trends, utilization, and efficiency over time. With interactive dashboards, users can visualize cloud bill distribution, compute cost trends, and daily or weekly cost breakdowns, helping organizations make informed financial and operational decisions. In addition, the Trends page enables you to view the trends of DBUs, cost (in $), and the number of clusters for total usage. These trends help identify periods with anomalies, such as sudden spikes in costs. Users can apply filters (e.g., users, workspaces, clusters, or tags) to customize the view, specifying up to 5 values per filter attribute. This feature allows you to compare different trends side by side and gain deeper insights into cloud usage patterns.
Viewing the cost trends
On the Unravel UI, navigate to Cost Explorer > Trends.
Click
 and select a time range to view the trend graphs. You can choose any of the preset time ranges (Last 7 days, Last 14 days, Last 30 days).
Explore the dashboards for the selected time range.
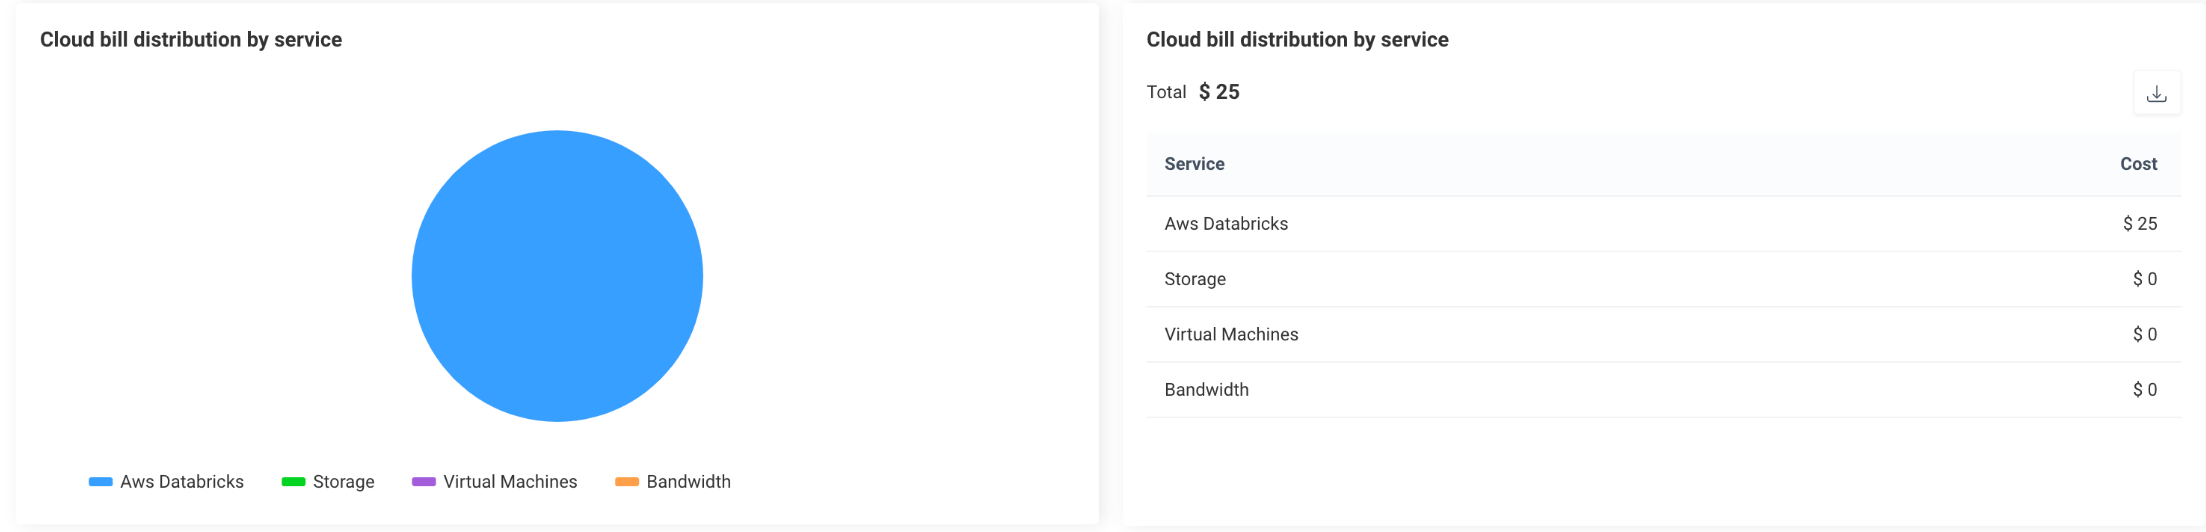
Cloud Bill Distribution by Service
Displays a pie chart and table summarizing the cost distribution across cloud services such as AWS Databricks, Storage, Virtual Machines, and Bandwidth etc. This dashboard helps identify which services are contributing the most to overall expenses.
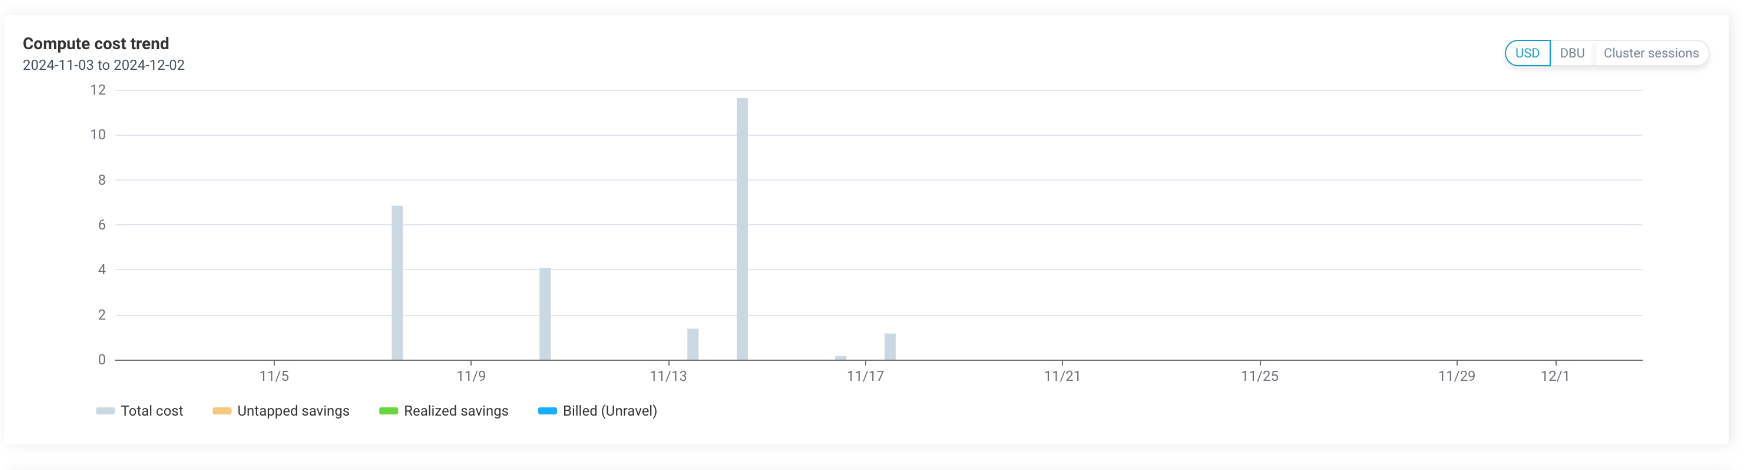
Compute Cost Trend
Shows a bar chart of daily compute costs, including categories like total cost, untapped savings, realized savings, and billed (Unravel). This helps track daily fluctuations and cost-saving opportunities. You can select DBUs, USD, or Clusters sessions to view the cost trend for the selected attribute.
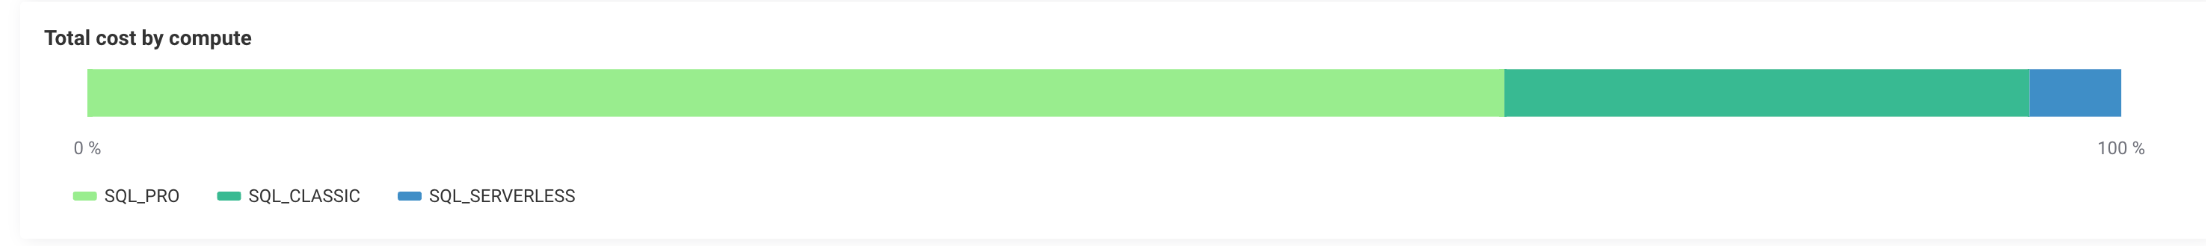
Total Cost by Compute
Provides a visual breakdown of costs across compute types. This section helps assess the cost contribution of different compute modes.
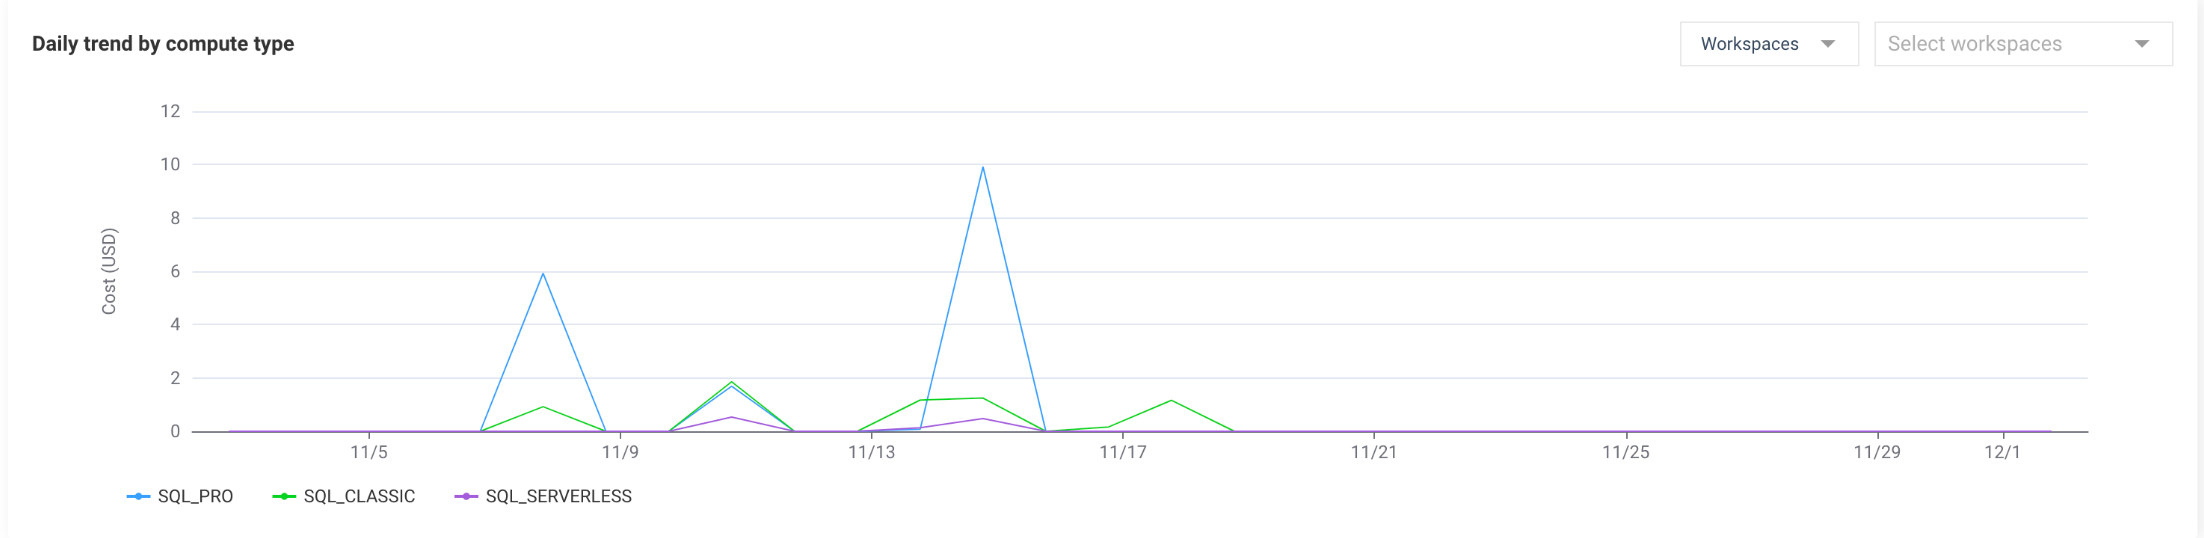
Daily Trend by Compute Type
Displays a line chart showing daily cost trends segmented by compute types. This trend analysis enables users to monitor compute-specific cost patterns over time. You can filter by Workspace, User, Clusters, or tags to view the trend for the selected attributes.
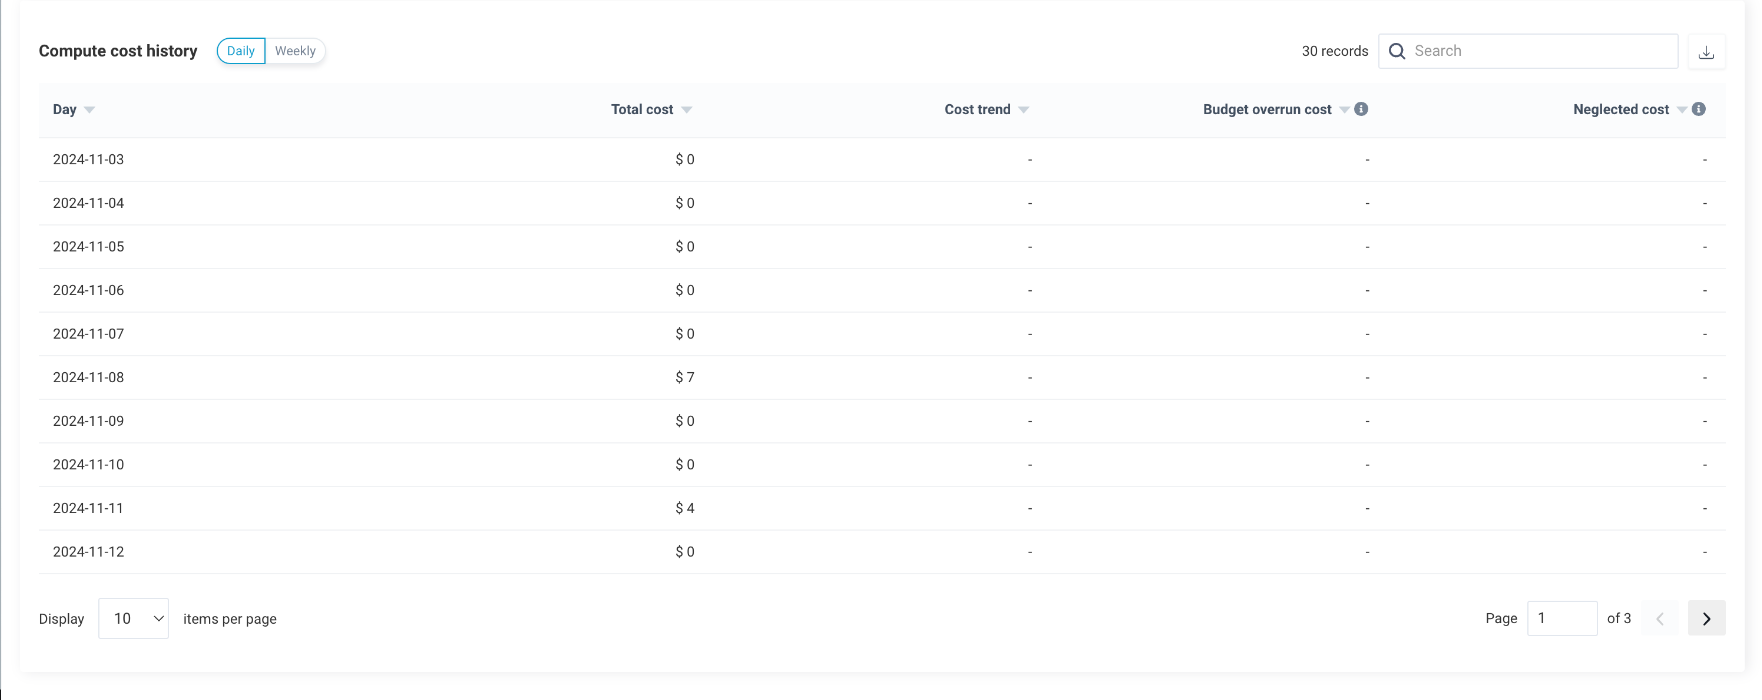
Compute Cost History
Lists daily or weekly compute cost details in a tabular format, including total costs, cost trends, budget overruns, and neglected costs. This dashboard supports in-depth cost analysis and long-term budget planning.