Spark structured streaming details page
Overview
Unravel supports Spark structured streaming applications. The Structured Streaming feature provides a real-time view of all long-running structured streaming jobs.
From the Spark structured streaming application details page, you can perform the following tasks:
Monitor long-running structured streaming jobs
Monitor the concurrent structured streaming queries
Navigate and visualize all the structured streaming queries
Track statistics of the structured streaming queries
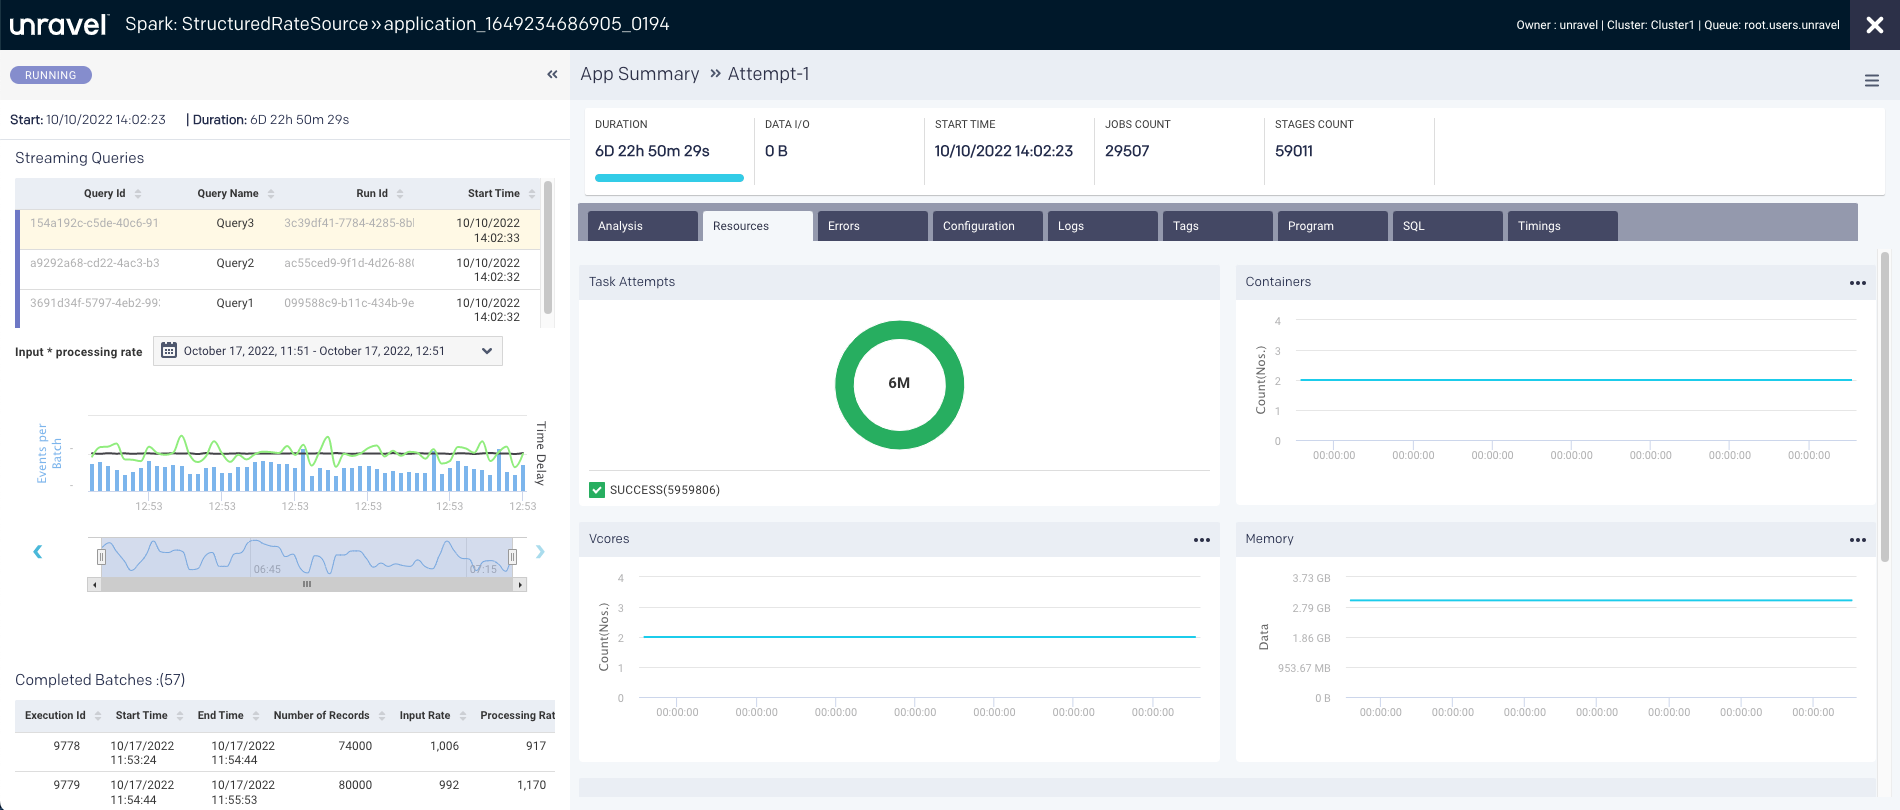
The following details are shown in the uppermost section of the Spark structured streaming application details page:
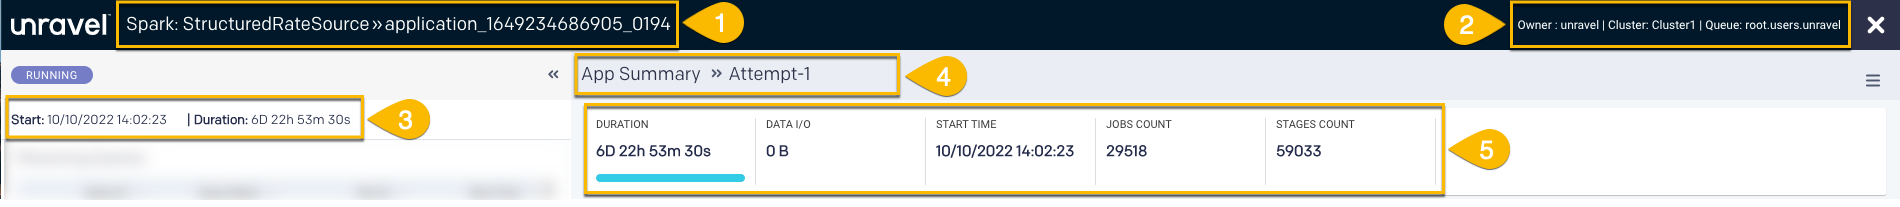
Item No. | Description |
|---|---|
1 | Name or ID of the Spark application. |
2 | Details of the Spark app owner, cluster ID, and Queue. |
3 | Start time of the application run. Duration of the application run. |
4 | Indicates the navigation drill-down into job attempts. |
5 |
|
The query table displays the structured streaming query data. A maximum of up to 20 queries are displayed in the table.
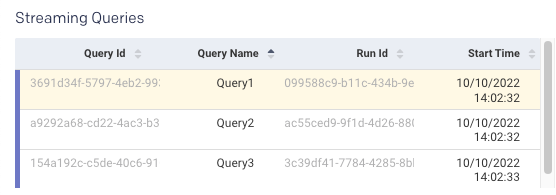
You can select the query to monitor the status of the query. The relevant statistics of the query are displayed on the lower right chart.
Column name | Description |
|---|---|
Query ID | A unique ID generated for the query. A unique query ID is auto-generated when StreamExecution is created. |
Query Name (Optional) | A unique name given to the structured streaming query. This is a user-defined query name. |
Run ID | A unique ID for every query that starts or restarts. A universally unique identifier (UUID) is auto-generated when the stream query is started or restarted. If the query fails and restarts, a new run ID is generated and displayed in the column. |
Start Time | The time when the query is started. |
This graph combines two graphs (input rate versus processing rate).
These metrics help you debug anomalies in query processing. For example, if your streaming application is continuously lagging, you can check whether the processing rate is lower than the input rate.
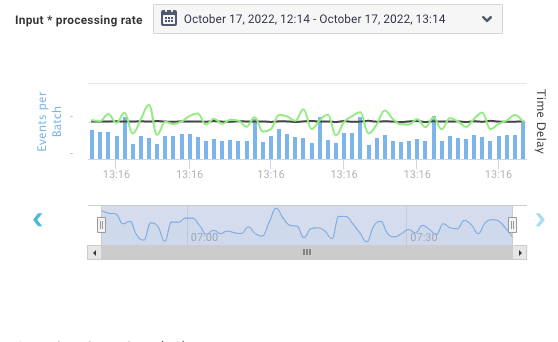
Number of records: Blue bars represent the number of records processed in a batch.
Input rate: Black line represents the input rate, the number of input records per second in the given triggers.
Processing rate: Green line represents the processing rate, the number of records processed per second in the given triggers.
The processing rate must remain higher than the input rate. If the processing rate is lower than the input rate, then the streaming query fails behind the input data, and you might need to add more resources to the cluster to keep up the processing speed.
All the events are processed into batches (called micro-batches). The batch details are displayed in the Completed Batches table.
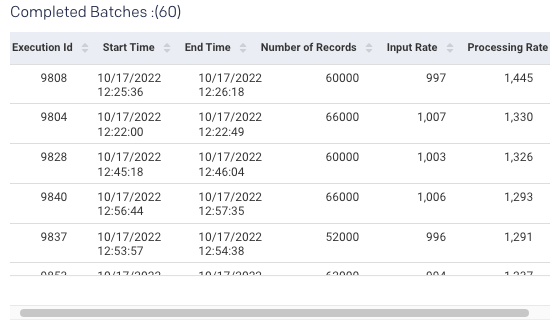
Column name | Description |
|---|---|
Execution ID | An ID of the query execution. The execution ID of the completed batch remains the same unless any job is executed as a part of the previous batch. |
Start time | The time when the batch or execution started or restarted. |
End time | The time when the structured streaming query batch or execution is stopped. |
Number of records | Count of records processed in one batch or execution. |
Input rate | A number of input records per second for the current trigger. |
Processing rate | Records processed per second for the current trigger. |
Select the batch to view its data displayed on the Job, Source, and Sink tabs.
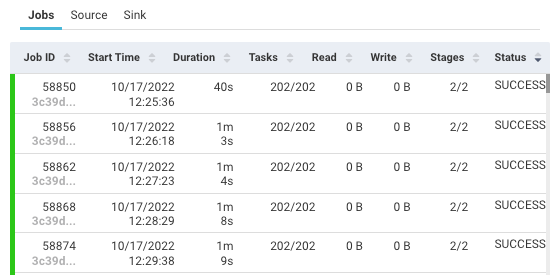
Job: Displays KPIs and stages based on the selected job.
Column name
Description
Job ID
An ID of the job in the application.
Duration
The period since the job started.
Tasks
Tasks in the current stage.
Read
Bytes of data read by the process.
Write
Bytes of data written by the process.
Stages
The execution stage of the job.
Source: Displays detailed statistics on data being read from each of the streaming sources:
Column name
Description
Start Offset
The starting offset for data being read for each topic and each partition.
End Offset
The ending offset for data being read for each topic and each partition.
Description
Type of source and source-related information.
Input Rate
The rate at which data arrives from this source.
Processing Rate
The rate at which Spark processes data from this source
Number of records
The number of records received from the sources and processed since the streaming query started.
Sink: Output sink of the query. Example:
org.apache.spark.sql.execution.streaming.ConsoleSinkProvider@462355e
App Summary
The Application Summary page provides the details of the jobs run in a Spark application. The following tabs are included on the Application Summary page:
The Unravel intelligence engine helps you manage your jobs and pipelines by analyzing its run and providing insights based on the runs. Unravel's analysis results show where the efficiencies of your job can be improved.
The number of efficiencies found is noted in the tab. When an Efficiency leads to a suggested parameter or property change, those suggestions are listed as Recommendations.
Efficiency (
 ): Suggest areas to examine to improve efficiency. For example, inefficient usage of resources. Expand an Efficiency tab to read the in-depth analysis. While some are only configuration property suggestions, others focus on areas you should examine. For example, inefficient storage, problems with a query, and so on.
SLA: Recommendations to improve the application performance to meet the SLA.
Bottlenecks: Insights to resolve bottlenecks, such as bad JOINs or partitioning issues, for your SQL queries.
App Failure: Points out common application failures, such as failure due to out-of-memory (OOM).
Recommendations (
 ): Suggestions to update a property or configuration parameter. Click to view the current and recommended value.
The resources contain the following charts:
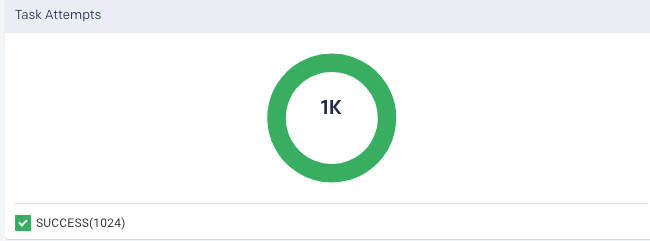
Taskattempt: Graphically and textually note the number of tasks and their status. The donut graphs show the percentage of successful (green), failed (orange), and killed (red) tasks.
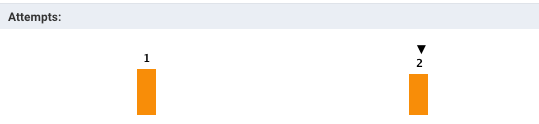
In case of failed or killed, the Attempts graph is displayed on the left, which plots the number of attempts that were made before the application failed or got killed.
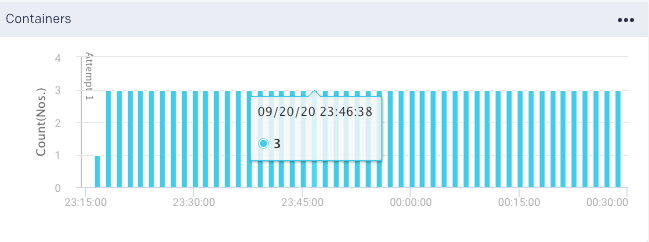
Containers: Graphs the number of containers used.
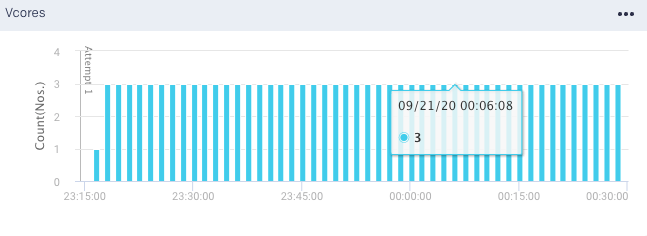
vCores Graphs the vCores used for running the jobs.
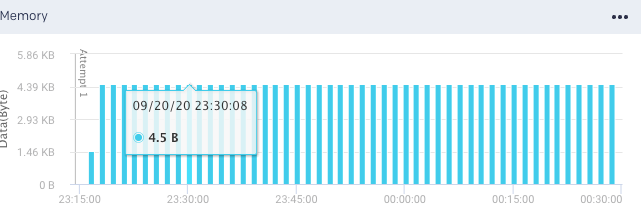
Memory: Graphs the memory used for running the jobs.
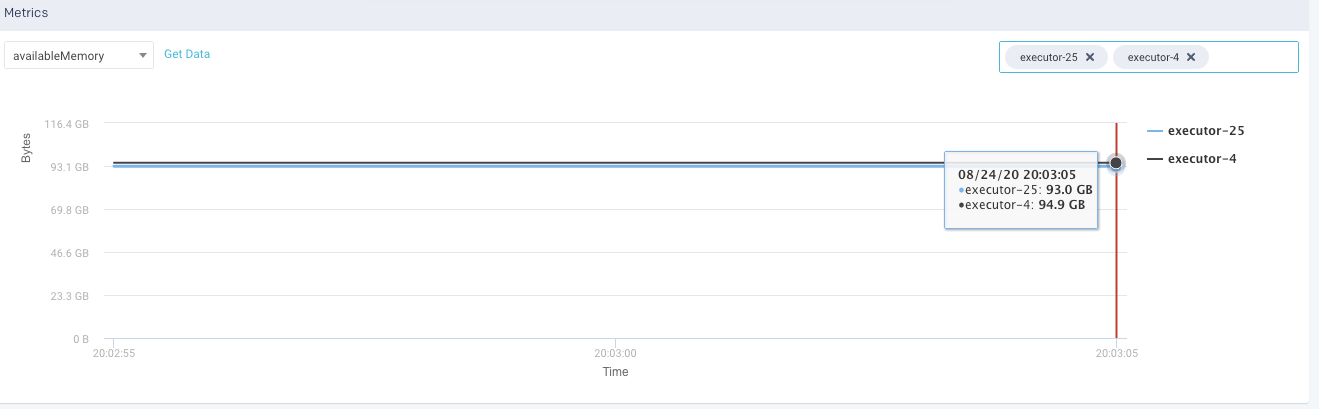
Metrics: The details of the following metrics of the application are plotted in a graph:
OS Memory
CPU Utilization
Java Memory
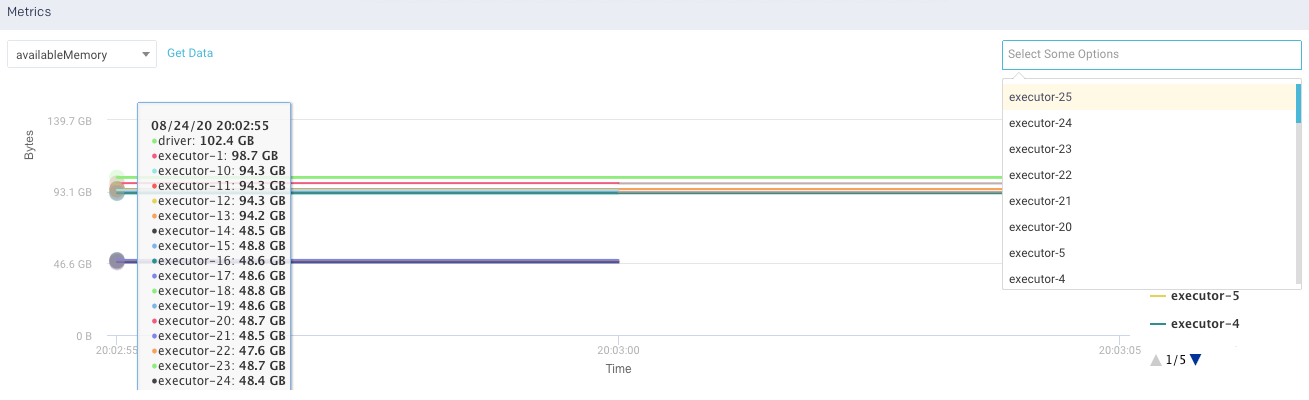
Click Get Data to get the raw data of the graph.
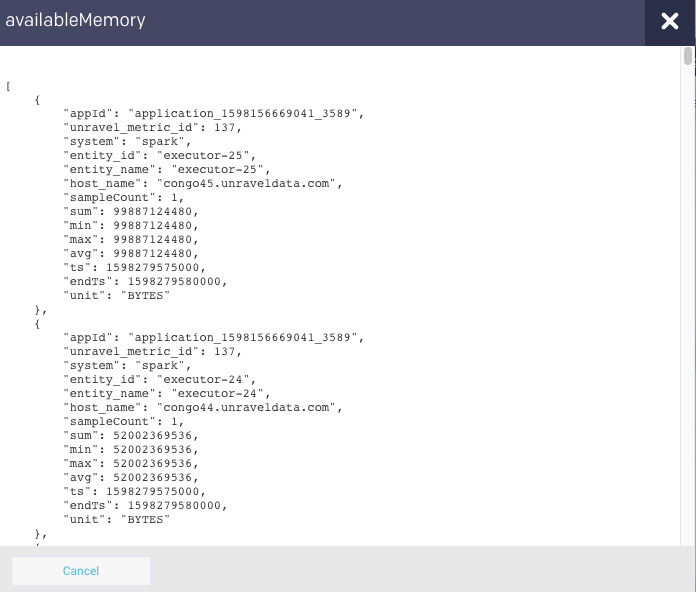
You can further drill down each metric.
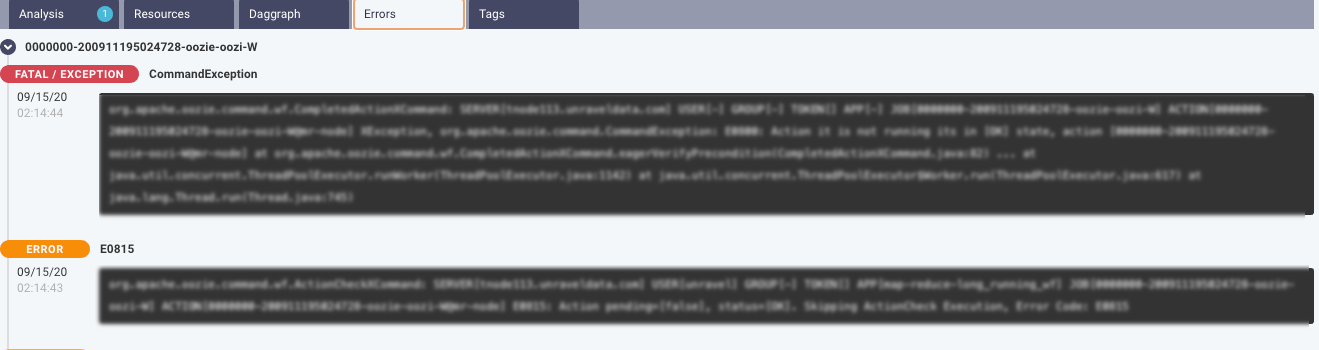
This tab lists the errors that were encountered during the application run.
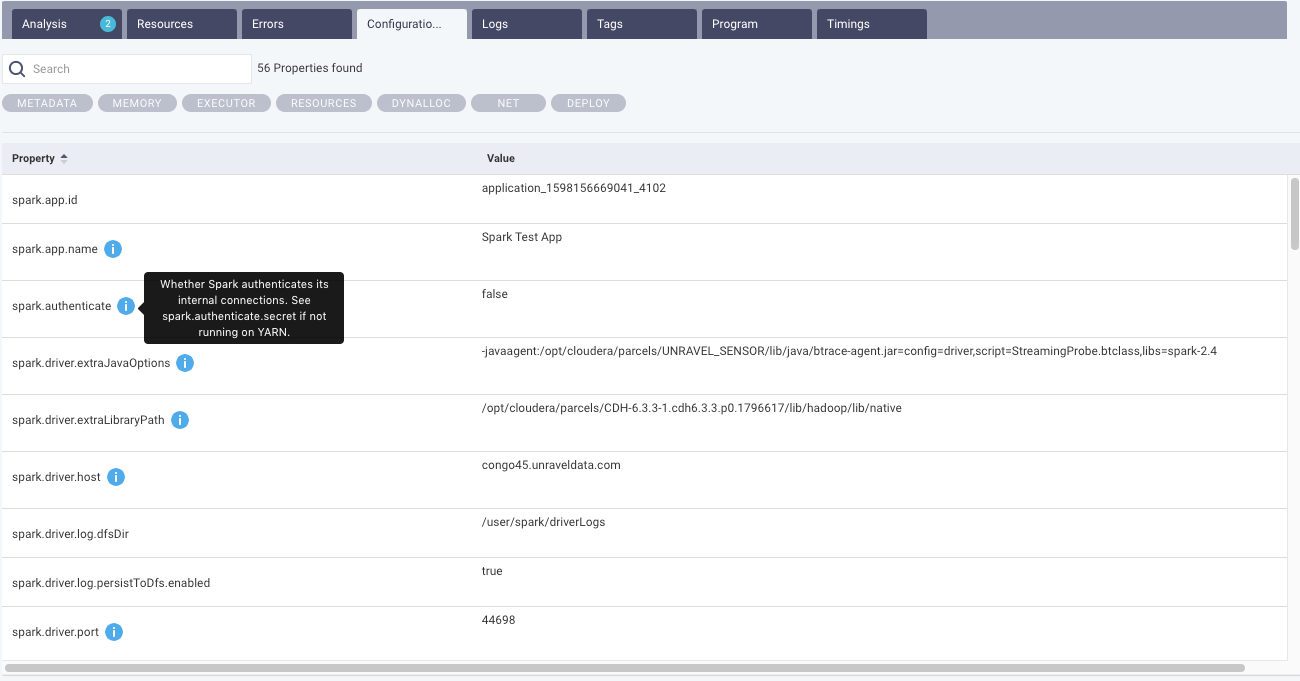
This tab lists all the configurations set for the selected Spark application. You can select the options to view the configurations from the top of the tab. Moreover, you can search for a specific configuration property. Hover over hover any property to view the corresponding definition of that property. By default, all the properties are shown. After you filter, you can click Reset to return to the default view.
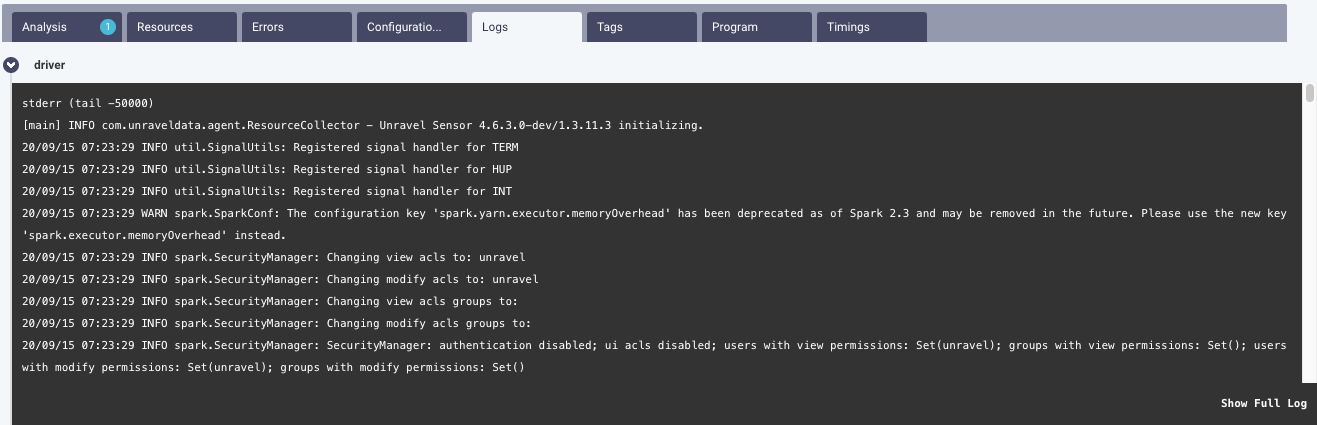
From this tab, you can view the executor and driver logs. Click Show Full Log, to view the complete log file.
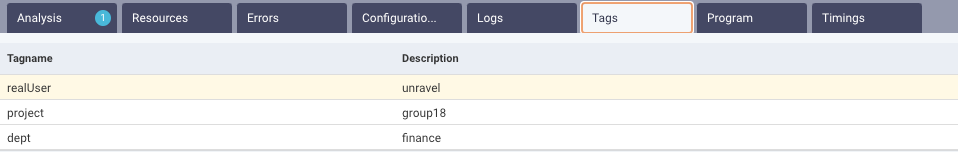
This tab lists the tags used in the Spark application. Refer to Tagging.
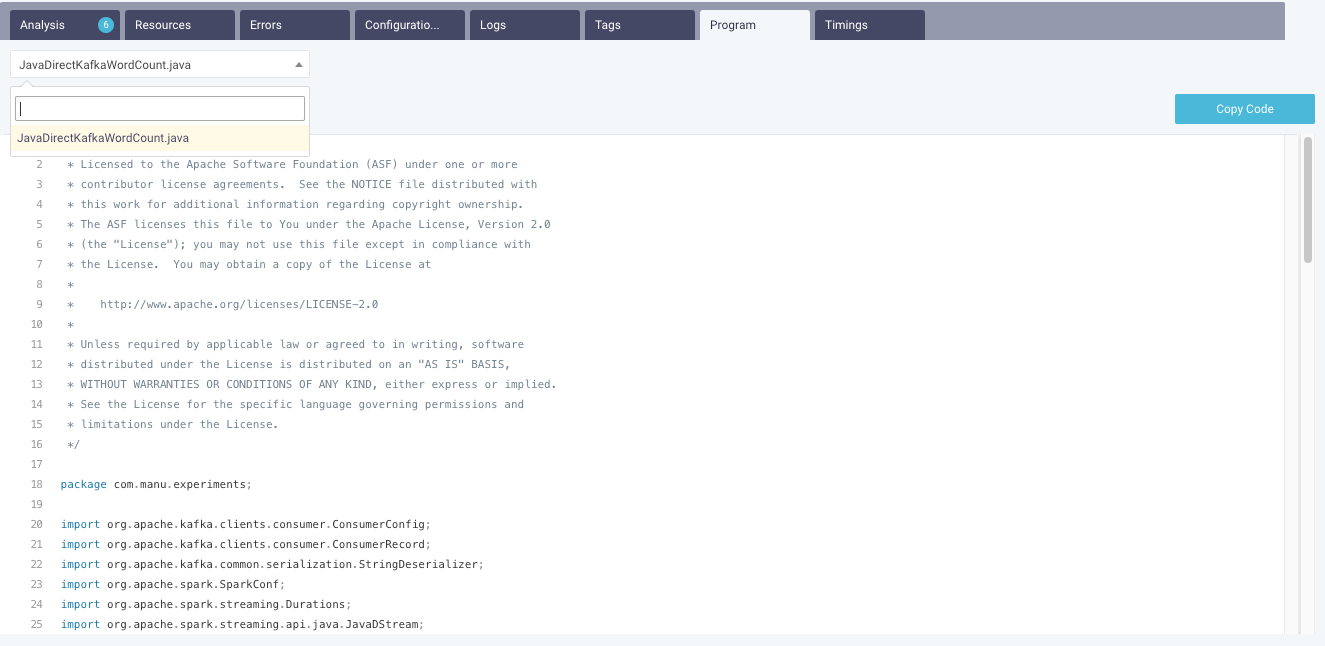
If the source code is submitted via spark-submit, then the code is displayed in this tab. From the drop-down, you can select a source code file and view the details. You can also copy the code.
The SQL tab lists query metrics such as query ID, input rows, output rows, duration, and stages. You can filter SQL queries by stage ID or query ID.
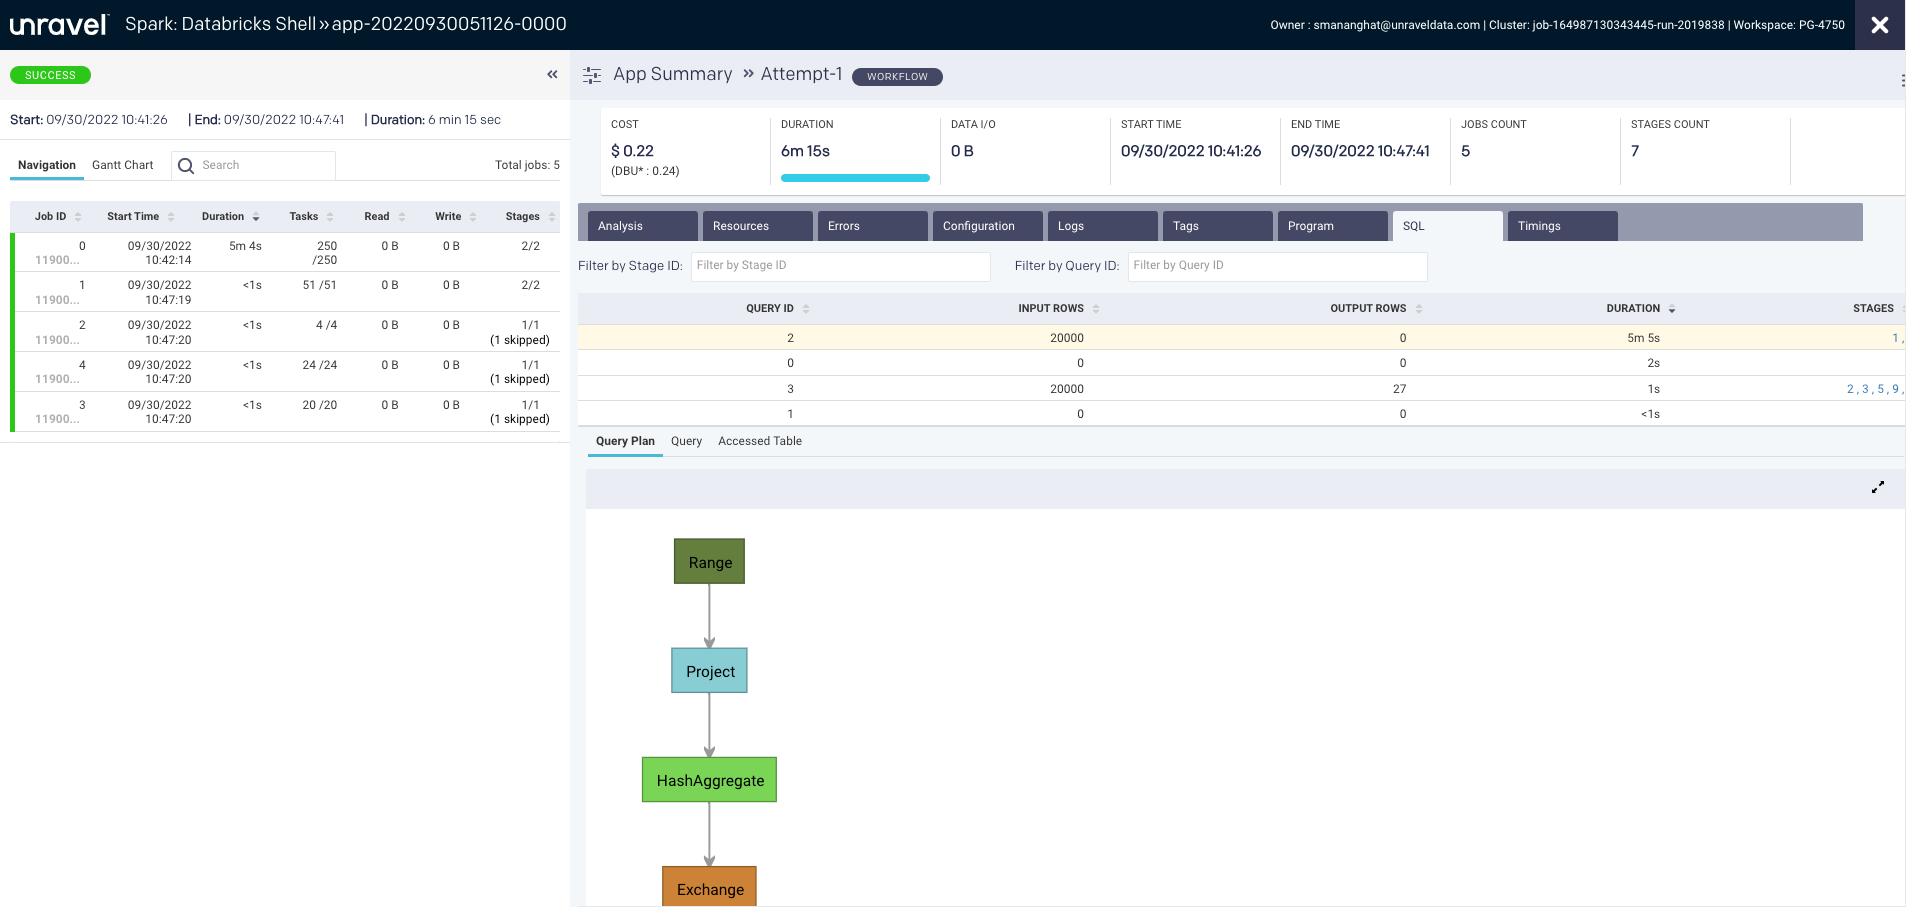
Based on your query selection, the following options are displayed:
Query Plan: Displays the graph that represents the physical plan of the query. The plan includes step-by-step instructions to run a query on the data.
Query: Shows the actual query text.
Accessed Table: Shows the input and output tables used in the selected query.
A Spark program is about multiple jobs that run in parallel on different executors. When we analyze a Spark program, it is essential to know the areas where the applications spend most of the time. The Timings tab in the Spark details page provides the details of the time spent by an application, that is, the application’s wall clock time, as well as the time spent by different tasks on each executor.
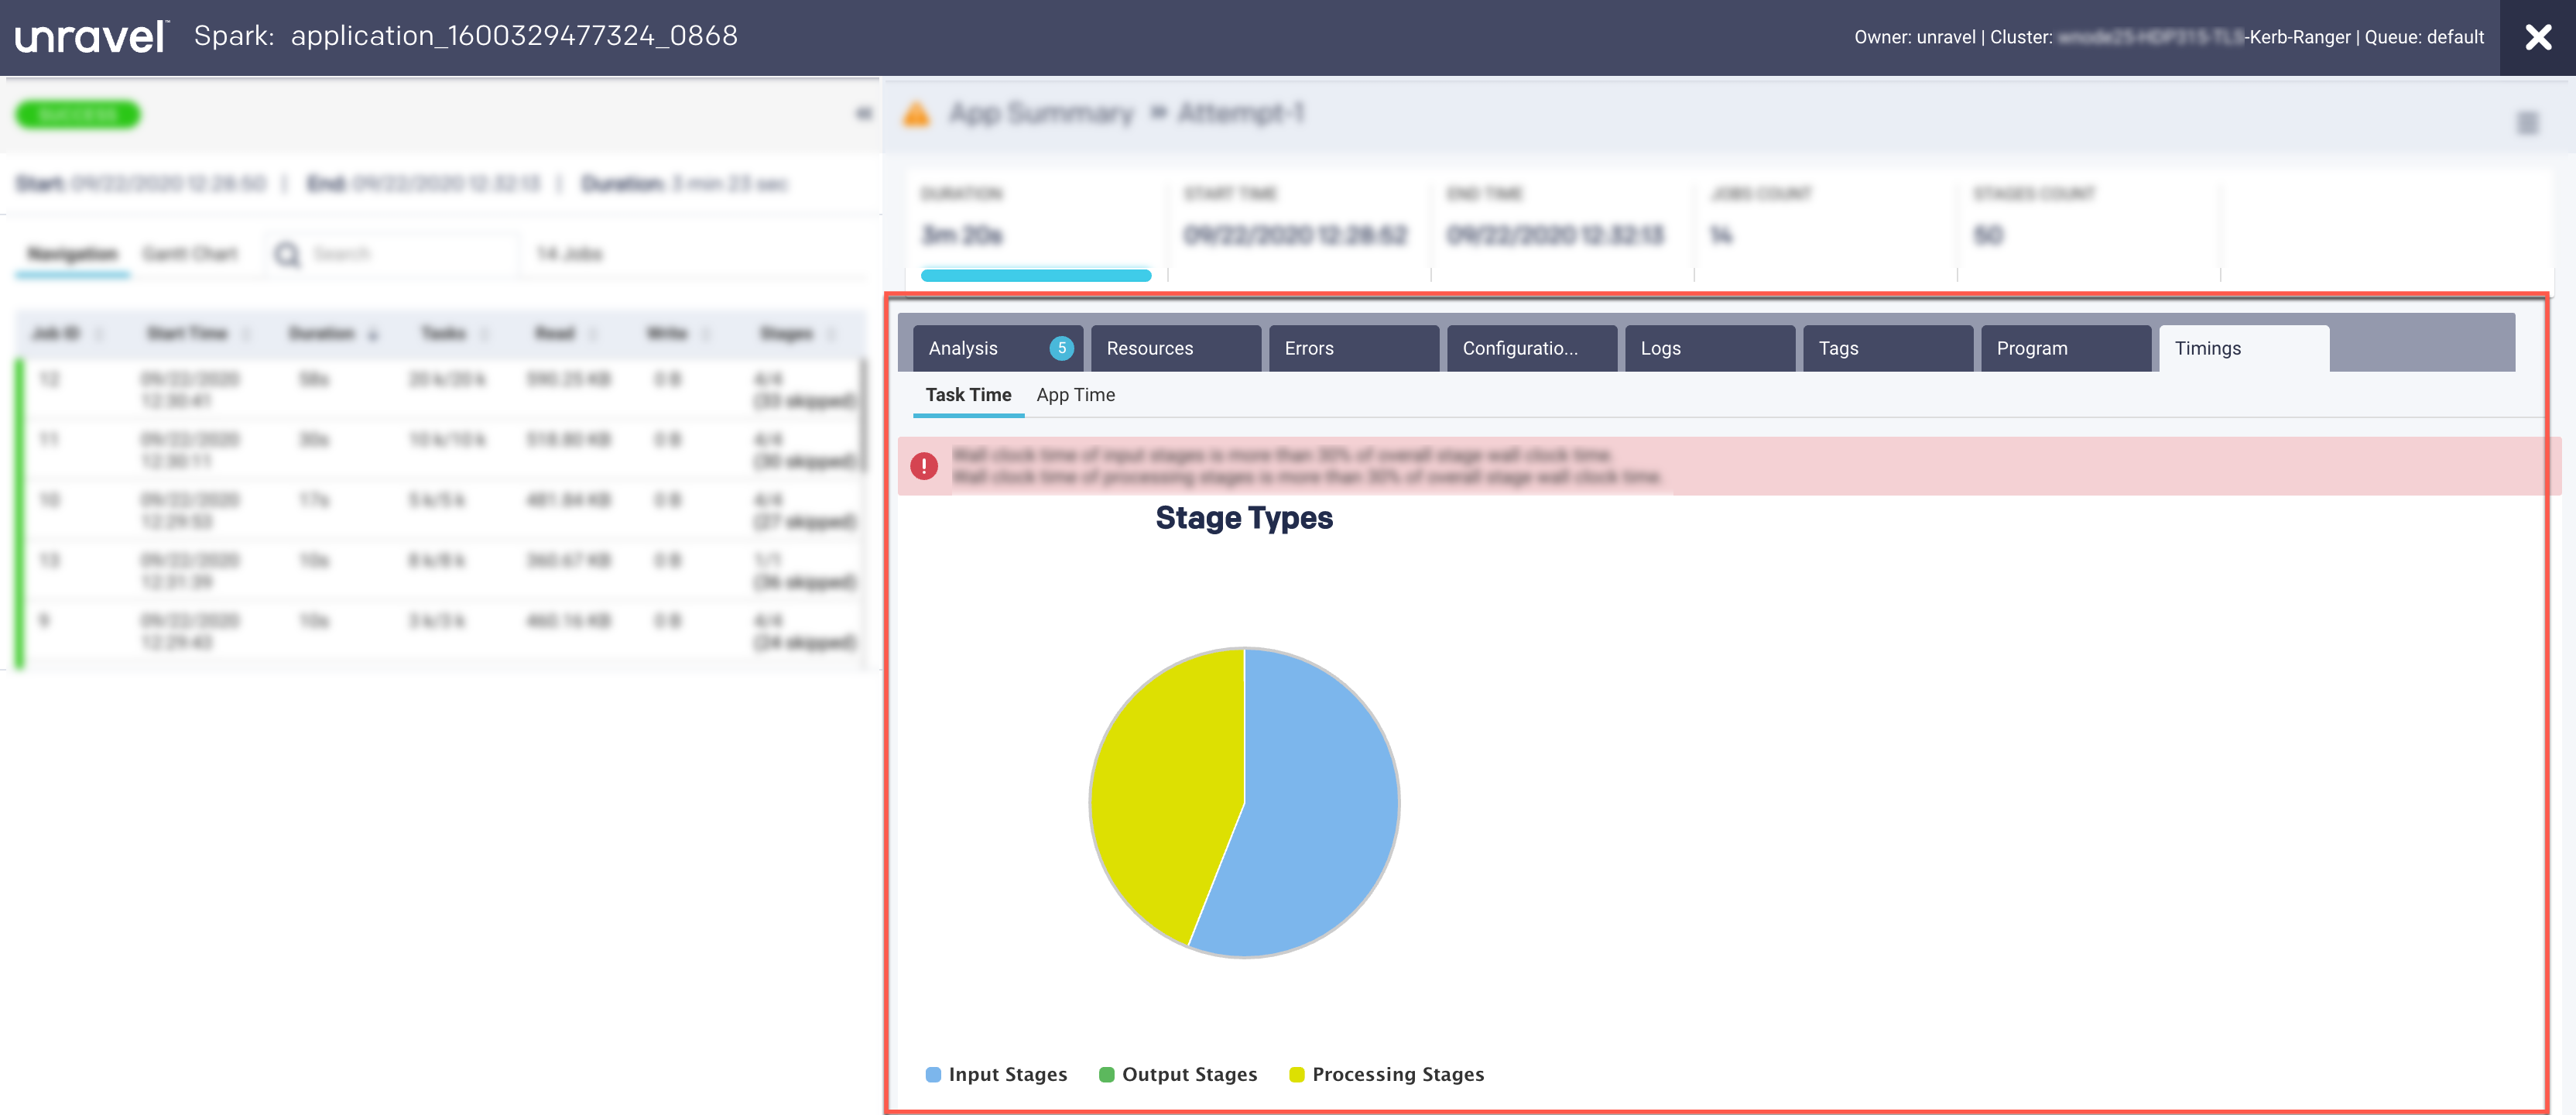
These are captured in the following views:
App Time
Task Time
This view provides a breakdown of the areas where the time on tasks was spent.
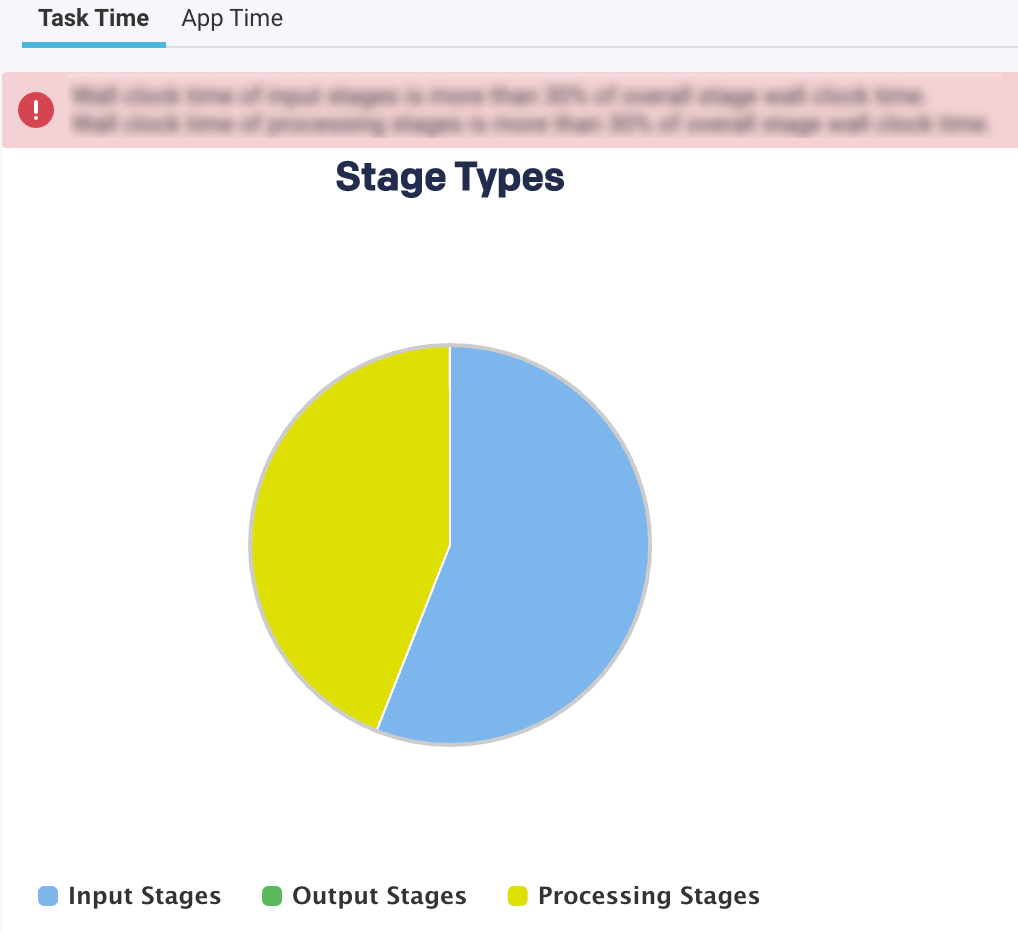
The top-level pie chart is divided into three types of stages:
Input Stages
This contains the total task duration of all the Spark stages, which read data from an external system, such as HDFS, S3, or JDBC.
Output Stages
This contains the total task duration of all the Spark stages, which write results to an external system such as HDFS, S3, or JDBC.
Processing Stages
This contains the total task duration of all the Spark stages, which are neither reading nor writing to external file systems.
Select any stages and click the corresponding pie chart to drill down further to view the time breakdown and other details.
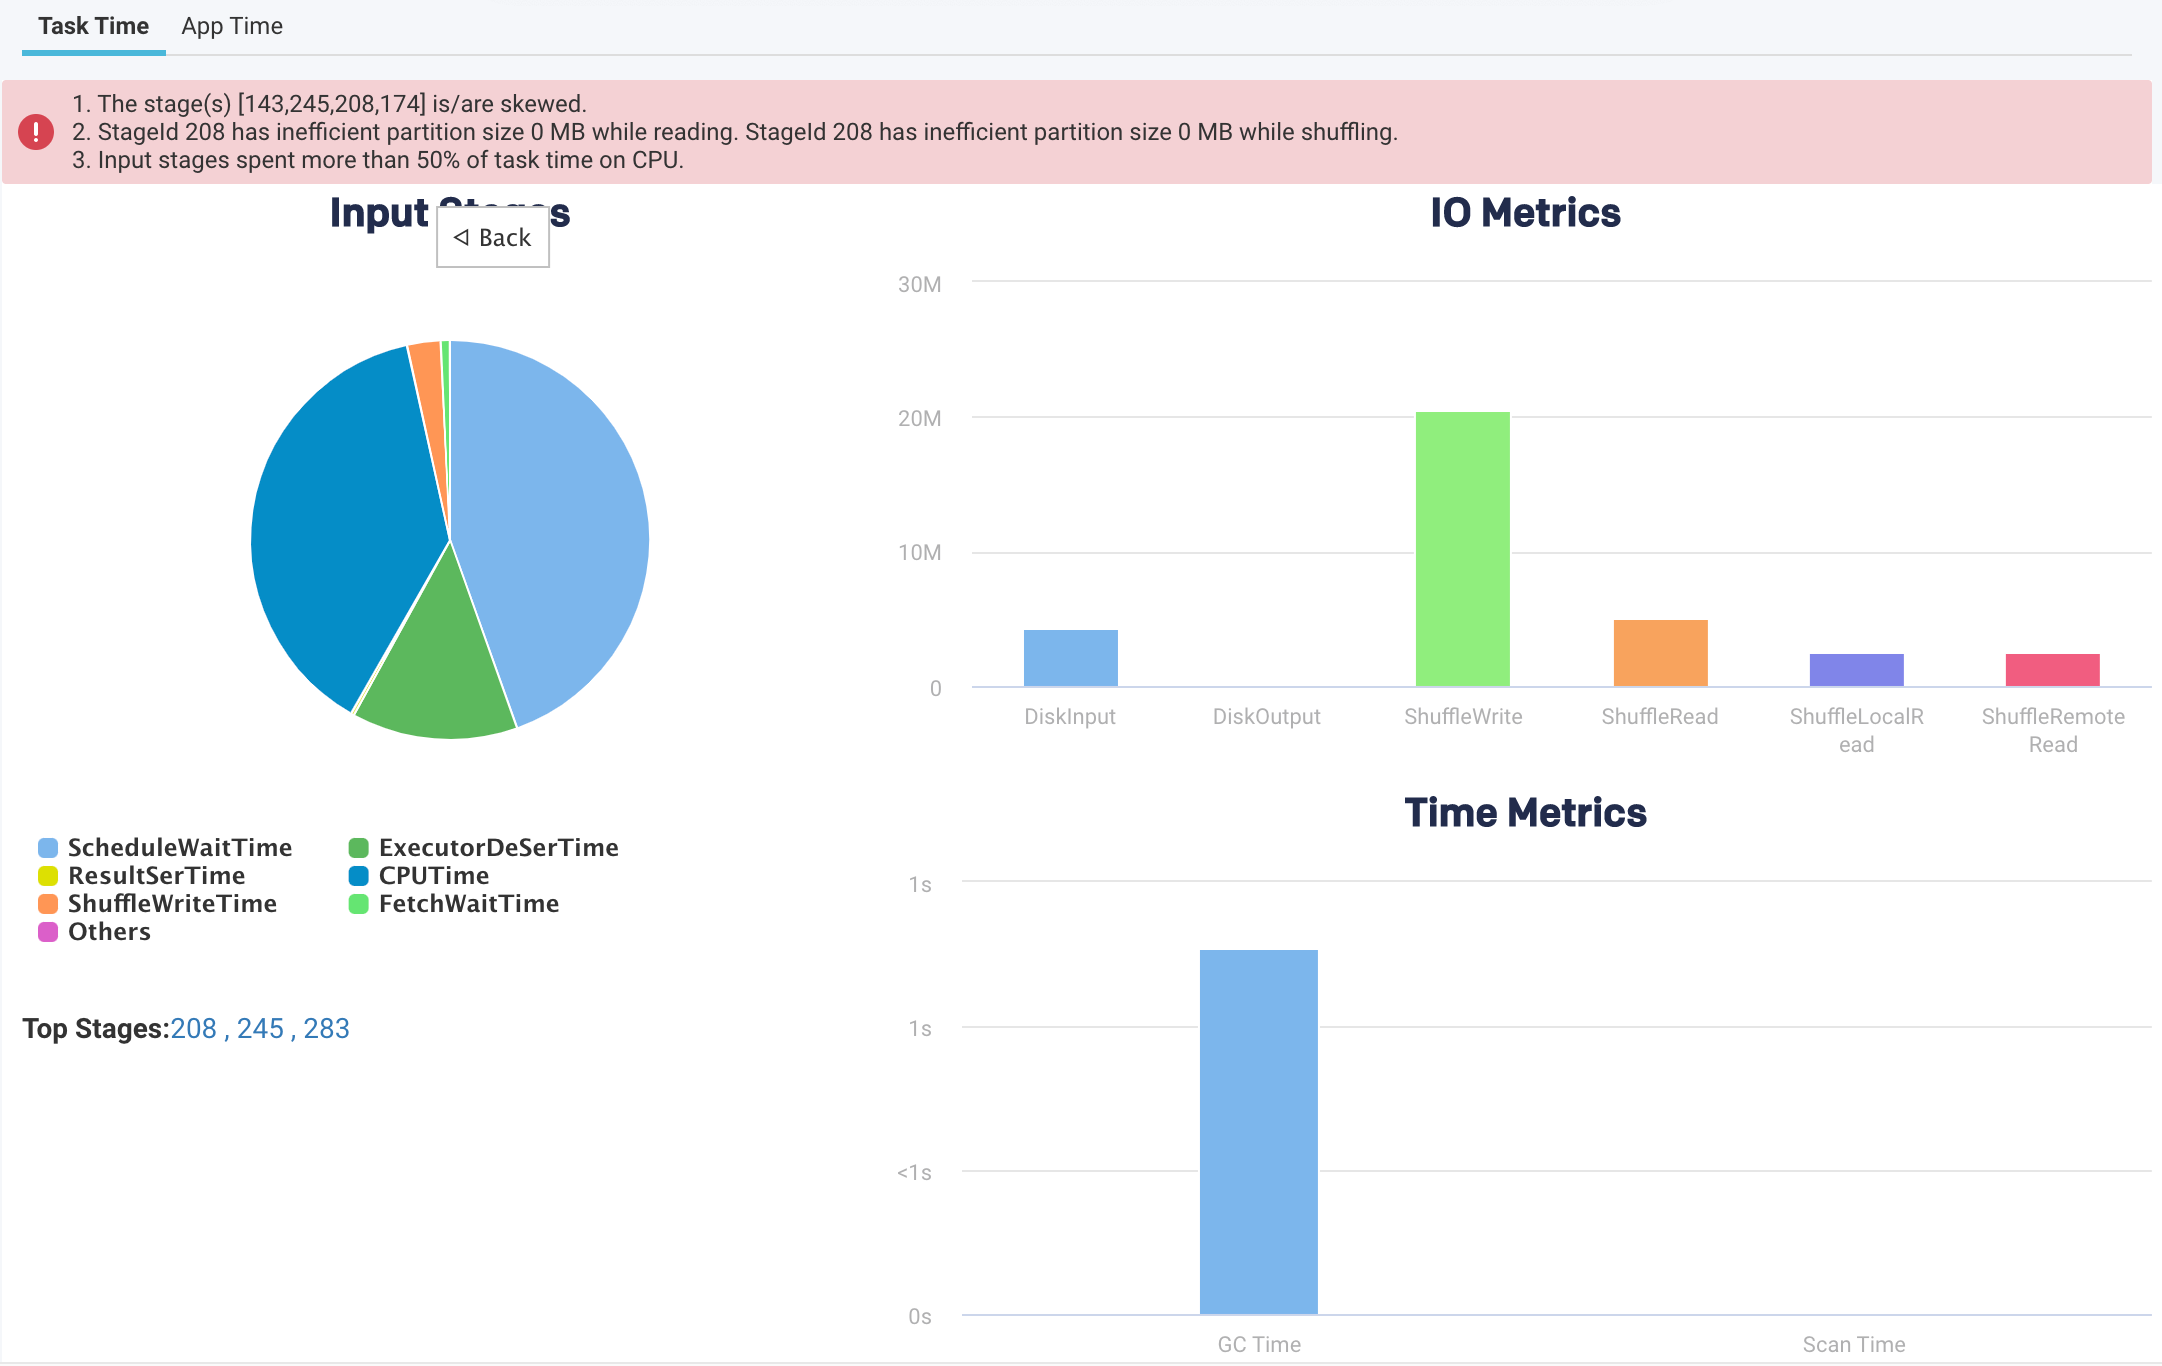
Pie-chart metrics
Item
Description
SchedulerDelay
Time to ship the task plus the time to ship the results back to the scheduler.
TaskDeserializationTime
Aggregated time spent on the executor to deserialize all tasks.
ResultSerializationTime
Aggregated time spent serializing the result of all tasks.
CPUTime
Aggregated CPU time that the executors spent to run all the tasks.
ShuffleWriteTime
An aggregated time that all the tasks spent blocking on the shuffle writes to disk or buffer cache.
ShuffleReadBlockTime
Aggregated time for all the tasks spent waiting for remote shuffle blocks.
Others
Other times all the tasks spent on components that could not be inferred.
Time metrics
Metric
Description
GC Time
The aggregated amount of time the JVM spent in garbage collection while executing all the tasks.
Scan Time
The aggregated amount of time spent reading data from files and tables.
IO Metrics
Metric
Description
DiskInput
Total data read by all the tasks.
DiskOutput
Total data written by all the tasks.
ShuffleWrite
Total shuffle data written by all the tasks
ShuffleRead
Total shuffle data read by all the tasks.
ShuffleLocalRead
Total shuffle data read, which were local to the executors.
ShuffleRemoteRead
Total shuffle data read, which were remote to the executors.
This view provides a breakdown of the application's wall clock time.
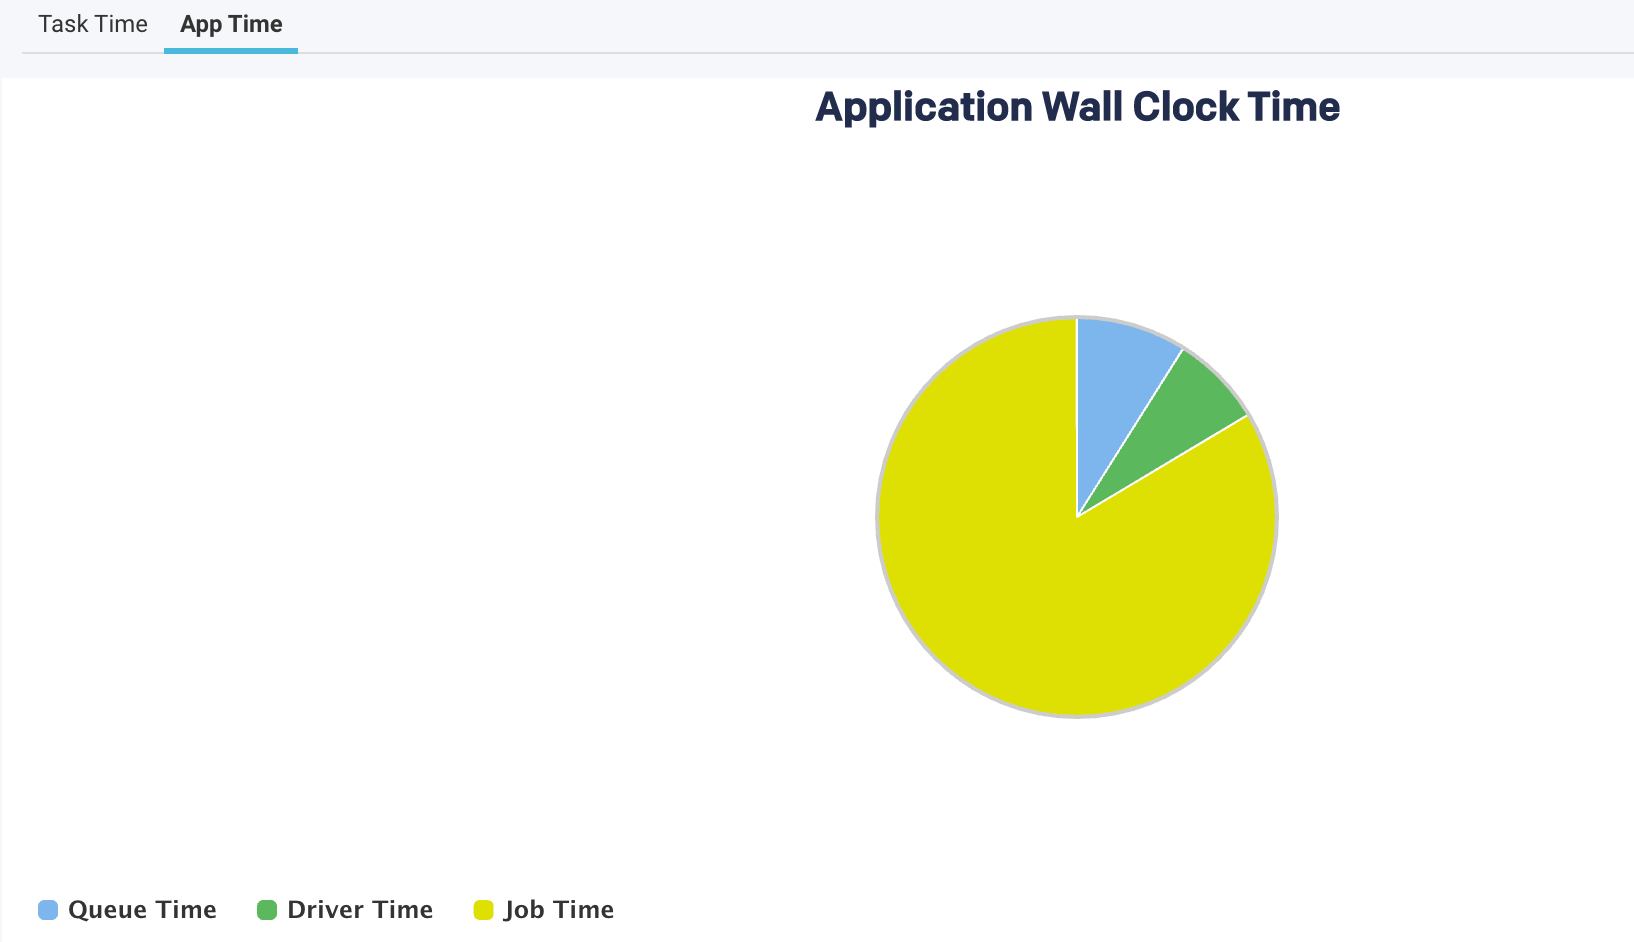
The following metrics are graphically represented in the App Time view:
Item | Description |
|---|---|
QueueTime | The time difference between the submission of an application and the start of the application. |
Driver Time | The time spent by the Spark applications exclusively on the driver. During this time, jobs are not executed. |
Job Time | The time when at least one job was running and thereby cluster resources are used. |
An orange bar on the top provides various hints regarding the application.
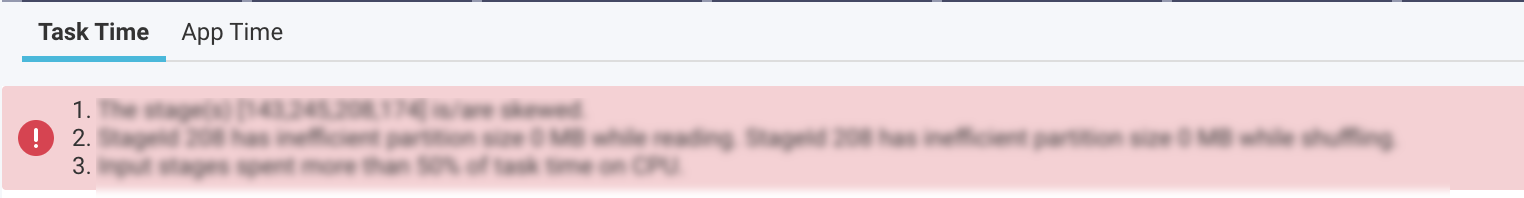
In addition to the above metrics, at the bottom, there is a section called Top Stages. Here the top three stages are listed that contribute the most to the stage types.
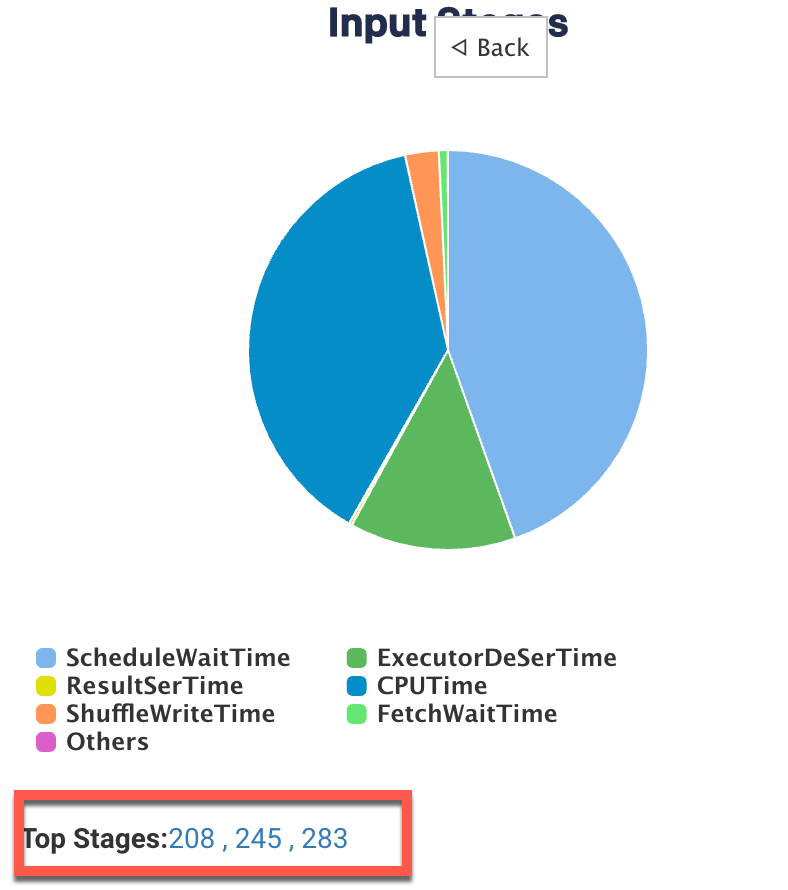
Click the link of a Top stage to view the stage-level details of the metrics. The metrics are the same as a stage type, only the values belong to a specific stage.