Sessions
Unravel Sessions is a feature that allows users to analyze multiple runs of an application and generate insights based on these runs, on demand. This is a deeper level of analysis compared to the insights seen on an application page, which is generated automatically as each application is processed by Unravel, but is only based on that single run.
From the Sessions tab, you can run a session to analyze your apps and tune its performance for either:
Efficiency: Decrease the app's time (end-to-end duration) and resources (shortening the app's duration is first priority).
Reliability: In attempting to reduce resources Unravel prioritizes memory allocation to ensure the app doesn't fail due to "out of memory" exceptions.
Note
MySQL and On-Demand package is required for the Sessions report. From v4.6.2.0 version onwards, the On-Demand package is automatically installed along with Unravel.
Unravel already offers insights and recommendations on an app's run. However, when you use a session, you can:
Direct the tuning goal.
Provide multiple runs of an app to provide a larger data pool for Unravel to analyze.
See the effects, both positive and negative, that the tuning has on an app's run.
Compare the apps' metadata, KPIs, and configurations.
Repeatedly tune the app until Unravel has no more recommendations.
Your session is saved and can be run again, e.g., new runs added, cluster configuration changed.
You can tune the following types of apps:
Spark
Hive on MapReduce
Alternatively, you can use Sessions as a tool to compare two runs of the same app.
The Sessions tab opens displaying all the current sessions sorted on Sessions Name in ascending order in the following columns:

Column | Description |
|---|---|
Name/ID | Name or ID of the session. |
Start time | The time when the most recent app was run. |
Apps | Number of apps in a session. |
Duration Trend | The trends in duration of the apps. |
I/O Trend | The trends in the I/O of the apps. |
Vcore Trend | The trends in the usage of the CPU resources in a session. |
Memory Trend | The trends of the memory allocated to the application in a session. |
Cluster ID | ID of the cluster where the session is run. |
Actions | Click Click |
You can search for a session by name. Enter the string in the search box; any session name matching or containing the string will be displayed. You can sort the table on Session Name, Start Time, and Cluster.
Creating a new session
Go to Jobs > Sessions
Click New Session.
In the Add Session dialog box, add the following details:
Fields
Description
Session Name
Name of the session.
Application Type
Specify the type of application. Currently only Spark, Hive on Mapreduce apps are supported.
Tuning
Set a tuning goal; Efficiency or Reliability goal
App Ids
Specify the IDs of the apps that you want to included in a session.
Cluster ID
Specify the ID of the cluster where you want to run the session.
Click Save. The session is created and displayed in the Sessions list.
Editing a session
Go to Jobs > Sessions
From the Sessions list, click
 corresponding to the session that you want to edit.
In the Edit Session dialog box, edit any of the following details:
Fields
Description
Session Name
Name of the session.
App Ids
Specify the IDs of the apps that you want to included in a session.
Click Save.
Deleting a session
Go to Jobs > Sessions
From the Sessions list, click
 corresponding to the session that you want to delete.
Sessions details page
The Sessions details page provides a summary of the selected session. The following details are noted on top of the page:

Item | Description |
|---|---|
1 | Session ID. You can click the copy icon to copy the session ID. |
2 | Download the JSON. |
3 | Displays the details of the user, cluster, and |
4 | A drop-down to select any of the following metrics to update the graph
The details of the Duration, IO, Vcore hours can be viewed when you hover over the bar, in case of a single app, or the trendline, in case of multiple apps. |
In the left panel, the applications running in the session are displayed. You can click  , to download the application's information in a CSV format. On the right panel, in the Sessions Summary section, the following tabs are displayed:
Analysis
This section displays all the recommendations for the current session. Initially, this section is empty. You must click the Get Latest Recommendations tab and the recommendations are listed. Also, after you edit a session you must click the Get Latest Recommendations tab to get the recommendations.

Progress
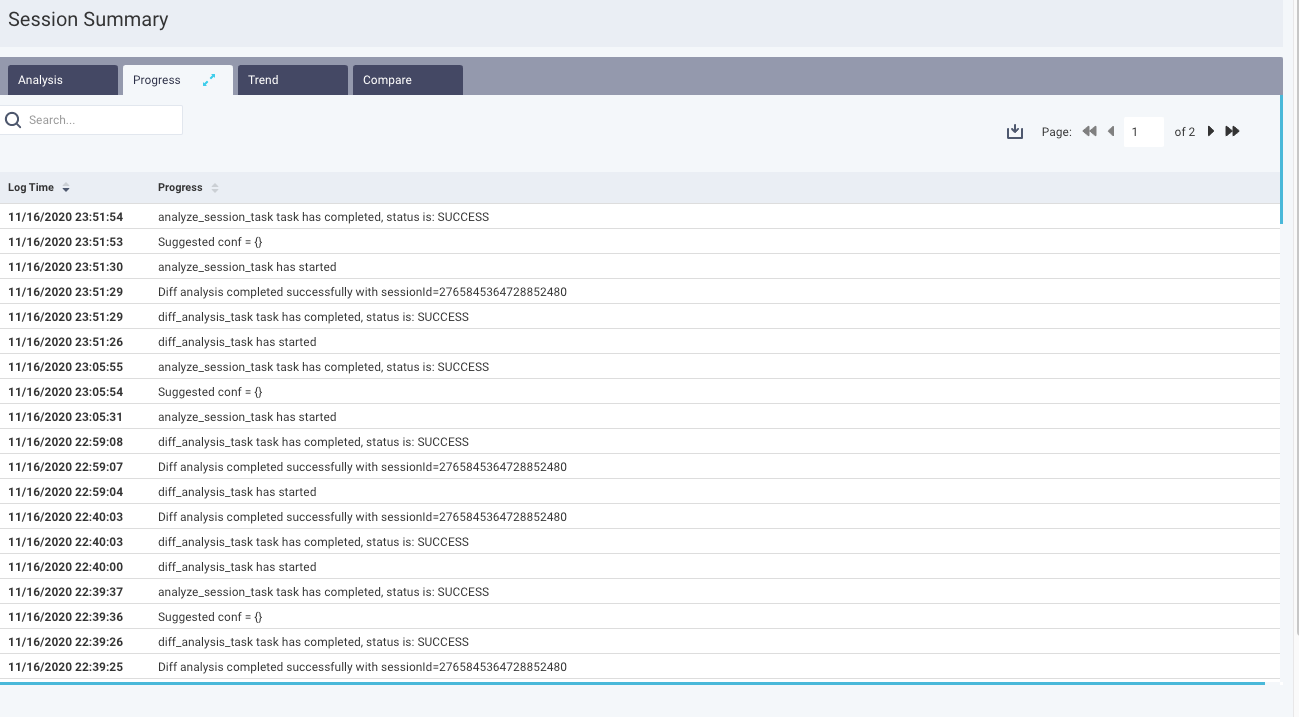
This section displays the logs for all the tasks that are executed in the current session.

Trend
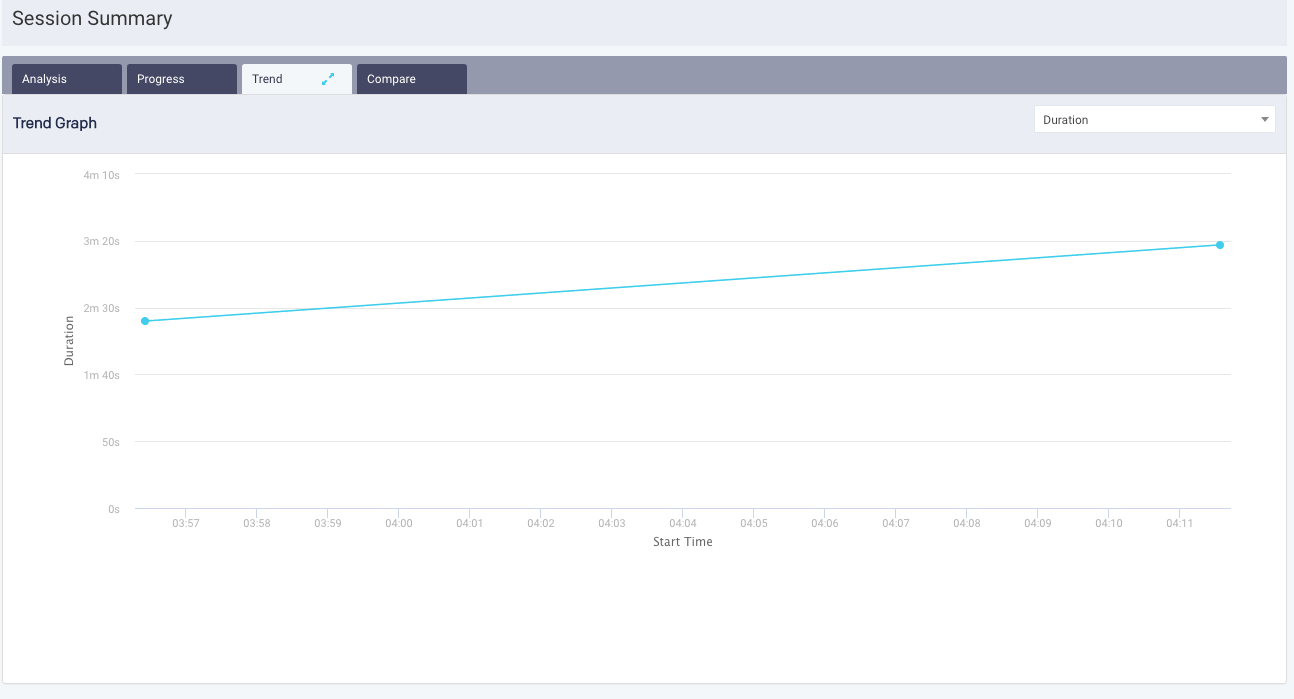
In this section, any of the KPIs can be selected (Duration, I/O, Vcore Hours, Memory Hours) and plotted in a trendline over a period.

Compare
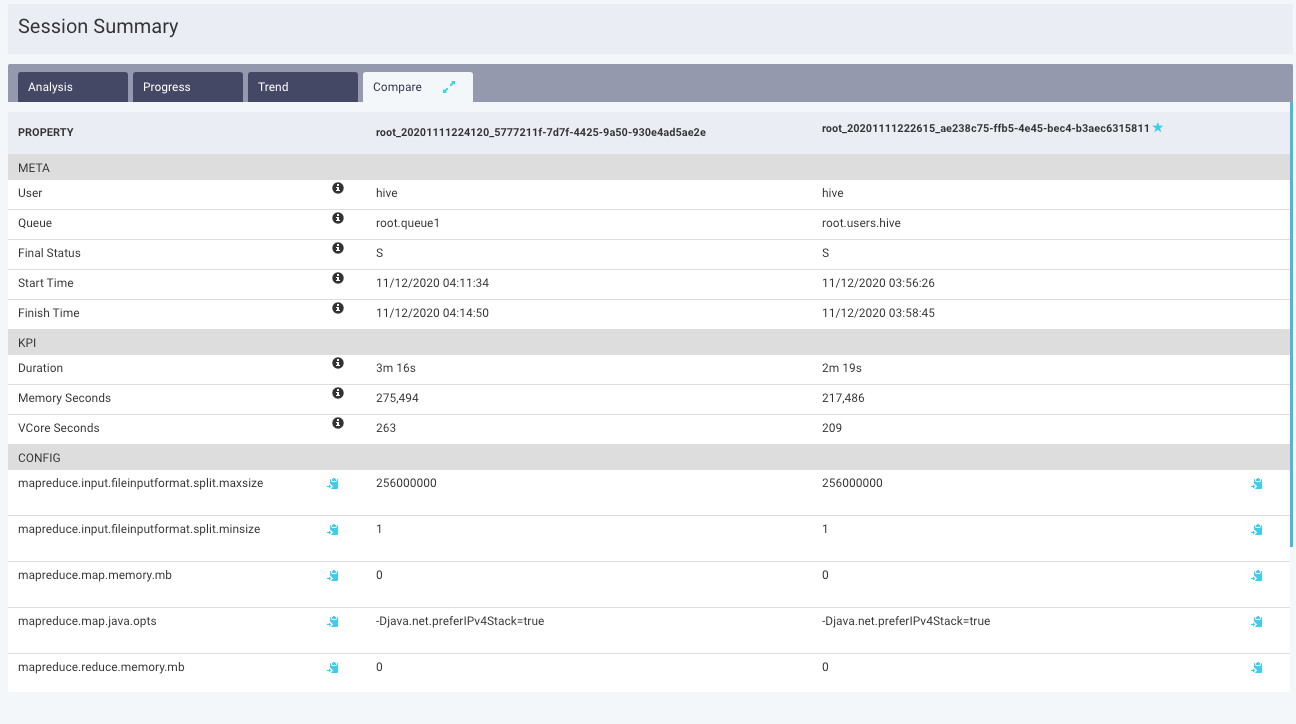
In this section, you can compare the metadata, KPIs, and configurations between two apps in a session. You must select the apps from the left panel. The recommended setting is marked with a star.
