Elasticsearch
This tab lets you monitor various metrics in the Elasticsearch clusters. You can select a cluster and the period range to monitor the metrics for each cluster, each node in the cluster, as well as for the corresponding indices. The monitoring of the Elasticsearch clusters can be enabled by configuring the Elasticsearch properties in the unravel.properties file.
Enable monitoring for Elasticsearch clusters
Set the properties for Elasticsearch. Refer to ELK configuration for the method to set the properties.
View Elasticsearch cluster metrics
By default, the cluster metrics are summarized and shown for all the nodes in the cluster for the past one hour. To view the Elasticsearch cluster KPIs for a specific time period:
Go to Clusters > Elasticsearch.
Select a cluster from the Cluster drop-down.
Optionally select a period range.
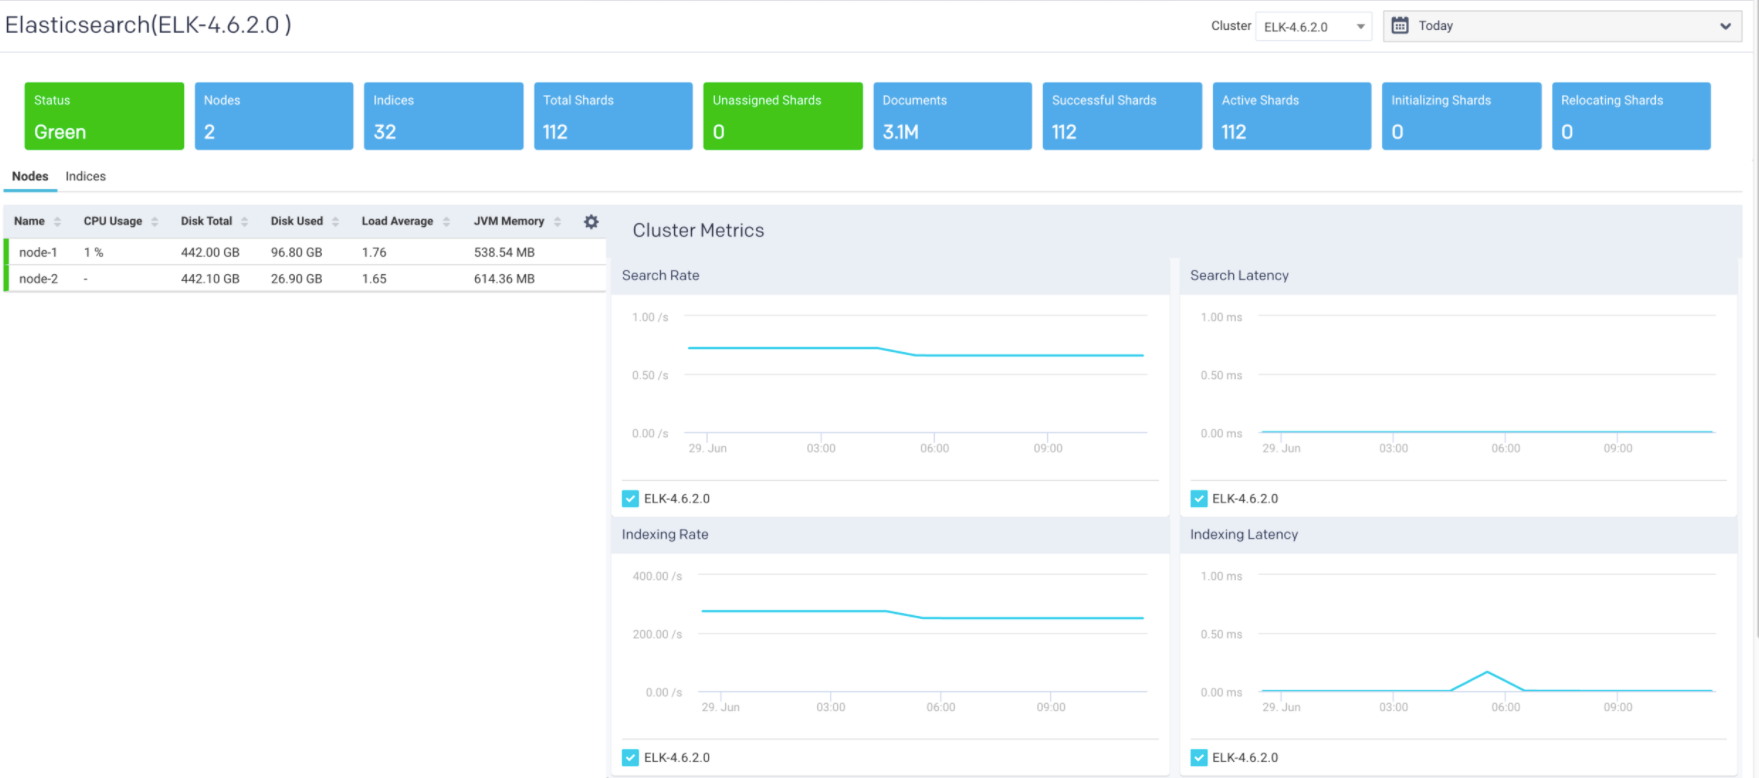
The following Elasticsearch KPIs of a cluster are displayed on top of the page:
Cluster Metrics Metrics
Description
Status
Status of the cluster.
Nodes
Total number of nodes in the cluster.
Indices
Total count of indices in the cluster.
Total Shards
Total number of shards in the cluster.
Unassigned Shards
Total number of unassigned shards in the cluster.
Documents
Total count of indexed documents in the cluster.
Successful Shards
Total number of successful shards in the cluster.
Active Shards
Total number of active shards in the cluster.
Initializing Shards
Number of initializing shards in the cluster.
Relocating Shards
Number of relocating shards in the cluster.
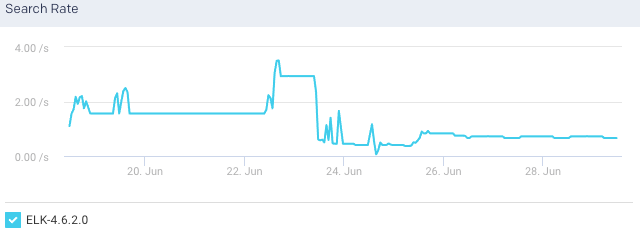
Cluster Graphs The following graphs plot various Elasticsearch KPIs for a selected cluster in a specified time range:
Search Rate: This graph plots the rate at which documents are queried in Elasticsearch for the selected cluster.
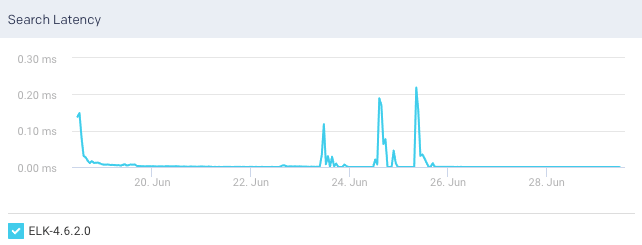
Search Latency: This graph plots the time taken to execute the search request for the selected cluster.
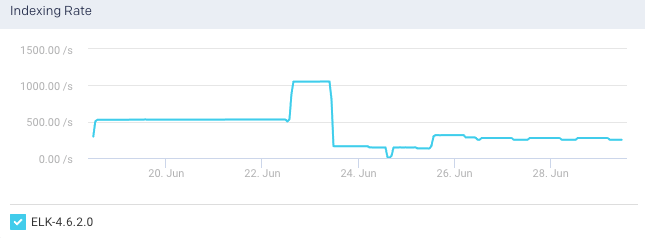
Indexing Rate: This graph plots the rate at which documents are indexed in the selected cluster.
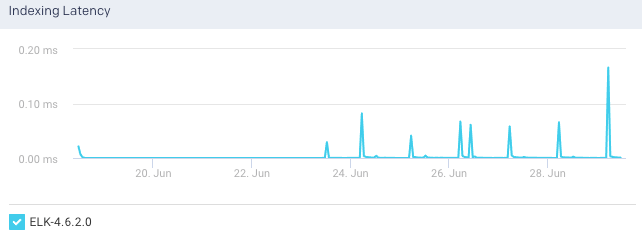
Indexing Latency: This graph plots the time taken to index the documents in the selected cluster.
View Elasticsearch node metrics
You can monitor the Elasticsearch metrics at the node level. To view the metric details of a specific node in an Elasticsearch cluster:
Go to Clusters > Elasticsearch.
Select a cluster from the Cluster drop-down.
Optionally select a period range.
Click the Nodes tab. All the nodes in the cluster and the corresponding details are listed in the Nodes tab.
Select a node. The node details are displayed in a table. The node metrics are displayed on the upper right side.
You can use the toggle button
 to sort the columns, of the node details table, in an ascending and descending order. You can also click the
  icon to set the columns to be displayed in the Nodes tab.
Node Details The following details are displayed for each node:
Column
Description
Name
Name of the node.
CPU usage
Total CPU usage for the node.
Disk Total
Total disk space available for the Elasticsearch node.
Disk Used
Total disk space used by the Elasticsearch node.
Load Average
The load average of a CPU in an operating system.
Jvm Memory
JVM heap memory used.
Node Metrics The following node metrics are displayed for the selected node:
Metrics
Description
Documents
The total number of indexed documents in the node.
Free Disk Space
The available disk space in the node.
Heap Percent
Percentage of heap memory used.
Flush Latency
Time taken to flush the indices in a node.
Flush Rate
The rate at which the indices are flushed.
CPU
The CPU utilization by the operating system in percentage.
RAM
RAM utilization in percentage.
Total Read Operations
Total amount of read operations processed.
Total write Operations
Total amount of write operations processed.
Uptime
Time since the node is up and active.
Node Graphs The following graphs plot various Elasticsearch KPIs for a selected node in a specified time range:
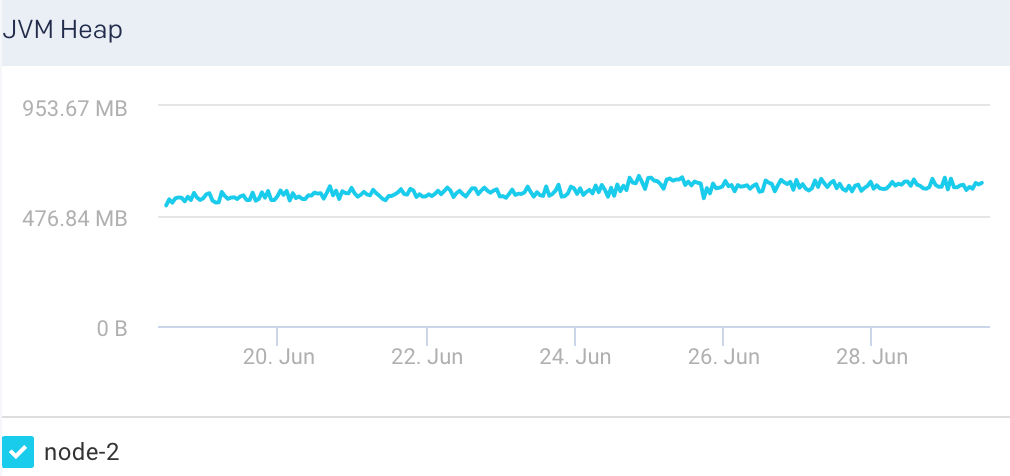
JVM Heap: This graph plots the total heap used by Elasticsearch in the JVM for a selected node.
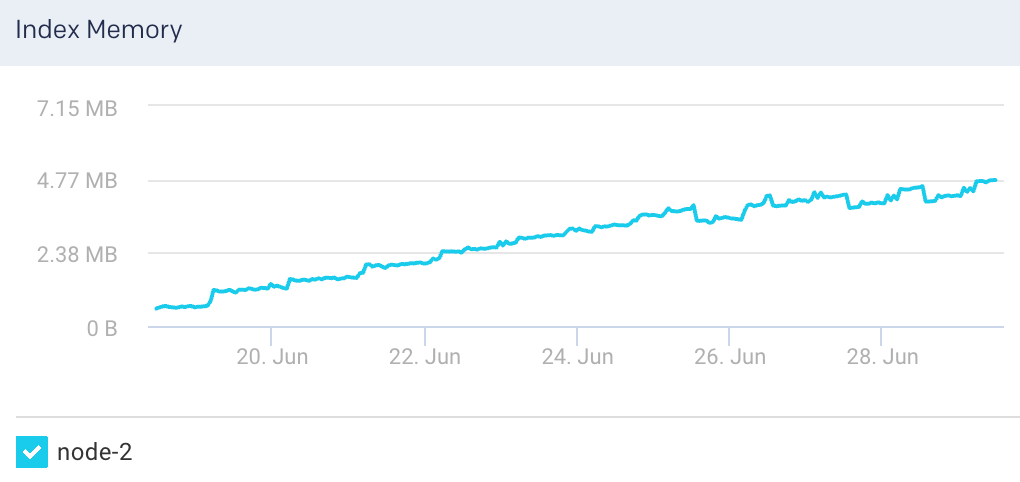
Index Memory: This graph plots the heap memory used for indexing in a selected node.
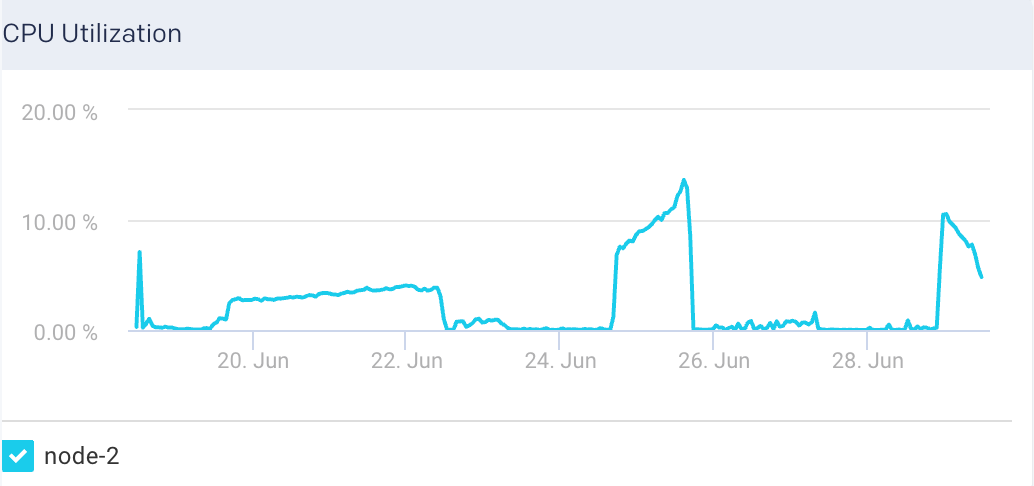
CPU Utilization: This graph plots the percentage of CPU usage for the Elasticsearch process in the selected node.
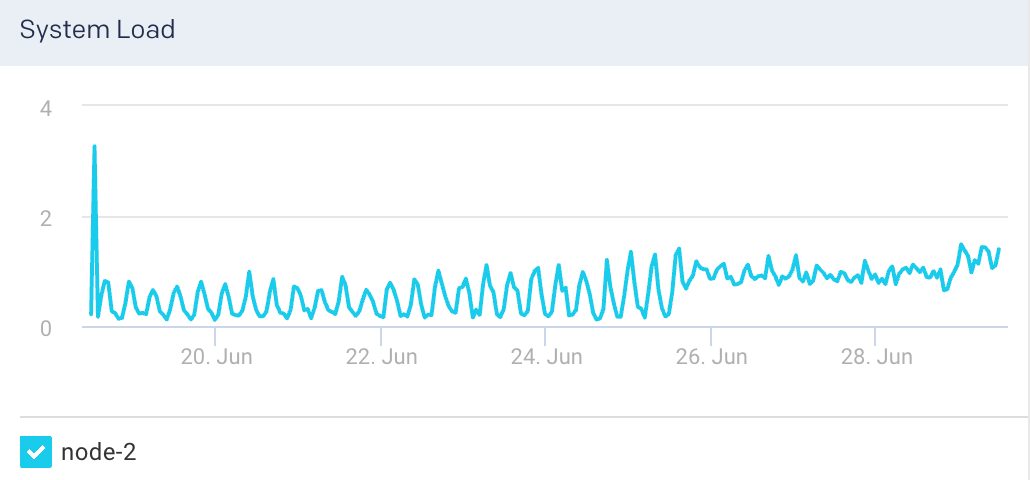
System Load: The graph plots the load average per minute for the selected node.
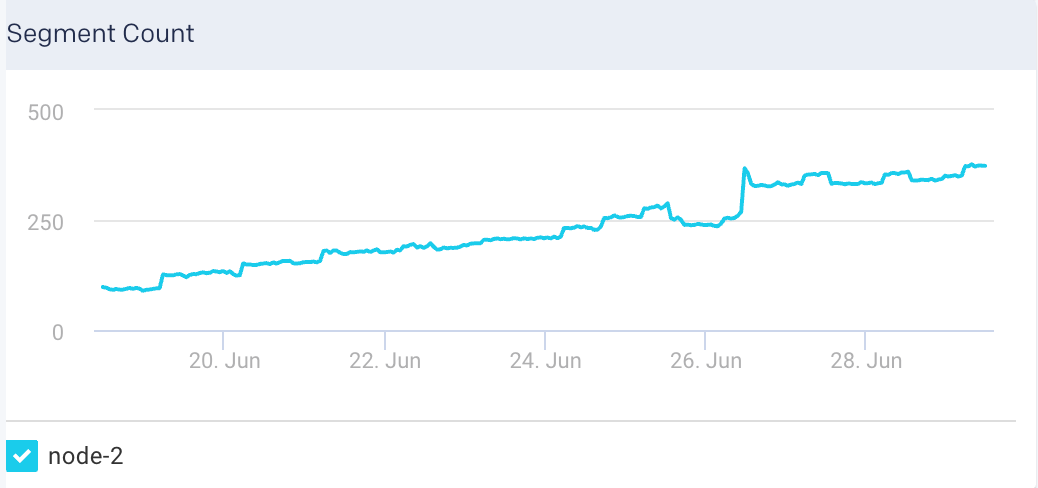
Segment Count: This graph plots the maximum segment count for the selected node.
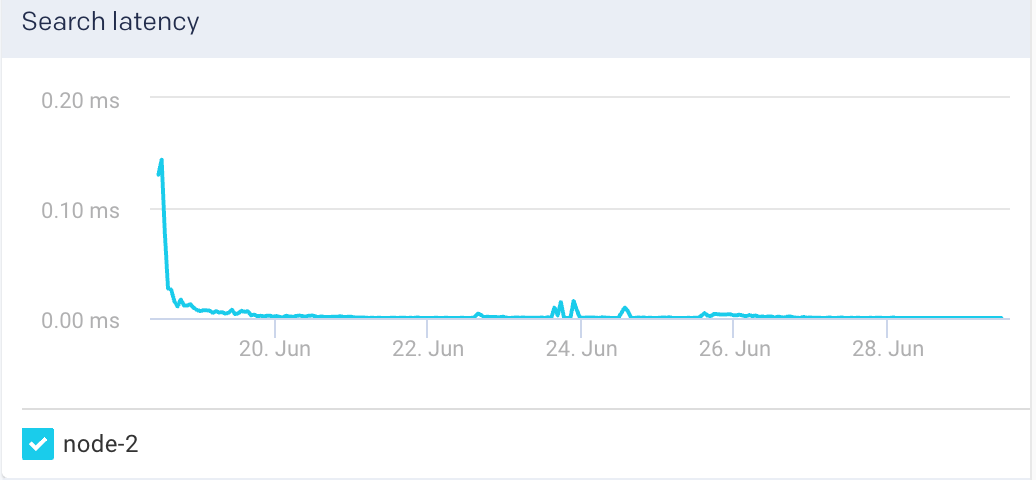
Search Latency: This graph plots the average search latency for the selected node.
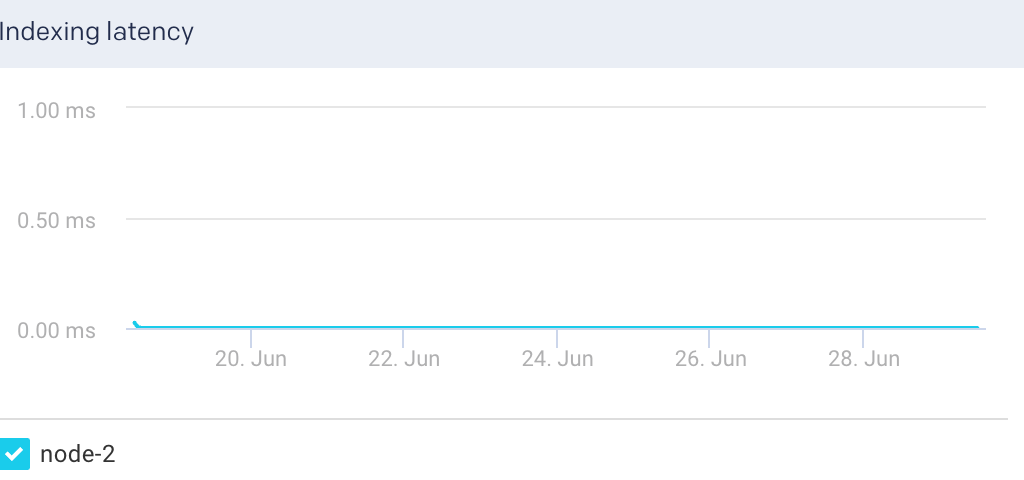
Indexing Latency: This graph plots the average latency for indexing documents in the selected node.
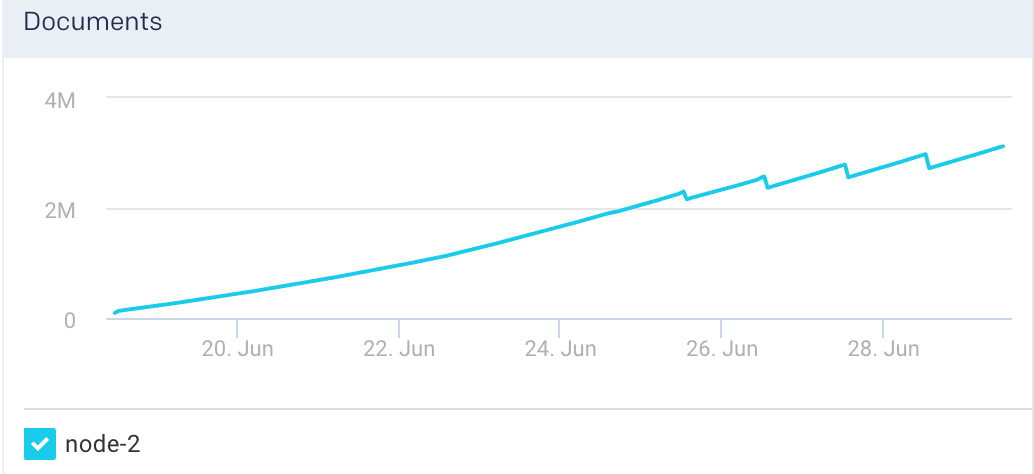
Documents: This graph plots the count of indexed documents for the selected node.
View Elasticsearch indices metrics
To view the metric details of an index in an Elasticsearch cluster:
Go to Clusters > Elasticsearch.
Select a cluster from the Cluster drop-down.
Select a period range.
Click the Indices tab. All the indices in the cluster are listed in the Indices tab.
Select an index. The index details are displayed in a table. The index metrics are displayed on the upper right side.
You can use the toggle button
to sort the columns, of the index details table, in an ascending and descending order. You can also click the icon to set the columns to be displayed in the Indices tab.Indices Details The following details are displayed for each of the indices:
Column
Description
Name
Name of the index.
Docs
Number of indexed documents.
Store Size
Storage size of the indexed documents.
Search Rate
Number of search requests being executed.
Active Shards
Total number of active shards in an index.
Unassigned Shards
Total number of unassigned shards in an index.
Index Metrics The following metrics are displayed for the selected index:
Metrics
Description
Flush Total
Total number of flushed indices.
Flushed Latency
Time taken to flush an index.
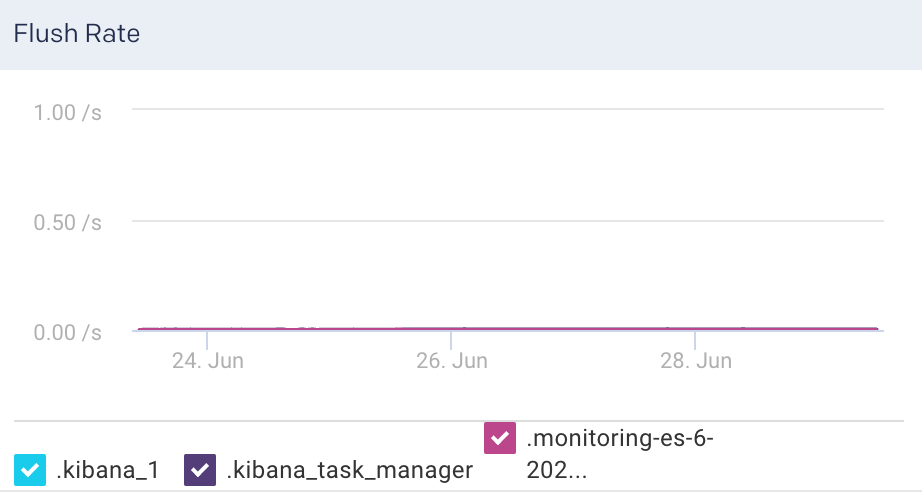
Flush Rate
The rate at which indices are flushed.
Segments count
Count of segments.
The following graphs represent various Elasticsearch KPIs for a selected index in a specified time range. By default, all the indices are checked in the graphs. You can select single or multiple indices in the graph.
Indices Graphs The following graphs plots various metrics for the selected indices in a specified time range:
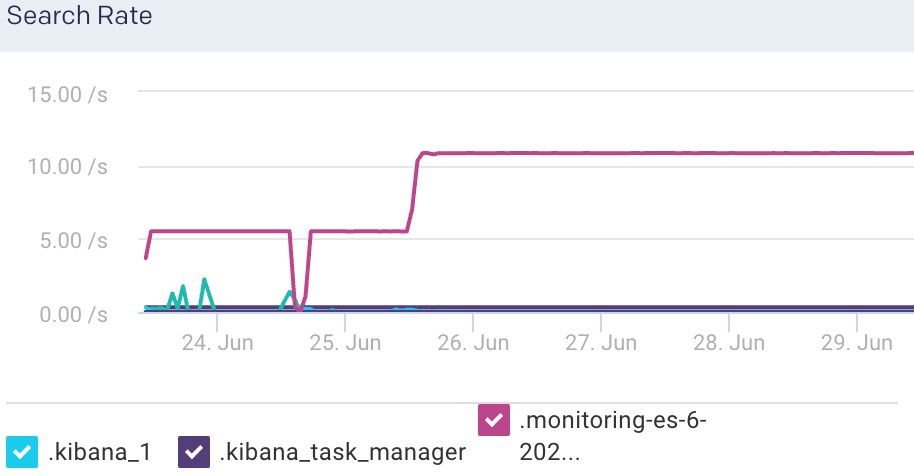
Search Rate: This graph plots the number of search requests that are being executed in Elasticsearch.
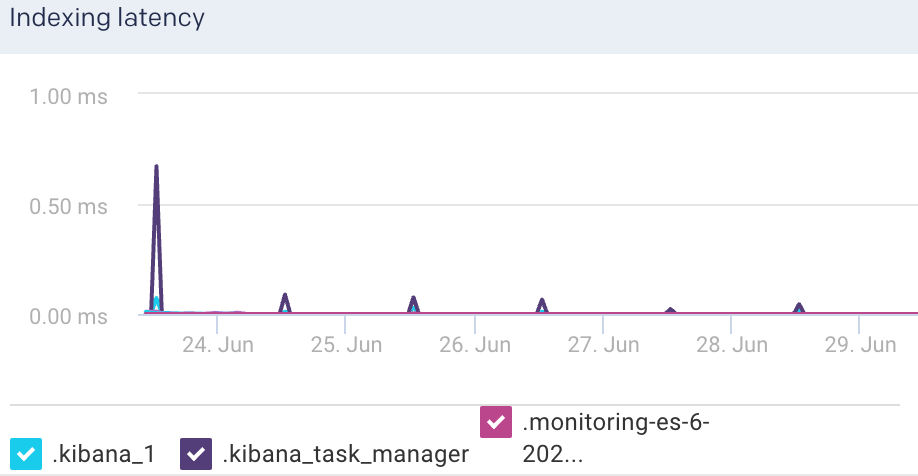
Indexing Latency: This graph plots the time taken to index the documents in Elasticsearch.
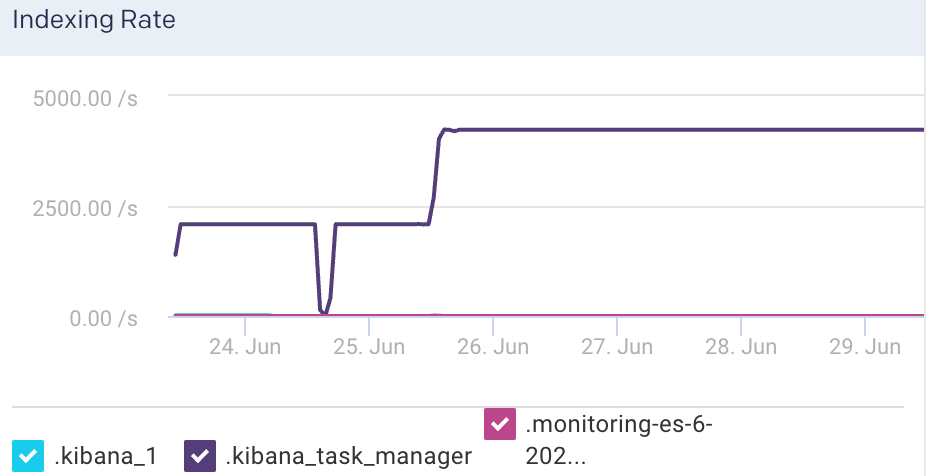
Indexing Rate: This graph plots the rate at which documents are indexed in Elasticsearch
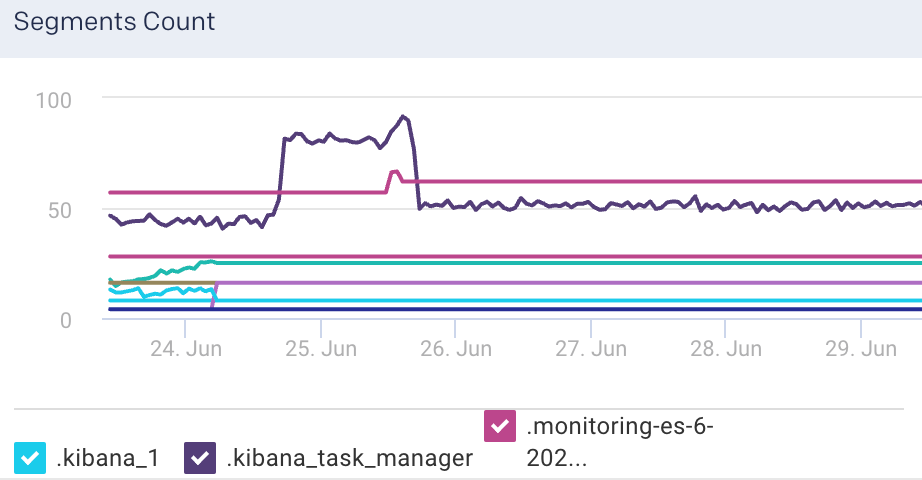
Segments Count: This graph plots the count of indexing segments operation.
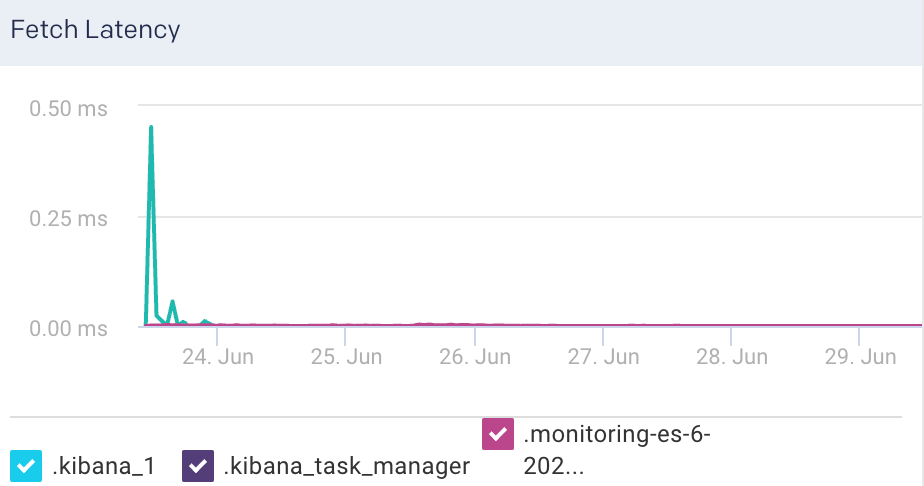
Fetch Latency: This graph plots the fetch latency for the indices.
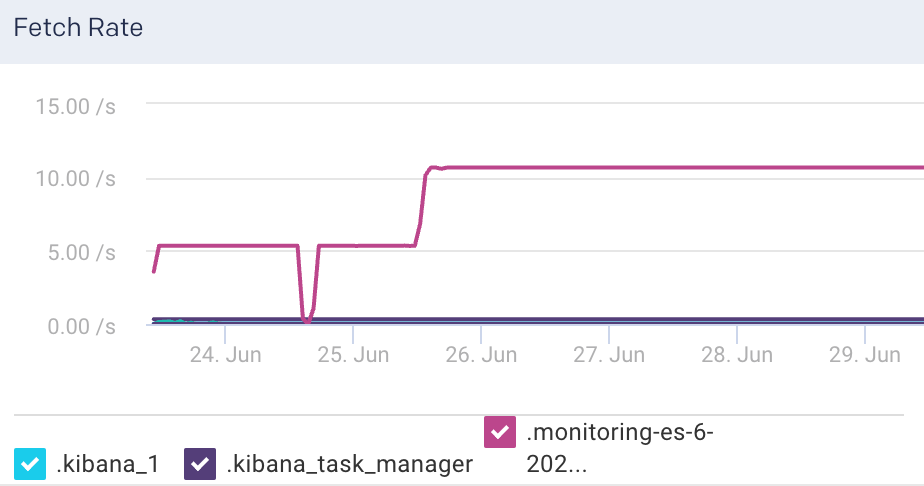
Fetch Rate: This graph plots the time taken to fetch the query results.
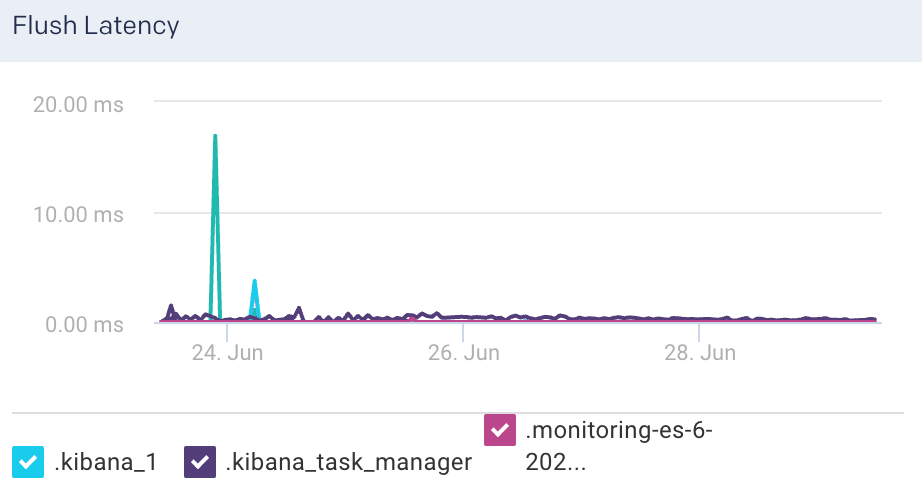
Flush Latency: This graph plots the time taken to flush indices.
Flush Rate: This graph plots the rate at which indices are flushed.